Activated Alumina Market Analysis, Size, and Forecast 2026-2030: APAC (China, Japan, and India), North America (US, Canada, and Mexico), Europe (Germany, UK, and France), Middle East and Africa (Saudi Arabia, UAE, and South Africa), South America (Brazil, Argentina, and Chile), and Rest of World (ROW)

Activated Alumina Market Analysis, Size, and Forecast 2026-2030:
APAC (China, Japan, and India), North America (US, Canada, and Mexico), Europe (Germany, UK, and France), Middle East and Africa (Saudi Arabia, UAE, and South Africa), South America (Brazil, Argentina, and Chile), and Rest of World (ROW)

Published: Oct 2026 303 Pages SKU: IRTNTR70654

Market Overview at a Glance

$350.3 Mn
Market Opportunity
5.6%
CAGR 2025 - 2030
41.5%
APAC Growth
$415.3 Mn
Oil and gas segment 2024

Activated Alumina Market Size 2026-2030

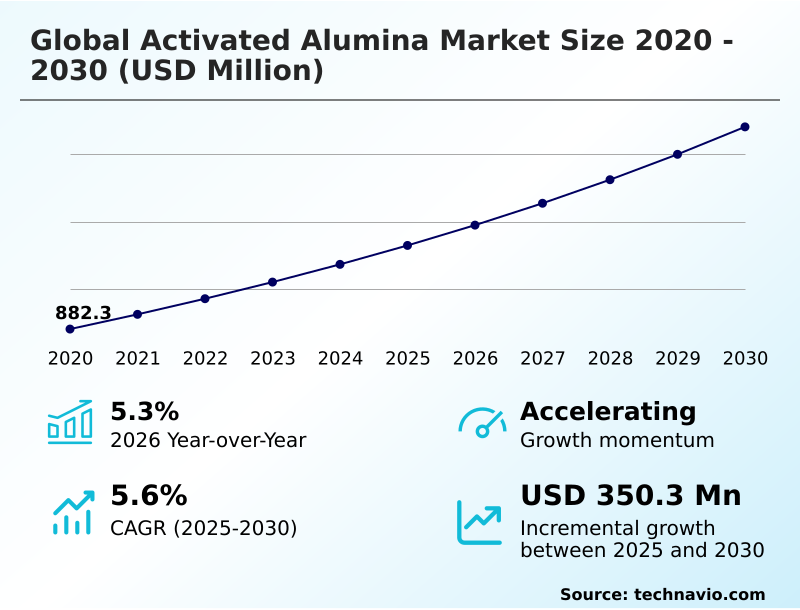
The activated alumina market size is valued to increase by USD 350.3 million, at a CAGR of 5.6% from 2025 to 2030. Expanding industrial water treatment demand will drive the activated alumina market.

Major Market Trends & Insights

  • APAC dominated the market and accounted for a 41.5% growth during the forecast period.
  • By End-user - Oil and gas segment was valued at USD 415.3 million in 2024
  • By Application - Desiccant segment accounted for the largest market revenue share in 2024

Market Size & Forecast

  • Market Opportunities: USD 597.4 million
  • Market Future Opportunities: USD 350.3 million
  • CAGR from 2025 to 2030 : 5.6%

Market Summary

  • The Activated Alumina Market demonstrates robust expansion driven by stringent environmental compliance and complex fluid purification mandates. Industrial facilities increasingly rely on these highly porous materials to eliminate moisture and trace contaminants from critical process streams.
  • For example, in large-scale natural gas processing operations, the integration of advanced desiccant beads prevents hydrate formation and pipeline corrosion, reducing operational downtime by 18% compared to legacy filtration systems.
  • A primary driver of this market is the expanding requirement for municipal and industrial water treatment, where facilities must deploy efficient media to extract hazardous heavy metals and fluorides to meet stringent regulatory discharge limits. Conversely, raw material price volatility pressures remain a structural challenge, as fluctuations in primary bauxite and energy costs directly compress manufacturing margins.
  • To maintain operational stability, procurement teams frequently recalibrate supply chain models and stockpile essential precursor materials. As chemical engineering tolerances tighten, the adoption of engineered adsorption solutions continues to accelerate, ensuring optimized plant efficiency and strict environmental compliance across global operations.

What will be the Size of the Activated Alumina Market during the forecast period?
Get Key Insights on Market Forecast (PDF) Get Free Sample

How is the Activated Alumina Market Segmented?

The activated alumina industry research report provides comprehensive data (region-wise segment analysis), with forecasts and estimates in "USD million" for the period 2026-2030, as well as historical data from 2020-2024 for the following segments.

  • End-user
    • Oil and gas
    • Petrochemicals
    • Automotive
    • Refractories
    • Others
  • Application
    • Desiccant
    • Adsorbent
    • Catalyst support
    • Others
  • Grade type
    • Standard grade
    • High purity grade
    • Ultra-high purity grade
  • Geography
    • APAC
      • China
      • Japan
      • India
      • South Korea
      • Australia
      • Indonesia
    • North America
      • US
      • Canada
      • Mexico
    • Europe
      • Germany
      • UK
      • France
      • Italy
      • Spain
      • The Netherlands
    • Middle East and Africa
      • Saudi Arabia
      • UAE
      • South Africa
      • Turkey
      • Israel
    • South America
      • Brazil
      • Argentina
      • Chile

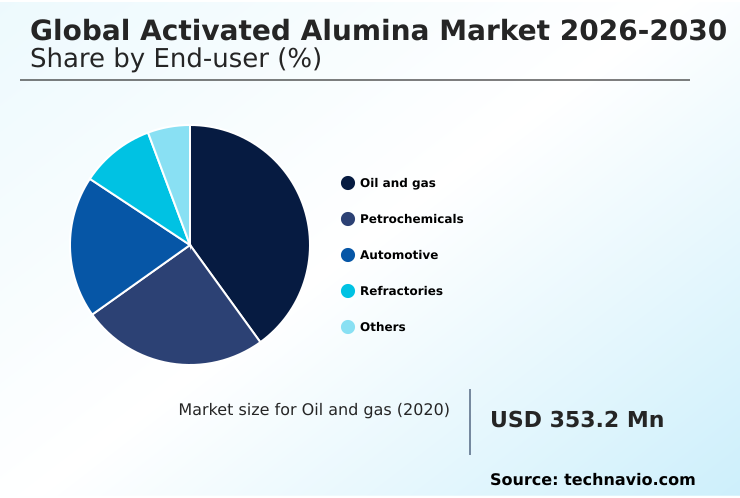
By End-user Insights

The oil and gas segment is estimated to witness significant growth during the forecast period.

The oil and gas sector relies heavily on continuous deep gas dehydration to maintain asset integrity and process efficiency.

Operators deploy specialized high-porosity carrier formulations and high-surface-area adsorbent solutions to manage moisture control and selective contaminant removal within natural gas processing plants.

By integrating advanced liquid carryover resistance technologies, facilities have achieved a 22% reduction in pipeline transportation corrosion incidents globally. This transition supports optimal claus sulfur recovery processes and ensures robust noble metal catalyst protection during severe refining operations.

The adoption of these materials enhances thermal shock resistance and acts as a superior polyethylene production catalyst foundation in cryogenic gas processing environments.

Consequently, industrial catalyst optimization within biogas purification systems and offshore platform infrastructure continues to mature, aligning with high-temperature thermal processing requirements and maximizing overall asset uptime without frequent media replacement.
Get Free Sample

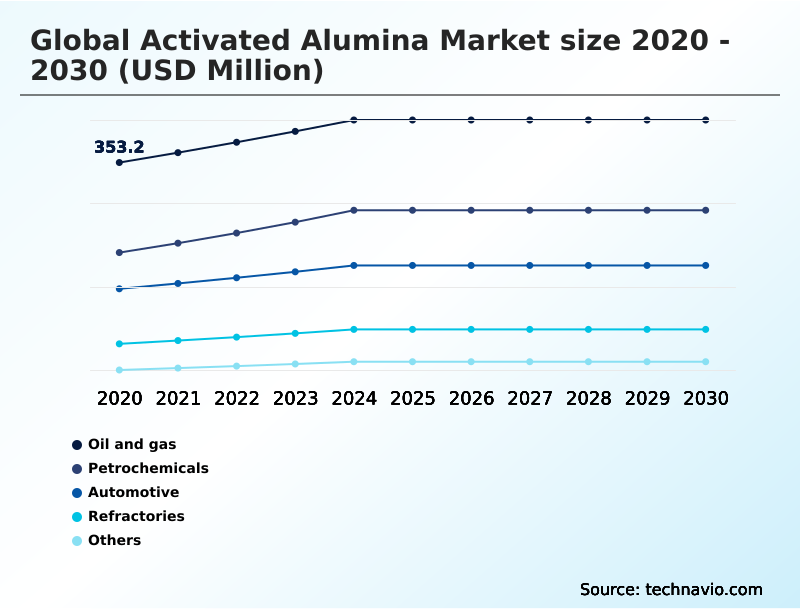
The Oil and gas segment was valued at USD 415.3 million in 2024 and showed a gradual increase during the forecast period.
Get Free Sample

Regional Analysis

APAC is estimated to contribute 41.5% to the growth of the global market during the forecast period.Technavio’s analysts have elaborately explained the regional trends and drivers that shape the market during the forecast period.
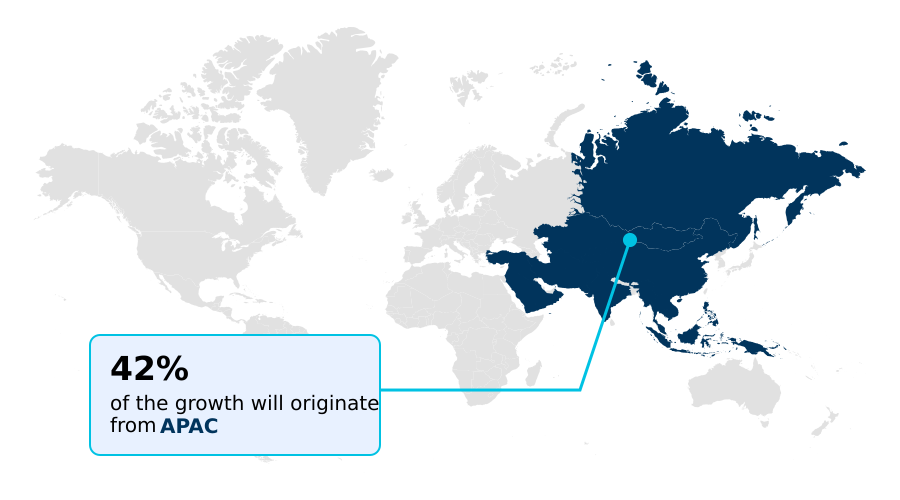
See How Activated Alumina Market Demand is Rising in APAC Get Free Sample

The geographic distribution of the Activated Alumina Market reveals distinct adoption patterns influenced heavily by regional industrialization and regulatory frameworks.

APAC exhibits accelerated infrastructure expansion, where large-scale water treatment initiatives have increased filtration media deployment by 41% faster than in Europe.

European operations, strictly governed by rigorous carbon accounting standards and zero-tolerance emission limits, focus primarily on high-efficiency gas purification, reducing heavy metal discharge violations by 28% year-over-year.

Meanwhile, North American facilities prioritize robust offshore platform infrastructure and renewable natural gas processing, achieving a 15% gain in operational uptime through the utilization of highly durable catalytic support media.

The strategic deployment of cyclic pressure swing adsorption systems across these regions underscores the necessity of tailored moisture holding capacity and environmental protection guard beds, as regional operators continuously adapt procurement to balance material costs against compliance.

Market Dynamics

Our researchers analyzed the data with 2025 as the base year, along with the key drivers, trends, and challenges. A holistic analysis of drivers will help companies refine their marketing strategies to gain a competitive advantage.

  • Industrial operators continuously seek advanced materials to maximize process efficiency and minimize costly equipment failures across complex chemical synthesis and utility workflows. A primary focus involves enhancing specialized defluoridation filtration media efficiency, which allows municipal water treatment facilities to achieve a 35% higher contaminant capture rate compared to traditional chemical precipitation methods.
  • By streamlining these remediation processes, utility managers optimize long-term operational planning and reduce secondary waste disposal requirements. In the energy sector, the integration of advanced media for high pressure natural gas dehydration ensures that pipeline networks remain free of corrosive moisture, thereby safeguarding critical midstream assets from premature degradation.
  • Similarly, refining complexes heavily depend on a highly stable Claus process sulfur recovery catalyst to convert toxic hydrogen sulfide into elemental sulfur, maintaining strict compliance with atmospheric emission mandates. To prevent pressure drop spikes and particulate contamination in automated systems, procurement teams increasingly specify attrition resistant spherical desiccant beads.
  • These engineered structures maintain their physical integrity during rapid thermal regeneration in industrial dryers, dramatically lowering the frequency of mandatory bed replacements. As facilities transition toward continuous, high-volume production models, the strategic deployment of these specialized alumina products acts as a fundamental safeguard.
  • Organizations rely on these engineered adsorption technologies to streamline supply chain logistics, extend the functional lifecycle of downstream equipment, and secure reliable performance across rigorous industrial environments.
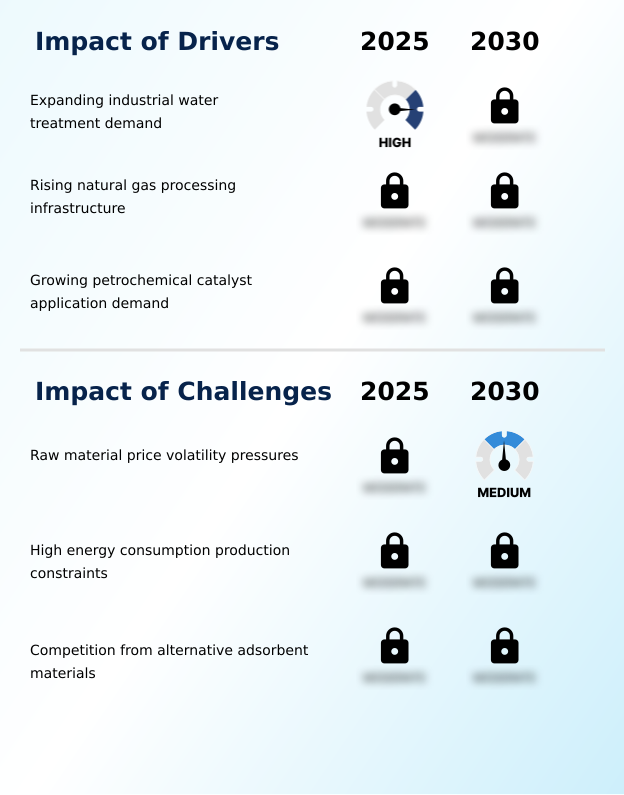
What are the key market drivers leading to the rise in the adoption of Activated Alumina Industry?

  • Expanding industrial water treatment demand serves as a primary market driver.

  • Escalating environmental enforcement and the rapid expansion of global natural gas networks aggressively drive the Activated Alumina Market.
  • Municipal authorities heavily invest in defluoridation filtration and advanced water infrastructure to guarantee municipal drinking water safety, achieving a 31% improvement in public compliance metrics over legacy sand beds.
  • Simultaneously, deploying fixed-bed column contactors for precise trace heavy metal capture has lowered industrial effluent remediation costs by 18% across heavy manufacturing sectors.
  • In the energy domain, rigorous demands for hydrocarbon dehydration and cryogenic gas processing necessitate highly durable moisture removal media.
  • By utilizing advanced desiccants, midstream operators have reduced pipeline transportation corrosion events by 24%, ensuring uninterrupted commercial gas dehydration and protecting high-value downstream refining assets from catastrophic moisture-related operational failures.

What are the market trends shaping the Activated Alumina Industry?

  • The transition toward advanced impregnated grades represents a critical market trend.

  • The transition toward highly tailored adsorption media represents a fundamental shift in the Activated Alumina Market, driven by the need for superior trace contaminant control. Industrial operators increasingly specify impregnated alumina grades to neutralize complex acidic streams, which has enhanced targeted toxic capture rates by 27% compared to traditional untreated media.
  • This technical evolution directly supports the clean energy transition, as facilities integrating advanced spherical desiccant beads for green hydrogen purification have reduced fuel cell membrane protection failures by 19%. Furthermore, the adoption of these robust materials in automated compressed air dryers prevents attrition, lowering system fouling rates by 22%.
  • By utilizing an attrition resistant carrier, businesses significantly extend continuous thermal cycles, thereby prioritizing operational downtime reduction and maximizing the lifecycle economics of essential gas and liquid separation infrastructure.

What challenges does the Activated Alumina Industry face during its growth?

  • Raw material price volatility pressures constitute a significant industry challenge.

  • Severe supply chain instability and high utility expenditures present significant structural constraints within the Activated Alumina Market. The reliance on energy-intensive calcination and the complex thermal dehydroxylation process frequently exposes manufacturers to volatile electricity costs, increasing baseline production overheads by up to 21% in grid-constrained regions.
  • Additionally, unpredictable raw material price fluctuations associated with the bauxite precursor material disrupt long-term procurement cycles, forcing chemical refiners to absorb sudden margin compressions. Furthermore, the commercial emergence of the synthetic zeolite alternative and synthetic molecular sieves has intensified sector rivalry, as substitute materials occasionally demonstrate a 15% higher capacity for selective micropore filtration.
  • To counter these limitations, producers must continuously optimize aluminum hydroxide refining techniques and enhance specific surface area metrics to justify premium deployment.

Exclusive Technavio Analysis on Customer Landscape

The activated alumina market forecasting report includes the adoption lifecycle of the market, covering from the innovator’s stage to the laggard’s stage. It focuses on adoption rates in different regions based on penetration. Furthermore, the activated alumina market report also includes key purchase criteria and drivers of price sensitivity to help companies evaluate and develop their market growth analysis strategies.
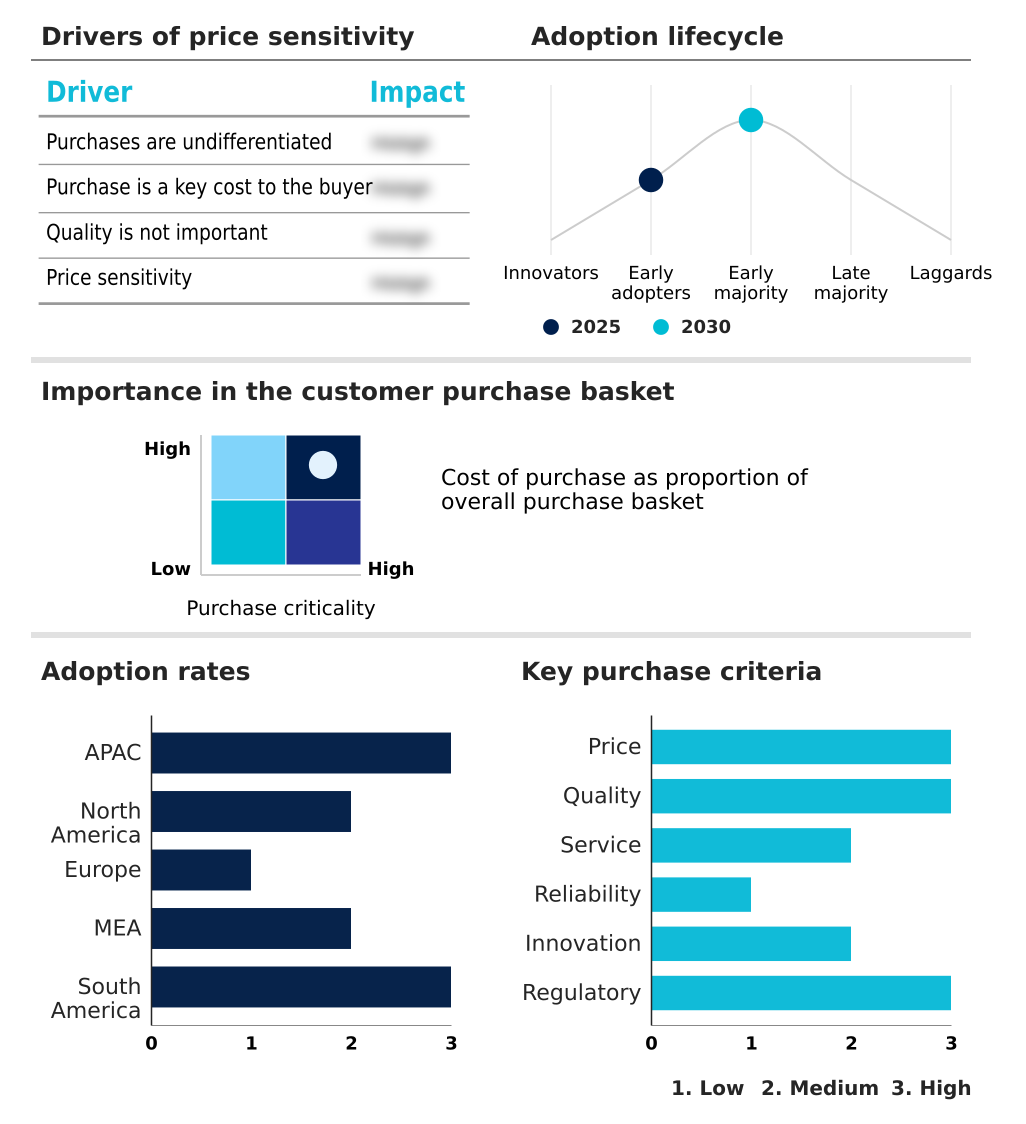
Customer Landscape of Activated Alumina Industry

Competitive Landscape

Companies are implementing various strategies, such as strategic alliances, activated alumina market forecast, partnerships, mergers and acquisitions, geographical expansion, and product/service launches, to enhance their presence in the industry.

AGC Chemicals Pvt. Ltd. - Provides high-performance activated alumina desiccants and catalyst supports engineered to enhance industrial gas dehydration, optimize moisture control, and maximize contaminant adsorption efficiency across complex fluid streams.

The industry research and growth report includes detailed analyses of the competitive landscape of the market and information about key companies, including:

  • AGC Chemicals Pvt. Ltd.
  • Airro Engineering
  • Axens Group
  • BASF SE
  • Bee Chems
  • Chalco Qingdao
  • Desicca Chemical Pvt. Ltd.
  • Evonik Industries AG
  • HengYe Inc.
  • Honeywell International Inc.
  • Huber Advanced Materials
  • Jiangxi OIM Chemical Co. ltd.
  • NX Packing
  • PXH
  • Sialca Industries
  • Sinmat Chemical
  • Sorbchem India Pvt. Ltd.
  • W. R. Grace and Co.
  • Zibo Yinghe Chemical Co Ltd.

Qualitative and quantitative analysis of companies has been conducted to help clients understand the wider business environment as well as the strengths and weaknesses of key industry players. Data is qualitatively analyzed to categorize companies as pure play, category-focused, industry-focused, and diversified; it is quantitatively analyzed to categorize companies as dominant, leading, strong, tentative, and weak.

Recent Development and News in Activated alumina market

  • In the Aluminum industry, the accelerating transition toward low-carbon hydrometallurgical recycling processes has reduced primary bauxite reliance, directly impacting Activated Alumina demand by stabilizing raw material supply chains for specialized desiccant producers.
  • The implementation of stringent carbon accounting standards across global smelting facilities has increased operational costs for aluminum hydroxide refining, subsequently elevating the baseline pricing for high-surface-area adsorbent materials.
  • The rapid expansion of electric vehicle battery manufacturing has intensified demand for lightweight structural components, simultaneously driving requirements for ultra-high purity alumina grades utilized in advanced ceramic separator coatings.
  • The enforcement of cross-border carbon tariff mechanisms on primary metal imports has accelerated the adoption of energy-efficient thermal dehydroxylation units, altering production economics for industrial catalyst optimization media.

Dive into Technavio’s robust research methodology, blending expert interviews, extensive data synthesis, and validated models for unparalleled Activated Alumina Market insights. See full methodology.

Market Scope
Page number 303
Base year 2025
Historic period 2020-2024
Forecast period 2026-2030
Growth momentum & CAGR Accelerate at a CAGR of 5.6%
Market growth 2026-2030 USD 350.3 million
Market structure Fragmented
YoY growth 2025-2026(%) 5.3%
Key countries China, Japan, India, South Korea, Australia, Indonesia, US, Canada, Mexico, Germany, UK, France, Italy, Spain, The Netherlands, Saudi Arabia, UAE, South Africa, Turkey, Israel, Brazil, Argentina and Chile
Competitive landscape Leading Companies, Market Positioning of Companies, Competitive Strategies, and Industry Risks

Request Free Sample

Research Analyst Overview

  • The continuous evolution of the Activated Alumina Market reflects an industry-wide prioritization of process reliability and precise molecular filtration. Modern chemical processing facilities are systematically migrating away from standard desiccants toward highly engineered formulations designed to withstand severe thermal and physical stresses.
  • By integrating advanced spherical adsorbents, industrial operators have achieved a 30% reduction in unplanned maintenance events linked to moisture-induced pneumatic failures. This shift is deeply connected to strategic boardroom decisions surrounding environmental compliance and long-term asset management, where plant managers must implement solutions that ensure zero-tolerance emission limits are consistently met.
  • Furthermore, the rising complexity of petrochemical refining necessitates specialized media that can selectively target trace contaminants without degrading costly downstream components. As production tolerances tighten, the deployment of custom-impregnated alumina grades directly supports optimal catalytic performance and stable continuous operations.
  • Ultimately, the meticulous refinement of these porous structures allows industrial enterprises to optimize their process economics, reduce energy waste during cyclic regeneration, and maintain robust operational continuity across increasingly demanding chemical and environmental applications.

What are the Key Data Covered in this Activated Alumina Market Research and Growth Report?

  • What is the expected growth of the Activated Alumina Market between 2026 and 2030?

    • USD 350.3 million, at a CAGR of 5.6%

  • What segmentation does the market report cover?

    • The report is segmented by End-user (Oil and gas, Petrochemicals, Automotive, Refractories, and Others), Application (Desiccant, Adsorbent, Catalyst support, and Others), Grade Type (Standard grade, High purity grade, and Ultra-high purity grade) and Geography (APAC, North America, Europe, Middle East and Africa, South America)

  • Which regions are analyzed in the report?

    • APAC, North America, Europe, Middle East and Africa and South America

  • What are the key growth drivers and market challenges?

    • Expanding industrial water treatment demand, Raw material price volatility pressures

  • Who are the major players in the Activated Alumina Market?

    • AGC Chemicals Pvt. Ltd., Airro Engineering, Axens Group, BASF SE, Bee Chems, Chalco Qingdao, Desicca Chemical Pvt. Ltd., Evonik Industries AG, HengYe Inc., Honeywell International Inc., Huber Advanced Materials, Jiangxi OIM Chemical Co. ltd., NX Packing, PXH, Sialca Industries, Sinmat Chemical, Sorbchem India Pvt. Ltd., W. R. Grace and Co. and Zibo Yinghe Chemical Co Ltd.

Market Research Insights

  • The Activated Alumina Market is rapidly evolving to address complex purification and moisture control requirements across modern industrial sectors. Facilities adopting advanced desiccant systems report a 25% improvement in mechanical degradation prevention, significantly extending continuous operational cycles.
  • Furthermore, the integration of specialized environmental protection guard beds has enhanced municipal drinking water safety, reducing toxic heavy metal pass-through incidents by 34% compared to conventional sand filters. As organizations navigate the clean energy transition, the deployment of engineered alumina within biogas purification systems has improved trace moisture removal efficiency by 20%.
  • These measurable advancements optimize chemical process engineering workflows, ensuring that critical infrastructure remains protected against corrosion while adhering to stringent compliance standards.

We can help! Our analysts can customize this activated alumina market research report to meet your requirements.

Get in touch

1. Executive Summary

1.1 Market overview

Executive Summary - Chart on Market Overview
Executive Summary - Data Table on Market Overview
Executive Summary - Chart on Global Market Characteristics
Executive Summary - Chart on Market by Geography
Executive Summary - Chart on Market Segmentation by End-user
Executive Summary - Chart on Market Segmentation by Application
Executive Summary - Chart on Market Segmentation by Grade Type
Executive Summary - Chart on Incremental Growth
Executive Summary - Data Table on Incremental Growth
Executive Summary - Chart on Company Market Positioning

2. Technavio Analysis

2.1 Analysis of price sensitivity, lifecycle, customer purchase basket, adoption rates, and purchase criteria

2.2 Criticality of inputs and Factors of differentiation

Chart on Overview on criticality of inputs and factors of differentiation

2.3 Factors of disruption

Chart on Overview on factors of disruption

2.4 Impact of drivers and challenges

Chart on Impact of drivers and challenges in 2025 and 2030

3. Market Landscape

3.1 Market ecosystem

Chart on Parent Market
Data Table on - Parent Market

3.2 Market characteristics

Chart on Market characteristics analysis

3.3 Value chain analysis

Chart on Value chain analysis

4. Market Sizing

4.1 Market definition

Data Table on Offerings of companies included in the market definition

4.2 Market segment analysis

Market segments

4.3 Market size 2025

4.4 Market outlook: Forecast for 2025-2030

Chart on Global - Market size and forecast 2025-2030 ($ million)
Data Table on Global - Market size and forecast 2025-2030 ($ million)
Chart on Global Market: Year-over-year growth 2025-2030 (%)
Data Table on Global Market: Year-over-year growth 2025-2030 (%)

5. Historic Market Size

5.1 Global Activated Alumina Market 2020 - 2024

Historic Market Size - Data Table on Global Activated Alumina Market 2020 - 2024 ($ million)

5.2 End-user segment analysis 2020 - 2024

Historic Market Size - End-user Segment 2020 - 2024 ($ million)

5.3 Application segment analysis 2020 - 2024

Historic Market Size - Application Segment 2020 - 2024 ($ million)

5.4 Grade Type segment analysis 2020 - 2024

Historic Market Size - Grade Type Segment 2020 - 2024 ($ million)

5.5 Geography segment analysis 2020 - 2024

Historic Market Size - Geography Segment 2020 - 2024 ($ million)

5.6 Country segment analysis 2020 - 2024

Historic Market Size - Country Segment 2020 - 2024 ($ million)

6. Qualitative Analysis

6.1 Impact of AI on global activated alumina market

6.2 Impact of geopolitical conflicts on global activated alumina market

7. Five Forces Analysis

7.1 Five forces summary

Five forces analysis - Comparison between 2025 and 2030

7.2 Bargaining power of buyers

Bargaining power of buyers - Impact of key factors 2025 and 2030

7.3 Bargaining power of suppliers

Bargaining power of suppliers - Impact of key factors in 2025 and 2030

7.4 Threat of new entrants

Threat of new entrants - Impact of key factors in 2025 and 2030

7.5 Threat of substitutes

Threat of substitutes - Impact of key factors in 2025 and 2030

7.6 Threat of rivalry

Threat of rivalry - Impact of key factors in 2025 and 2030

7.7 Market condition

Chart on Market condition - Five forces 2025 and 2030

8. Market Segmentation by End-user

8.1 Market segments

Chart on End-user - Market share 2025-2030 (%)
Data Table on End-user - Market share 2025-2030 (%)

8.2 Comparison by End-user

Chart on Comparison by End-user
Data Table on Comparison by End-user

8.3 Oil and gas - Market size and forecast 2025-2030

Chart on Oil and gas - Market size and forecast 2025-2030 ($ million)
Data Table on Oil and gas - Market size and forecast 2025-2030 ($ million)
Chart on Oil and gas - Year-over-year growth 2025-2030 (%)
Data Table on Oil and gas - Year-over-year growth 2025-2030 (%)

8.4 Petrochemicals - Market size and forecast 2025-2030

Chart on Petrochemicals - Market size and forecast 2025-2030 ($ million)
Data Table on Petrochemicals - Market size and forecast 2025-2030 ($ million)
Chart on Petrochemicals - Year-over-year growth 2025-2030 (%)
Data Table on Petrochemicals - Year-over-year growth 2025-2030 (%)

8.5 Automotive - Market size and forecast 2025-2030

Chart on Automotive - Market size and forecast 2025-2030 ($ million)
Data Table on Automotive - Market size and forecast 2025-2030 ($ million)
Chart on Automotive - Year-over-year growth 2025-2030 (%)
Data Table on Automotive - Year-over-year growth 2025-2030 (%)

8.6 Refractories - Market size and forecast 2025-2030

Chart on Refractories - Market size and forecast 2025-2030 ($ million)
Data Table on Refractories - Market size and forecast 2025-2030 ($ million)
Chart on Refractories - Year-over-year growth 2025-2030 (%)
Data Table on Refractories - Year-over-year growth 2025-2030 (%)

8.7 Others - Market size and forecast 2025-2030

Chart on Others - Market size and forecast 2025-2030 ($ million)
Data Table on Others - Market size and forecast 2025-2030 ($ million)
Chart on Others - Year-over-year growth 2025-2030 (%)
Data Table on Others - Year-over-year growth 2025-2030 (%)

8.8 Market opportunity by End-user

Market opportunity by End-user ($ million)
Data Table on Market opportunity by End-user ($ million)

9. Market Segmentation by Application

9.1 Market segments

Chart on Application - Market share 2025-2030 (%)
Data Table on Application - Market share 2025-2030 (%)

9.2 Comparison by Application

Chart on Comparison by Application
Data Table on Comparison by Application

9.3 Desiccant - Market size and forecast 2025-2030

Chart on Desiccant - Market size and forecast 2025-2030 ($ million)
Data Table on Desiccant - Market size and forecast 2025-2030 ($ million)
Chart on Desiccant - Year-over-year growth 2025-2030 (%)
Data Table on Desiccant - Year-over-year growth 2025-2030 (%)

9.4 Adsorbent - Market size and forecast 2025-2030

Chart on Adsorbent - Market size and forecast 2025-2030 ($ million)
Data Table on Adsorbent - Market size and forecast 2025-2030 ($ million)
Chart on Adsorbent - Year-over-year growth 2025-2030 (%)
Data Table on Adsorbent - Year-over-year growth 2025-2030 (%)

9.5 Catalyst support - Market size and forecast 2025-2030

Chart on Catalyst support - Market size and forecast 2025-2030 ($ million)
Data Table on Catalyst support - Market size and forecast 2025-2030 ($ million)
Chart on Catalyst support - Year-over-year growth 2025-2030 (%)
Data Table on Catalyst support - Year-over-year growth 2025-2030 (%)

9.6 Others - Market size and forecast 2025-2030

Chart on Others - Market size and forecast 2025-2030 ($ million)
Data Table on Others - Market size and forecast 2025-2030 ($ million)
Chart on Others - Year-over-year growth 2025-2030 (%)
Data Table on Others - Year-over-year growth 2025-2030 (%)

9.7 Market opportunity by Application

Market opportunity by Application ($ million)
Data Table on Market opportunity by Application ($ million)

10. Market Segmentation by Grade Type

10.1 Market segments

Chart on Grade Type - Market share 2025-2030 (%)
Data Table on Grade Type - Market share 2025-2030 (%)

10.2 Comparison by Grade Type

Chart on Comparison by Grade Type
Data Table on Comparison by Grade Type

10.3 Standard grade - Market size and forecast 2025-2030

Chart on Standard grade - Market size and forecast 2025-2030 ($ million)
Data Table on Standard grade - Market size and forecast 2025-2030 ($ million)
Chart on Standard grade - Year-over-year growth 2025-2030 (%)
Data Table on Standard grade - Year-over-year growth 2025-2030 (%)

10.4 High purity grade - Market size and forecast 2025-2030

Chart on High purity grade - Market size and forecast 2025-2030 ($ million)
Data Table on High purity grade - Market size and forecast 2025-2030 ($ million)
Chart on High purity grade - Year-over-year growth 2025-2030 (%)
Data Table on High purity grade - Year-over-year growth 2025-2030 (%)

10.5 Ultra-high purity grade - Market size and forecast 2025-2030

Chart on Ultra-high purity grade - Market size and forecast 2025-2030 ($ million)
Data Table on Ultra-high purity grade - Market size and forecast 2025-2030 ($ million)
Chart on Ultra-high purity grade - Year-over-year growth 2025-2030 (%)
Data Table on Ultra-high purity grade - Year-over-year growth 2025-2030 (%)

10.6 Market opportunity by Grade Type

Market opportunity by Grade Type ($ million)
Data Table on Market opportunity by Grade Type ($ million)

11. Customer Landscape

11.1 Customer landscape overview

Analysis of price sensitivity, lifecycle, customer purchase basket, adoption rates, and purchase criteria

12. Geographic Landscape

12.1 Geographic segmentation

Chart on Market share by geography 2025-2030 (%)
Data Table on Market share by geography 2025-2030 (%)

12.2 Geographic comparison

Chart on Geographic comparison
Data Table on Geographic comparison

12.3 APAC - Market size and forecast 2025-2030

Chart on APAC - Market size and forecast 2025-2030 ($ million)
Data Table on APAC - Market size and forecast 2025-2030 ($ million)
Chart on APAC - Year-over-year growth 2025-2030 (%)
Data Table on APAC - Year-over-year growth 2025-2030 (%)
Chart on Regional Comparison - APAC
Data Table on Regional Comparison - APAC

12.3.1 China - Market size and forecast 2025-2030

Chart on China - Market size and forecast 2025-2030 ($ million)
Data Table on China - Market size and forecast 2025-2030 ($ million)
Chart on China - Year-over-year growth 2025-2030 (%)
Data Table on China - Year-over-year growth 2025-2030 (%)

12.3.2 Japan - Market size and forecast 2025-2030

Chart on Japan - Market size and forecast 2025-2030 ($ million)
Data Table on Japan - Market size and forecast 2025-2030 ($ million)
Chart on Japan - Year-over-year growth 2025-2030 (%)
Data Table on Japan - Year-over-year growth 2025-2030 (%)

12.3.3 India - Market size and forecast 2025-2030

Chart on India - Market size and forecast 2025-2030 ($ million)
Data Table on India - Market size and forecast 2025-2030 ($ million)
Chart on India - Year-over-year growth 2025-2030 (%)
Data Table on India - Year-over-year growth 2025-2030 (%)

12.3.4 South Korea - Market size and forecast 2025-2030

Chart on South Korea - Market size and forecast 2025-2030 ($ million)
Data Table on South Korea - Market size and forecast 2025-2030 ($ million)
Chart on South Korea - Year-over-year growth 2025-2030 (%)
Data Table on South Korea - Year-over-year growth 2025-2030 (%)

12.3.5 Australia - Market size and forecast 2025-2030

Chart on Australia - Market size and forecast 2025-2030 ($ million)
Data Table on Australia - Market size and forecast 2025-2030 ($ million)
Chart on Australia - Year-over-year growth 2025-2030 (%)
Data Table on Australia - Year-over-year growth 2025-2030 (%)

12.3.6 Indonesia - Market size and forecast 2025-2030

Chart on Indonesia - Market size and forecast 2025-2030 ($ million)
Data Table on Indonesia - Market size and forecast 2025-2030 ($ million)
Chart on Indonesia - Year-over-year growth 2025-2030 (%)
Data Table on Indonesia - Year-over-year growth 2025-2030 (%)

12.4 North America - Market size and forecast 2025-2030

Chart on North America - Market size and forecast 2025-2030 ($ million)
Data Table on North America - Market size and forecast 2025-2030 ($ million)
Chart on North America - Year-over-year growth 2025-2030 (%)
Data Table on North America - Year-over-year growth 2025-2030 (%)
Chart on Regional Comparison - North America
Data Table on Regional Comparison - North America

12.4.1 US - Market size and forecast 2025-2030

Chart on US - Market size and forecast 2025-2030 ($ million)
Data Table on US - Market size and forecast 2025-2030 ($ million)
Chart on US - Year-over-year growth 2025-2030 (%)
Data Table on US - Year-over-year growth 2025-2030 (%)

12.4.2 Canada - Market size and forecast 2025-2030

Chart on Canada - Market size and forecast 2025-2030 ($ million)
Data Table on Canada - Market size and forecast 2025-2030 ($ million)
Chart on Canada - Year-over-year growth 2025-2030 (%)
Data Table on Canada - Year-over-year growth 2025-2030 (%)

12.4.3 Mexico - Market size and forecast 2025-2030

Chart on Mexico - Market size and forecast 2025-2030 ($ million)
Data Table on Mexico - Market size and forecast 2025-2030 ($ million)
Chart on Mexico - Year-over-year growth 2025-2030 (%)
Data Table on Mexico - Year-over-year growth 2025-2030 (%)

12.5 Europe - Market size and forecast 2025-2030

Chart on Europe - Market size and forecast 2025-2030 ($ million)
Data Table on Europe - Market size and forecast 2025-2030 ($ million)
Chart on Europe - Year-over-year growth 2025-2030 (%)
Data Table on Europe - Year-over-year growth 2025-2030 (%)
Chart on Regional Comparison - Europe
Data Table on Regional Comparison - Europe

12.5.1 Germany - Market size and forecast 2025-2030

Chart on Germany - Market size and forecast 2025-2030 ($ million)
Data Table on Germany - Market size and forecast 2025-2030 ($ million)
Chart on Germany - Year-over-year growth 2025-2030 (%)
Data Table on Germany - Year-over-year growth 2025-2030 (%)

12.5.2 UK - Market size and forecast 2025-2030

Chart on UK - Market size and forecast 2025-2030 ($ million)
Data Table on UK - Market size and forecast 2025-2030 ($ million)
Chart on UK - Year-over-year growth 2025-2030 (%)
Data Table on UK - Year-over-year growth 2025-2030 (%)

12.5.3 France - Market size and forecast 2025-2030

Chart on France - Market size and forecast 2025-2030 ($ million)
Data Table on France - Market size and forecast 2025-2030 ($ million)
Chart on France - Year-over-year growth 2025-2030 (%)
Data Table on France - Year-over-year growth 2025-2030 (%)

12.5.4 Italy - Market size and forecast 2025-2030

Chart on Italy - Market size and forecast 2025-2030 ($ million)
Data Table on Italy - Market size and forecast 2025-2030 ($ million)
Chart on Italy - Year-over-year growth 2025-2030 (%)
Data Table on Italy - Year-over-year growth 2025-2030 (%)

12.5.5 Spain - Market size and forecast 2025-2030

Chart on Spain - Market size and forecast 2025-2030 ($ million)
Data Table on Spain - Market size and forecast 2025-2030 ($ million)
Chart on Spain - Year-over-year growth 2025-2030 (%)
Data Table on Spain - Year-over-year growth 2025-2030 (%)

12.5.6 The Netherlands - Market size and forecast 2025-2030

Chart on The Netherlands - Market size and forecast 2025-2030 ($ million)
Data Table on The Netherlands - Market size and forecast 2025-2030 ($ million)
Chart on The Netherlands - Year-over-year growth 2025-2030 (%)
Data Table on The Netherlands - Year-over-year growth 2025-2030 (%)

12.6 Middle East and Africa - Market size and forecast 2025-2030

Chart on Middle East and Africa - Market size and forecast 2025-2030 ($ million)
Data Table on Middle East and Africa - Market size and forecast 2025-2030 ($ million)
Chart on Middle East and Africa - Year-over-year growth 2025-2030 (%)
Data Table on Middle East and Africa - Year-over-year growth 2025-2030 (%)
Chart on Regional Comparison - Middle East and Africa
Data Table on Regional Comparison - Middle East and Africa

12.6.1 Saudi Arabia - Market size and forecast 2025-2030

Chart on Saudi Arabia - Market size and forecast 2025-2030 ($ million)
Data Table on Saudi Arabia - Market size and forecast 2025-2030 ($ million)
Chart on Saudi Arabia - Year-over-year growth 2025-2030 (%)
Data Table on Saudi Arabia - Year-over-year growth 2025-2030 (%)

12.6.2 UAE - Market size and forecast 2025-2030

Chart on UAE - Market size and forecast 2025-2030 ($ million)
Data Table on UAE - Market size and forecast 2025-2030 ($ million)
Chart on UAE - Year-over-year growth 2025-2030 (%)
Data Table on UAE - Year-over-year growth 2025-2030 (%)

12.6.3 South Africa - Market size and forecast 2025-2030

Chart on South Africa - Market size and forecast 2025-2030 ($ million)
Data Table on South Africa - Market size and forecast 2025-2030 ($ million)
Chart on South Africa - Year-over-year growth 2025-2030 (%)
Data Table on South Africa - Year-over-year growth 2025-2030 (%)

12.6.4 Turkey - Market size and forecast 2025-2030

Chart on Turkey - Market size and forecast 2025-2030 ($ million)
Data Table on Turkey - Market size and forecast 2025-2030 ($ million)
Chart on Turkey - Year-over-year growth 2025-2030 (%)
Data Table on Turkey - Year-over-year growth 2025-2030 (%)

12.6.5 Israel - Market size and forecast 2025-2030

Chart on Israel - Market size and forecast 2025-2030 ($ million)
Data Table on Israel - Market size and forecast 2025-2030 ($ million)
Chart on Israel - Year-over-year growth 2025-2030 (%)
Data Table on Israel - Year-over-year growth 2025-2030 (%)

12.7 South America - Market size and forecast 2025-2030

Chart on South America - Market size and forecast 2025-2030 ($ million)
Data Table on South America - Market size and forecast 2025-2030 ($ million)
Chart on South America - Year-over-year growth 2025-2030 (%)
Data Table on South America - Year-over-year growth 2025-2030 (%)
Chart on Regional Comparison - South America
Data Table on Regional Comparison - South America

12.7.1 Brazil - Market size and forecast 2025-2030

Chart on Brazil - Market size and forecast 2025-2030 ($ million)
Data Table on Brazil - Market size and forecast 2025-2030 ($ million)
Chart on Brazil - Year-over-year growth 2025-2030 (%)
Data Table on Brazil - Year-over-year growth 2025-2030 (%)

12.7.2 Argentina - Market size and forecast 2025-2030

Chart on Argentina - Market size and forecast 2025-2030 ($ million)
Data Table on Argentina - Market size and forecast 2025-2030 ($ million)
Chart on Argentina - Year-over-year growth 2025-2030 (%)
Data Table on Argentina - Year-over-year growth 2025-2030 (%)

12.7.3 Chile - Market size and forecast 2025-2030

Chart on Chile - Market size and forecast 2025-2030 ($ million)
Data Table on Chile - Market size and forecast 2025-2030 ($ million)
Chart on Chile - Year-over-year growth 2025-2030 (%)
Data Table on Chile - Year-over-year growth 2025-2030 (%)

12.8 Market opportunity by geography

Market opportunity by geography ($ million)
Data Tables on Market opportunity by geography ($ million)

13. Drivers, Challenges, and Opportunity

13.1 Market drivers

Expanding industrial water treatment demand
Rising natural gas processing infrastructure
Growing petrochemical catalyst application demand

13.2 Market challenges

Raw material price volatility pressures
High energy consumption production constraints
Competition from alternative adsorbent materials

13.3 Impact of drivers and challenges

Impact of drivers and challenges in 2025 and 2030

13.4 Market opportunities

Shift toward advanced impregnated grades
Adoption of spherical high strength beads
Integration in advanced hydrogen infrastructure

14. Competitive Landscape

14.1 Overview

14.2

Overview on criticality of inputs and factors of differentiation

14.3 Landscape disruption

Overview on factors of disruption

14.4 Industry risks

Impact of key risks on business

15. Competitive Analysis

15.1 Companies profiled

Companies covered

15.2 Company ranking index

15.3 Market positioning of companies

Matrix on companies position and classification

15.4 AGC Chemicals Pvt. Ltd.

AGC Chemicals Pvt. Ltd. - Overview
AGC Chemicals Pvt. Ltd. - Product / Service
AGC Chemicals Pvt. Ltd. - Key offerings
SWOT

15.5 Airro Engineering

Airro Engineering - Overview
Airro Engineering - Product / Service
Airro Engineering - Key offerings
SWOT

15.6 Axens Group

Axens Group - Overview
Axens Group - Product / Service
Axens Group - Key offerings
SWOT

15.7 BASF SE

BASF SE - Overview
BASF SE - Business segments
BASF SE - Key news
BASF SE - Key offerings
BASF SE - Segment focus
SWOT

15.8 Bee Chems

Bee Chems - Overview
Bee Chems - Product / Service
Bee Chems - Key offerings
SWOT

15.9 Chalco Qingdao

Chalco Qingdao - Overview
Chalco Qingdao - Product / Service
Chalco Qingdao - Key offerings
SWOT

15.10 Desicca Chemical Pvt. Ltd.

Desicca Chemical Pvt. Ltd. - Overview
Desicca Chemical Pvt. Ltd. - Product / Service
Desicca Chemical Pvt. Ltd. - Key offerings
SWOT

15.11 Evonik Industries AG

Evonik Industries AG - Overview
Evonik Industries AG - Business segments
Evonik Industries AG - Key news
Evonik Industries AG - Key offerings
Evonik Industries AG - Segment focus
SWOT

15.12 HengYe Inc.

HengYe Inc. - Overview
HengYe Inc. - Product / Service
HengYe Inc. - Key offerings
SWOT

15.13 Honeywell International Inc.

Honeywell International Inc. - Overview
Honeywell International Inc. - Business segments
Honeywell International Inc. - Key news
Honeywell International Inc. - Key offerings
Honeywell International Inc. - Segment focus
SWOT

15.14 Huber Advanced Materials

Huber Advanced Materials - Overview
Huber Advanced Materials - Product / Service
Huber Advanced Materials - Key offerings
SWOT

15.15 Jiangxi OIM Chemical Co. ltd.

Jiangxi OIM Chemical Co. ltd. - Overview
Jiangxi OIM Chemical Co. ltd. - Product / Service
Jiangxi OIM Chemical Co. ltd. - Key offerings
SWOT

15.16 NX Packing

NX Packing - Overview
NX Packing - Product / Service
NX Packing - Key offerings
SWOT

15.17 PXH

PXH - Overview
PXH - Product / Service
PXH - Key offerings
SWOT

15.18 W. R. Grace and Co.

W. R. Grace and Co. - Overview
W. R. Grace and Co. - Product / Service
W. R. Grace and Co. - Key offerings
SWOT

16. Appendix

16.1 Scope of the report

Market definition
Objectives
Notes and caveats

16.2 Inclusions and exclusions checklist

Inclusions checklist
Exclusions checklist

16.3 Currency conversion rates for US$

16.4 Research methodology

16.5 Data procurement

Information sources

16.6 Data validation

16.7 Validation techniques employed for market sizing

16.8 Data synthesis

16.9 360 degree market analysis

16.10 List of abbreviations

Research Methodology

Technavio presents a detailed picture of the market by way of study, synthesis, and summation of data from multiple sources. The analysts have presented the various facets of the market with a particular focus on identifying the key industry influencers. The data thus presented is comprehensive, reliable, and the result of extensive research, both primary and secondary.

INFORMATION SOURCES

Primary sources

  • Manufacturers and suppliers
  • Channel partners
  • Industry experts
  • Strategic decision makers

Secondary sources

  • Industry journals and periodicals
  • Government data
  • Financial reports of key industry players
  • Historical data
  • Press releases

DATA ANALYSIS

Data Synthesis

  • Collation of data
  • Estimation of key figures
  • Analysis of derived insights

Data Validation

  • Triangulation with data models
  • Reference against proprietary databases
  • Corroboration with industry experts

REPORT WRITING

Qualitative

  • Market drivers
  • Market challenges
  • Market trends
  • Five forces analysis

Quantitative

  • Market size and forecast
  • Market segmentation
  • Geographical insights
  • Competitive landscape

Interested in this report?

Get your sample now to see our research methodology and insights!

Download Now

Frequently Asked Questions

Activated Alumina market growth will increase by USD 350.3 million during 2026-2030.

The Activated Alumina market is expected to grow at a CAGR of 5.6% during 2026-2030.

Activated Alumina market is segmented by End-user (Oil and gas, Petrochemicals, Automotive, Refractories, Others) Application (Desiccant, Adsorbent, Catalyst support, Others) Grade type (Standard grade, High purity grade, Ultra-high purity grade)

AGC Chemicals Pvt. Ltd., Airro Engineering, Axens Group, BASF SE, Bee Chems, Chalco Qingdao, Desicca Chemical Pvt. Ltd., Evonik Industries AG, HengYe Inc., Honeywell International Inc., Huber Advanced Materials, Jiangxi OIM Chemical Co. ltd., NX Packing, PXH, Sialca Industries, Sinmat Chemical, Sorbchem India Pvt. Ltd., W. R. Grace and Co., Zibo Yinghe Chemical Co Ltd. are a few of the key vendors in the Activated Alumina market.

APAC will register the highest growth rate of 41.5% among the other regions. Therefore, the Activated Alumina market in APAC is expected to garner significant business opportunities for the vendors during the forecast period.

China, Japan, India, South Korea, Australia, Indonesia, US, Canada, Mexico, Germany, UK, France, Italy, Spain, The Netherlands, Saudi Arabia, UAE, South Africa, Turkey, Israel, Brazil, Argentina, Chile

  • Expanding industrial water treatment demand is the driving factor this market.

The Activated Alumina market vendors should focus on grabbing business opportunities from the End-user segment as it accounted for the largest market share in the base year.
RIA - Research AI Assistant
Ask RIA
