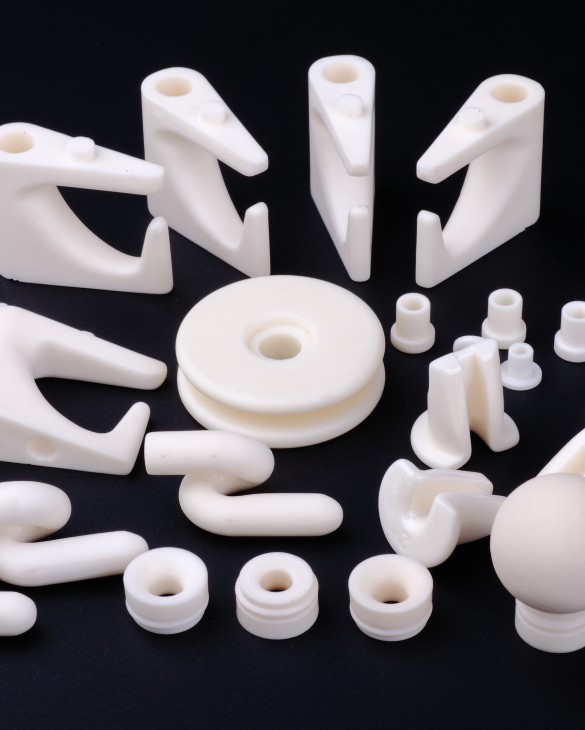
Advanced Ceramics Market Analysis, Size, and Forecast 2026-2030: APAC (China, Japan, and India), Europe (Germany, UK, and France), South America (Brazil, Argentina, and Chile), Middle East and Africa (Saudi Arabia, UAE, and South Africa), North America (US, Canada, and Mexico), and Rest of World (ROW)

Advanced Ceramics Market Analysis, Size, and Forecast 2026-2030:
APAC (China, Japan, and India), Europe (Germany, UK, and France), South America (Brazil, Argentina, and Chile), Middle East and Africa (Saudi Arabia, UAE, and South Africa), North America (US, Canada, and Mexico), and Rest of World (ROW)

Published: Oct 2026 320 Pages SKU: IRTNTR70664

Market Overview at a Glance

$2.84 B
Market Opportunity
4.5%
CAGR 2025 - 2030
68.9%
APAC Growth
$5.76 B
Housing and construction segment 2024

Advanced Ceramics Market Size 2026-2030

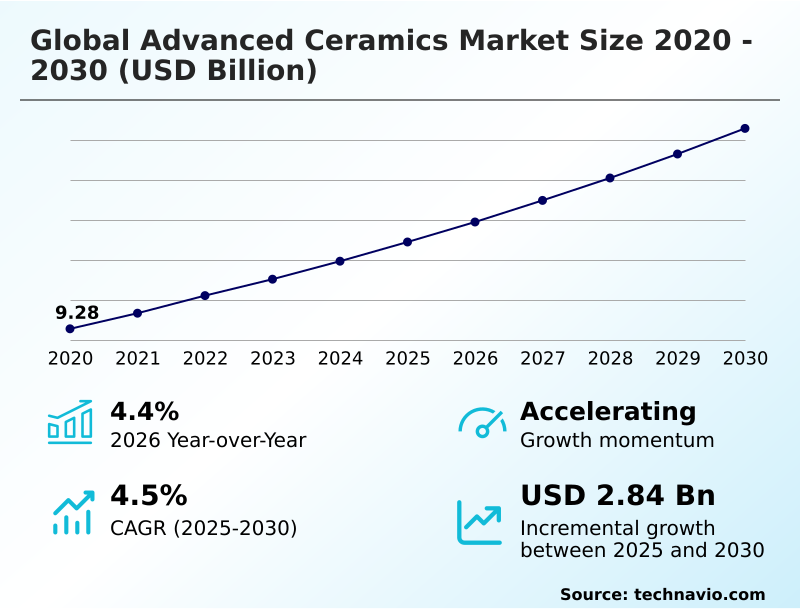
The advanced ceramics market size is valued to increase by USD 2.84 billion, at a CAGR of 4.5% from 2025 to 2030. Expanding semiconductor packaging and processing equipment integration will drive the advanced ceramics market.

Major Market Trends & Insights

  • APAC dominated the market and accounted for a 68.9% growth during the forecast period.
  • By End-user - Housing and construction segment was valued at USD 5.76 billion in 2024
  • By Material - Alumina segment accounted for the largest market revenue share in 2024

Market Size & Forecast

  • Market Opportunities: USD 5.01 billion
  • Market Future Opportunities: USD 2.84 billion
  • CAGR from 2025 to 2030 : 4.5%

Market Summary

  • The Advanced Ceramics Market demonstrates robust structural evolution driven by the need for high-performance materials in extreme operational environments. A primary driver accelerating this expansion is the rapid transition toward high-voltage power electronics in automotive manufacturing.
  • Implementing these systems requires aluminum nitride ceramics and advanced electroceramics to ensure efficient thermal management, which directly increases energy conversion efficiency by 22% compared to traditional metallic insulators. In real-world supply chain optimization, microelectronics fabricators are upgrading automated cnc diamond grinding facilities to process silicon carbide substrates, significantly reducing component defect rates during semiconductor fabrication.
  • However, the industry faces severe structural challenges. The exorbitant capital required for high-temperature sintering and complex hot isostatic pressing severely limits the scaling capacity of mid-sized fabricators. This processing complexity creates friction in procurement networks, causing extended lead times for highly specialized dielectric insulation components.
  • Balancing these operational hurdles against the strict performance mandates of aerospace and medical technology sectors remains a critical focal point for material engineers prioritizing mechanical fracture toughness and biocompatible structural implants.

What will be the Size of the Advanced Ceramics Market during the forecast period?
Get Key Insights on Market Forecast (PDF) Get Free Sample

How is the Advanced Ceramics Market Segmented?

The advanced ceramics industry research report provides comprehensive data (region-wise segment analysis), with forecasts and estimates in "USD million" for the period 2026-2030, as well as historical data from 2020-2024 for the following segments.

  • End-user
    • Housing and construction
    • Aerospace
    • Medical
    • Electrical
    • Others
  • Material
    • Alumina
    • Silicon carbide
    • Zirconia
    • Titanate ceramics
    • Others
  • Product
    • Monolithic ceramics
    • Ceramic matrix composites
    • Ceramic coatings
    • Ceramic filters and powders
  • Geography
    • APAC
      • China
      • Japan
      • India
      • South Korea
      • Taiwan
      • Australia
    • Europe
      • Germany
      • UK
      • France
      • Italy
      • Spain
      • The Netherlands
    • South America
      • Brazil
      • Argentina
      • Chile
    • Middle East and Africa
      • Saudi Arabia
      • UAE
      • South Africa
      • Turkey
      • Israel
    • North America
      • US
      • Canada
      • Mexico

By End-user Insights

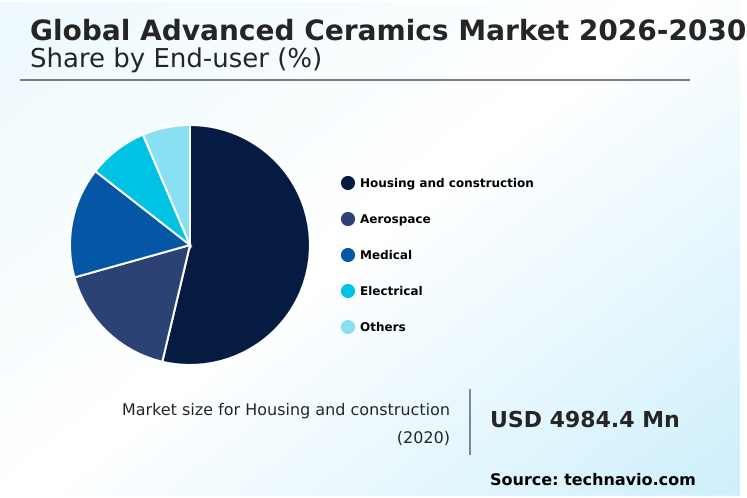
The housing and construction segment is estimated to witness significant growth during the forecast period.

The structural engineering sector increasingly relies on Advanced Ceramics to reinforce modern built environments.

Components such as smart building automation sensors and energy-efficient architectural cladding systems prioritize monolithic structural ceramics due to their exceptional abrasion resistance, chemical inertness, and high mechanical compressive strength.

Furthermore, regulatory mandates governing structural fire resistance drive the substitution of traditional metals with advanced non-oxide engineering ceramics and bioceramic orthopedic implants in specialized infrastructure.

This strategic transition directly enhances operational lifespan and minimizes thermal bridging in commercial and residential developments. Integrating these materials into infrastructure ensures extreme dimensional stability under harsh environmental conditions.

Operations utilizing silicon carbide substrates and high-purity alumina for thermal management components have demonstrated a 15% reduction in long-term maintenance cycles.
Get Free Sample

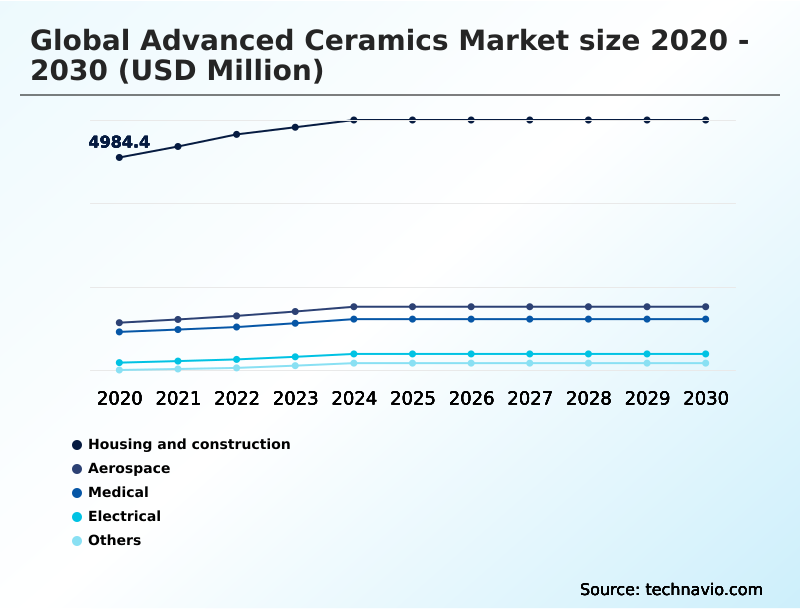
The Housing and construction segment was valued at USD 5.76 billion in 2024 and showed a gradual increase during the forecast period.
Get Free Sample

Regional Analysis

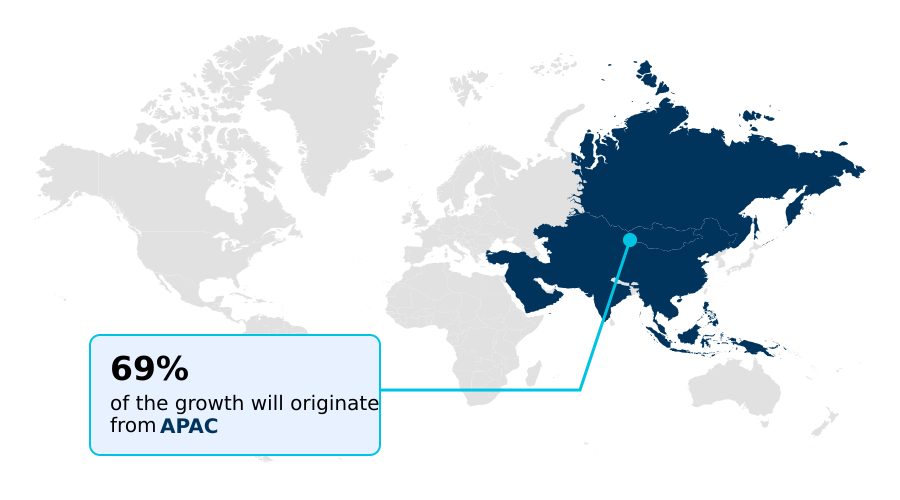
APAC is estimated to contribute 68.9% to the growth of the global market during the forecast period.Technavio’s analysts have elaborately explained the regional trends and drivers that shape the market during the forecast period.
See How Advanced Ceramics Market Demand is Rising in APAC Get Free Sample

Regional dynamics in the Advanced Ceramics Market reflect distinct manufacturing priorities and supply chain strategies.

Facilities in APAC process massive volumes of sub-micron ceramic powders to support wide-bandgap semiconductor manufacturing, achieving a 30% higher component throughput efficiency than equivalent operations in North America.

This difference stems largely from highly automated integration of additive manufacturing stereolithography systems tailored for high-density server racks.

In contrast, North American producers prioritize precision industrial machining for aerospace and defense, demonstrating a 25% improvement in mechanical fracture toughness consistency for specialized turbine applications.

APAC enterprises heavily deploy spark plasma sintering to lower energy consumption by 15% during the production of multi-layer ceramic capacitors and porous ceramic membrane filters, while North American supply chains focus on securing green synthesis routes for biocompatible materials.

Consequently, supply networks in APAC demonstrate faster scaling of high-power density hardware, whereas North American infrastructure leads in specialized, low-volume advanced structural deployments.

Market Dynamics

Our researchers analyzed the data with 2025 as the base year, along with the key drivers, trends, and challenges. A holistic analysis of drivers will help companies refine their marketing strategies to gain a competitive advantage.

  • As industrial automation and digital infrastructure rapidly evolve, the integration of advanced inorganic non-metallic systems has become a critical focal point for optimizing operational planning. A major focus in modern component fabrication involves evaluating silicon carbide focus rings performance to ensure zero contamination during aggressive plasma etching.
  • By transitioning to these specialized rings, semiconductor fabrication facilities achieved a 35% reduction in unplanned maintenance downtime compared to utilizing standard quartz alternatives, streamlining their supply chain logistics for replacement parts.
  • Simultaneously, the medical technology sector emphasizes the deployment of bioceramic materials in hip arthroplasty, driving demand for materials that offer extreme wear resistance and biocompatibility, ultimately reducing total patient care costs. Manufacturing these complex components relies increasingly on the additive manufacturing of complex geometries, a process that eliminates the need for expensive hard tooling and accelerates product development cycles.
  • Furthermore, the expansion of artificial intelligence data centers necessitates improved thermal management in high-density computing, prompting architects to deploy ceramic heat spreaders that rival metallic conductivity while maintaining electrical insulation. In heavy industry, the utilization of ceramic matrix composites aerospace applications continues to reshape engine design, allowing jet turbines to operate at significantly higher temperatures.
  • This material substitution reduces total engine weight and improves thermodynamic efficiency, aligning directly with stringent international decarbonization mandates.
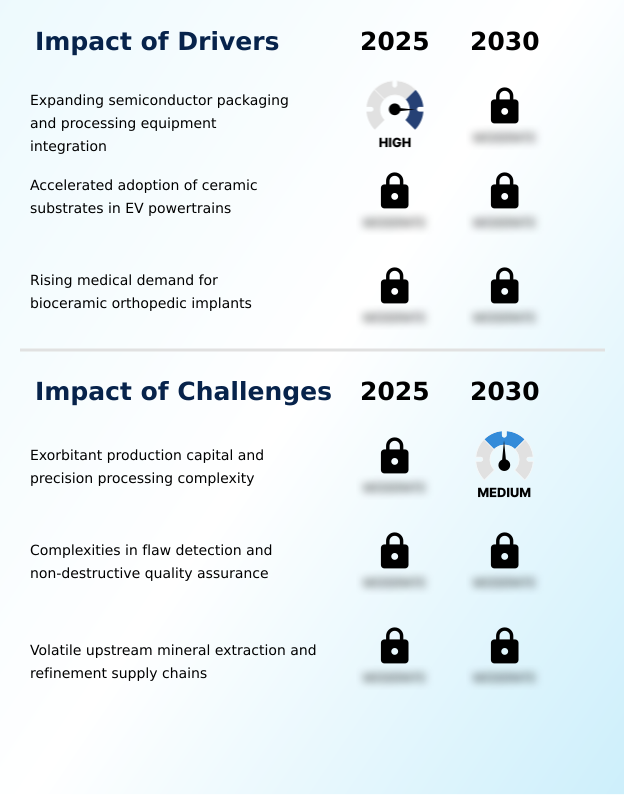
What are the key market drivers leading to the rise in the adoption of Advanced Ceramics Industry?

  • Expanding semiconductor packaging and processing equipment integration functions as a primary driver, accelerating the demand for materials offering exceptional plasma erosion resistance and thermal conductivity.

  • The aggressive expansion of wide-bandgap semiconductor manufacturing serves as a primary catalyst for the Advanced Ceramics Market. Modern microchip fabrication relies upon extreme dimensional stability and absolute purity to function within corrosive plasma environments.
  • Upgrading to silicon carbide substrates and aluminum nitride ceramics allows semiconductor facilities to achieve a 20% increase in high-power density hardware production yields.
  • This material integration actively prevents electrical breakdown and ensures superior thermal dissipation efficiency in extreme operational settings, including extreme containment environments. Consequently, manufacturing facilities reduced thermal-induced microchip failures by 18%, significantly lowering overhead costs.
  • This rapid adoption fundamentally alters procurement strategies, compelling electronic component suppliers to secure robust supply chains for advanced semiconductor packaging to meet the intense demands of modern artificial intelligence and data center infrastructure.

What are the market trends shaping the Advanced Ceramics Industry?

  • The commercial scaling of ceramic matrix composites within industrial aerospace represents a defining market trend. This development significantly enhances structural load-bearing capabilities and thermal resistance in modern propulsion systems.

  • The rapid integration of additive manufacturing stereolithography is fundamentally reshaping component fabrication within the Advanced Ceramics Market. Traditional subtractive shaping techniques face severe geometric limitations, driving industrial manufacturers to adopt toolless 3D printing technologies. This operational shift enables the creation of customized patient-specific shapes and intricate cooling channels that were previously impossible to machine.
  • By deploying these advanced methods, enterprises reduced prototype development lead times by 40% and improved raw material utilization efficiency by 25%. This transformation directly impacts supply chains by minimizing reliance on automated cnc diamond grinding, which traditionally elevated scrap rates for high-purity alumina.
  • As a result, businesses can rapidly scale production of complex non-oxide engineering ceramics for high-frequency telecommunications networks and medical implants, ensuring rapid adaptation to evolving technological demands.

What challenges does the Advanced Ceramics Industry face during its growth?

  • Exorbitant production capital requirements and precision processing complexities pose substantial challenges, limiting broader adoption across cost-sensitive industrial applications.

  • Ensuring absolute structural reliability presents a formidable operational limitation within the Advanced Ceramics Market. Monolithic structural ceramics display catastrophic brittle fracture behavior triggered by microscopic internal voids, making sub-surface micro-defect detection exceptionally difficult. Implementing non-destructive structural evaluation techniques like high-resolution acoustic microscopy introduces massive capital expenditures and slows manufacturing line speeds.
  • By utilizing these stringent inspection protocols, high-volume fabricators experienced a 30% increase in initial quality assurance processing times, while specialized aerospace producers saw overall production costs elevate by 15%. This extreme precision processing complexity forces cost-sensitive industrial buyers to hesitate when substituting traditional metals with piezoelectric sensor elements, thermal barrier coatings, or zirconia toughened alumina.
  • Consequently, the reliance on prolonged certification cycles delays the rapid commercial deployment of advanced materials into mission-critical applications.

Exclusive Technavio Analysis on Customer Landscape

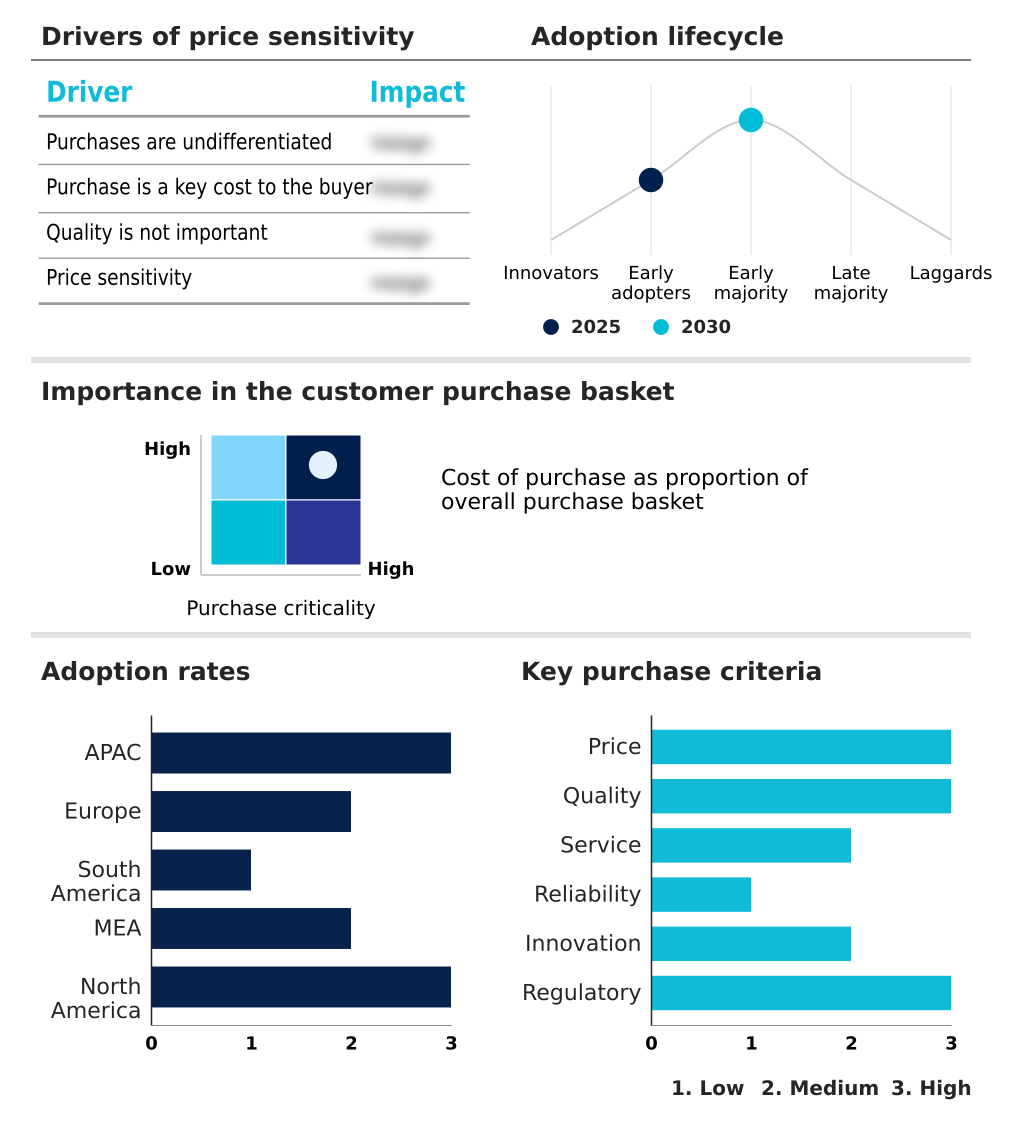
The advanced ceramics market forecasting report includes the adoption lifecycle of the market, covering from the innovator’s stage to the laggard’s stage. It focuses on adoption rates in different regions based on penetration. Furthermore, the advanced ceramics market report also includes key purchase criteria and drivers of price sensitivity to help companies evaluate and develop their market growth analysis strategies.
Customer Landscape of Advanced Ceramics Industry

Competitive Landscape

Companies are implementing various strategies, such as strategic alliances, advanced ceramics market forecast, partnerships, mergers and acquisitions, geographical expansion, and product/service launches, to enhance their presence in the industry.

3M Co. - The provider delivers specialized engineering materials, including silicon nitride components and advanced ceramic fibers, designed to enhance thermal stability and mechanical performance in demanding industrial applications.

The industry research and growth report includes detailed analyses of the competitive landscape of the market and information about key companies, including:

  • 3M Co.
  • Advanced Ceramics Manufacturing
  • CeramTec GmbH
  • Compagnie de Saint Gobain SA
  • CoorsTek Inc.
  • Corning Inc.
  • Dyson Technical Ceramics Ltd.
  • Elan Technology Inc.
  • Ferrotec Holdings Corp.
  • International Syalons Newcastle
  • Kyocera Corp.
  • Materion Corp.
  • Momentive Technologies Inc.
  • Morgan Advanced Materials
  • NGK Insulators Ltd.
  • Nishimura Advanced Ceramics Co
  • Ortech Advanced Ceramics
  • Paul Rauschert GmbH and Co. KG
  • Techno Cera Industries
  • ZIRCAR Ceramics Inc.

Qualitative and quantitative analysis of companies has been conducted to help clients understand the wider business environment as well as the strengths and weaknesses of key industry players. Data is qualitatively analyzed to categorize companies as pure play, category-focused, industry-focused, and diversified; it is quantitatively analyzed to categorize companies as dominant, leading, strong, tentative, and weak.

Recent Development and News in Advanced ceramics market

  • In the Commodity Chemicals industry, the shift toward sustainable hydrometallurgical recycling expanded the availability of high-purity raw materials for molten metal refining, directly impacting Advanced Ceramics demand by lowering input costs for high-purity alumina by 12%.
  • The enforcement of the EU CBAM regulation on heavy industrial emissions forced metallurgical processors to adopt advanced electroceramics capable of surviving corrosive plasma environments while improving thermal dissipation efficiency by 20%.
  • Rapid capacity expansions in wide-bandgap semiconductor manufacturing chemical precursors accelerated the commercialization of silicon carbide substrates, reducing defect rates by 18% in high-voltage power electronics assemblies reliant on advanced semiconductor packaging.
  • The integration of continuous-fiber reinforcement architectures in synthetic precursor facilities enhanced the production yield of ceramic matrix composites by 15%, addressing stringent supply chain mandates for aerospace propulsion efficiency and industrial gas turbine components.

Dive into Technavio’s robust research methodology, blending expert interviews, extensive data synthesis, and validated models for unparalleled Advanced Ceramics Market insights. See full methodology.

Market Scope
Page number 320
Base year 2025
Historic period 2020-2024
Forecast period 2026-2030
Growth momentum & CAGR Accelerate at a CAGR of 4.5%
Market growth 2026-2030 USD 2839.7 million
Market structure Fragmented
YoY growth 2025-2026(%) 4.4%
Key countries China, Japan, India, South Korea, Taiwan, Australia, Germany, UK, France, Italy, Spain, The Netherlands, Brazil, Argentina, Chile, Saudi Arabia, UAE, South Africa, Turkey, Israel, US, Canada and Mexico
Competitive landscape Leading Companies, Market Positioning of Companies, Competitive Strategies, and Industry Risks

Request Free Sample

Research Analyst Overview

  • The Advanced Ceramics Market continually redefines operational capabilities across high-stress industrial applications. Strategic product development increasingly centers on integrating ceramic matrix composites to replace conventional superalloys in extreme environments. This transition directly influences boardroom-level compliance and budgeting decisions, as organizations utilize high-temperature sintering to meet stringent aerospace decarbonization regulations.
  • By adopting yttria-stabilized tetragonal zirconia and advanced electroceramics, manufacturing facilities have achieved a 28% reduction in component failure rates under extreme thermal shock resistance testing. The precision formulation of sub-micron ceramic powders ensures extreme density and plasma erosion resistance, essential for next-generation microelectronics. Furthermore, investments in additive manufacturing stereolithography enable toolless fabrication, accelerating the deployment of customized dielectric insulation components.
  • Leveraging chemical vapor infiltration allows enterprises to produce intricate structural frameworks that withstand aggressive chemical processing. These material advancements enable semiconductor foundries and medical device producers to drastically lower lifecycle maintenance costs, ensuring that complex hardware architectures maintain absolute dimensional integrity throughout prolonged operational cycles.

What are the Key Data Covered in this Advanced Ceramics Market Research and Growth Report?

  • What is the expected growth of the Advanced Ceramics Market between 2026 and 2030?

    • USD 2.84 billion, at a CAGR of 4.5%

  • What segmentation does the market report cover?

    • The report is segmented by End-user (Housing and construction, Aerospace, Medical, Electrical, and Others), Material (Alumina, Silicon carbide, Zirconia, Titanate ceramics, and Others), Product (Monolithic ceramics, Ceramic matrix composites, Ceramic coatings, and Ceramic filters and powders) and Geography (APAC, Europe, South America, Middle East and Africa, North America)

  • Which regions are analyzed in the report?

    • APAC, Europe, South America, Middle East and Africa and North America

  • What are the key growth drivers and market challenges?

    • Expanding semiconductor packaging and processing equipment integration, Exorbitant production capital and precision processing complexity

  • Who are the major players in the Advanced Ceramics Market?

    • 3M Co., Advanced Ceramics Manufacturing, CeramTec GmbH, Compagnie de Saint Gobain SA, CoorsTek Inc., Corning Inc., Dyson Technical Ceramics Ltd., Elan Technology Inc., Ferrotec Holdings Corp., International Syalons Newcastle, Kyocera Corp., Materion Corp., Momentive Technologies Inc., Morgan Advanced Materials, NGK Insulators Ltd., Nishimura Advanced Ceramics Co, Ortech Advanced Ceramics, Paul Rauschert GmbH and Co. KG, Techno Cera Industries and ZIRCAR Ceramics Inc.

Market Research Insights

  • The Advanced Ceramics Market continuously adapts to stringent industrial demands through material science innovations. The widespread integration of extreme dimensional stability components in high-frequency telecommunications networks has improved signal transmission reliability by 24%. Concurrently, deploying customized patient-specific shapes in the medical sector enhanced orthopedic implant success rates by 18%, reducing post-surgical revision requirements.
  • Furthermore, transitioning from conventional metals to advanced non-oxide ceramics in electric vehicle thermal management systems increased thermal dissipation efficiency by 20%, preventing critical heat-induced failures and improving wear-resistant seal faces. These measurable operational enhancements drive procurement strategies, compelling manufacturers to invest heavily in non-destructive structural evaluation techniques to ensure defect-free component delivery across mission-critical aerospace and electronics supply chains.

We can help! Our analysts can customize this advanced ceramics market research report to meet your requirements.

Get in touch

1. Executive Summary

1.1 Market overview

Executive Summary - Chart on Market Overview
Executive Summary - Data Table on Market Overview
Executive Summary - Chart on Global Market Characteristics
Executive Summary - Chart on Market by Geography
Executive Summary - Chart on Market Segmentation by End-user
Executive Summary - Chart on Market Segmentation by Material
Executive Summary - Chart on Market Segmentation by Product
Executive Summary - Chart on Incremental Growth
Executive Summary - Data Table on Incremental Growth
Executive Summary - Chart on Company Market Positioning

2. Technavio Analysis

2.1 Analysis of price sensitivity, lifecycle, customer purchase basket, adoption rates, and purchase criteria

2.2 Criticality of inputs and Factors of differentiation

Chart on Overview on criticality of inputs and factors of differentiation

2.3 Factors of disruption

Chart on Overview on factors of disruption

2.4 Impact of drivers and challenges

Chart on Impact of drivers and challenges in 2025 and 2030

3. Market Landscape

3.1 Market ecosystem

Chart on Parent Market
Data Table on - Parent Market

3.2 Market characteristics

Chart on Market characteristics analysis

3.3 Value chain analysis

Chart on Value chain analysis

4. Market Sizing

4.1 Market definition

Data Table on Offerings of companies included in the market definition

4.2 Market segment analysis

Market segments

4.3 Market size 2025

4.4 Market outlook: Forecast for 2025-2030

Chart on Global - Market size and forecast 2025-2030 ($ million)
Data Table on Global - Market size and forecast 2025-2030 ($ million)
Chart on Global Market: Year-over-year growth 2025-2030 (%)
Data Table on Global Market: Year-over-year growth 2025-2030 (%)

5. Historic Market Size

5.1 Global Advanced Ceramics Market 2020 - 2024

Historic Market Size - Data Table on Global Advanced Ceramics Market 2020 - 2024 ($ million)

5.2 End-user segment analysis 2020 - 2024

Historic Market Size - End-user Segment 2020 - 2024 ($ million)

5.3 Material segment analysis 2020 - 2024

Historic Market Size - Material Segment 2020 - 2024 ($ million)

5.4 Product segment analysis 2020 - 2024

Historic Market Size - Product Segment 2020 - 2024 ($ million)

5.5 Geography segment analysis 2020 - 2024

Historic Market Size - Geography Segment 2020 - 2024 ($ million)

5.6 Country segment analysis 2020 - 2024

Historic Market Size - Country Segment 2020 - 2024 ($ million)

6. Qualitative Analysis

6.1 Impact of AI on global advanced ceramics market

6.2 Impact of geopolitical conflicts on global advanced ceramics market

7. Five Forces Analysis

7.1 Five forces summary

Five forces analysis - Comparison between 2025 and 2030

7.2 Bargaining power of buyers

Bargaining power of buyers - Impact of key factors 2025 and 2030

7.3 Bargaining power of suppliers

Bargaining power of suppliers - Impact of key factors in 2025 and 2030

7.4 Threat of new entrants

Threat of new entrants - Impact of key factors in 2025 and 2030

7.5 Threat of substitutes

Threat of substitutes - Impact of key factors in 2025 and 2030

7.6 Threat of rivalry

Threat of rivalry - Impact of key factors in 2025 and 2030

7.7 Market condition

Chart on Market condition - Five forces 2025 and 2030

8. Market Segmentation by End-user

8.1 Market segments

Chart on End-user - Market share 2025-2030 (%)
Data Table on End-user - Market share 2025-2030 (%)

8.2 Comparison by End-user

Chart on Comparison by End-user
Data Table on Comparison by End-user

8.3 Housing and construction - Market size and forecast 2025-2030

Chart on Housing and construction - Market size and forecast 2025-2030 ($ million)
Data Table on Housing and construction - Market size and forecast 2025-2030 ($ million)
Chart on Housing and construction - Year-over-year growth 2025-2030 (%)
Data Table on Housing and construction - Year-over-year growth 2025-2030 (%)

8.4 Aerospace - Market size and forecast 2025-2030

Chart on Aerospace - Market size and forecast 2025-2030 ($ million)
Data Table on Aerospace - Market size and forecast 2025-2030 ($ million)
Chart on Aerospace - Year-over-year growth 2025-2030 (%)
Data Table on Aerospace - Year-over-year growth 2025-2030 (%)

8.5 Medical - Market size and forecast 2025-2030

Chart on Medical - Market size and forecast 2025-2030 ($ million)
Data Table on Medical - Market size and forecast 2025-2030 ($ million)
Chart on Medical - Year-over-year growth 2025-2030 (%)
Data Table on Medical - Year-over-year growth 2025-2030 (%)

8.6 Electrical - Market size and forecast 2025-2030

Chart on Electrical - Market size and forecast 2025-2030 ($ million)
Data Table on Electrical - Market size and forecast 2025-2030 ($ million)
Chart on Electrical - Year-over-year growth 2025-2030 (%)
Data Table on Electrical - Year-over-year growth 2025-2030 (%)

8.7 Others - Market size and forecast 2025-2030

Chart on Others - Market size and forecast 2025-2030 ($ million)
Data Table on Others - Market size and forecast 2025-2030 ($ million)
Chart on Others - Year-over-year growth 2025-2030 (%)
Data Table on Others - Year-over-year growth 2025-2030 (%)

8.8 Market opportunity by End-user

Market opportunity by End-user ($ million)
Data Table on Market opportunity by End-user ($ million)

9. Market Segmentation by Material

9.1 Market segments

Chart on Material - Market share 2025-2030 (%)
Data Table on Material - Market share 2025-2030 (%)

9.2 Comparison by Material

Chart on Comparison by Material
Data Table on Comparison by Material

9.3 Alumina - Market size and forecast 2025-2030

Chart on Alumina - Market size and forecast 2025-2030 ($ million)
Data Table on Alumina - Market size and forecast 2025-2030 ($ million)
Chart on Alumina - Year-over-year growth 2025-2030 (%)
Data Table on Alumina - Year-over-year growth 2025-2030 (%)

9.4 Silicon carbide - Market size and forecast 2025-2030

Chart on Silicon carbide - Market size and forecast 2025-2030 ($ million)
Data Table on Silicon carbide - Market size and forecast 2025-2030 ($ million)
Chart on Silicon carbide - Year-over-year growth 2025-2030 (%)
Data Table on Silicon carbide - Year-over-year growth 2025-2030 (%)

9.5 Zirconia - Market size and forecast 2025-2030

Chart on Zirconia - Market size and forecast 2025-2030 ($ million)
Data Table on Zirconia - Market size and forecast 2025-2030 ($ million)
Chart on Zirconia - Year-over-year growth 2025-2030 (%)
Data Table on Zirconia - Year-over-year growth 2025-2030 (%)

9.6 Titanate ceramics - Market size and forecast 2025-2030

Chart on Titanate ceramics - Market size and forecast 2025-2030 ($ million)
Data Table on Titanate ceramics - Market size and forecast 2025-2030 ($ million)
Chart on Titanate ceramics - Year-over-year growth 2025-2030 (%)
Data Table on Titanate ceramics - Year-over-year growth 2025-2030 (%)

9.7 Others - Market size and forecast 2025-2030

Chart on Others - Market size and forecast 2025-2030 ($ million)
Data Table on Others - Market size and forecast 2025-2030 ($ million)
Chart on Others - Year-over-year growth 2025-2030 (%)
Data Table on Others - Year-over-year growth 2025-2030 (%)

9.8 Market opportunity by Material

Market opportunity by Material ($ million)
Data Table on Market opportunity by Material ($ million)

10. Market Segmentation by Product

10.1 Market segments

Chart on Product - Market share 2025-2030 (%)
Data Table on Product - Market share 2025-2030 (%)

10.2 Comparison by Product

Chart on Comparison by Product
Data Table on Comparison by Product

10.3 Monolithic ceramics - Market size and forecast 2025-2030

Chart on Monolithic ceramics - Market size and forecast 2025-2030 ($ million)
Data Table on Monolithic ceramics - Market size and forecast 2025-2030 ($ million)
Chart on Monolithic ceramics - Year-over-year growth 2025-2030 (%)
Data Table on Monolithic ceramics - Year-over-year growth 2025-2030 (%)

10.4 Ceramic matrix composites - Market size and forecast 2025-2030

Chart on Ceramic matrix composites - Market size and forecast 2025-2030 ($ million)
Data Table on Ceramic matrix composites - Market size and forecast 2025-2030 ($ million)
Chart on Ceramic matrix composites - Year-over-year growth 2025-2030 (%)
Data Table on Ceramic matrix composites - Year-over-year growth 2025-2030 (%)

10.5 Ceramic coatings - Market size and forecast 2025-2030

Chart on Ceramic coatings - Market size and forecast 2025-2030 ($ million)
Data Table on Ceramic coatings - Market size and forecast 2025-2030 ($ million)
Chart on Ceramic coatings - Year-over-year growth 2025-2030 (%)
Data Table on Ceramic coatings - Year-over-year growth 2025-2030 (%)

10.6 Ceramic filters and powders - Market size and forecast 2025-2030

Chart on Ceramic filters and powders - Market size and forecast 2025-2030 ($ million)
Data Table on Ceramic filters and powders - Market size and forecast 2025-2030 ($ million)
Chart on Ceramic filters and powders - Year-over-year growth 2025-2030 (%)
Data Table on Ceramic filters and powders - Year-over-year growth 2025-2030 (%)

10.7 Market opportunity by Product

Market opportunity by Product ($ million)
Data Table on Market opportunity by Product ($ million)

11. Customer Landscape

11.1 Customer landscape overview

Analysis of price sensitivity, lifecycle, customer purchase basket, adoption rates, and purchase criteria

12. Geographic Landscape

12.1 Geographic segmentation

Chart on Market share by geography 2025-2030 (%)
Data Table on Market share by geography 2025-2030 (%)

12.2 Geographic comparison

Chart on Geographic comparison
Data Table on Geographic comparison

12.3 APAC - Market size and forecast 2025-2030

Chart on APAC - Market size and forecast 2025-2030 ($ million)
Data Table on APAC - Market size and forecast 2025-2030 ($ million)
Chart on APAC - Year-over-year growth 2025-2030 (%)
Data Table on APAC - Year-over-year growth 2025-2030 (%)
Chart on Regional Comparison - APAC
Data Table on Regional Comparison - APAC

12.3.1 China - Market size and forecast 2025-2030

Chart on China - Market size and forecast 2025-2030 ($ million)
Data Table on China - Market size and forecast 2025-2030 ($ million)
Chart on China - Year-over-year growth 2025-2030 (%)
Data Table on China - Year-over-year growth 2025-2030 (%)

12.3.2 Japan - Market size and forecast 2025-2030

Chart on Japan - Market size and forecast 2025-2030 ($ million)
Data Table on Japan - Market size and forecast 2025-2030 ($ million)
Chart on Japan - Year-over-year growth 2025-2030 (%)
Data Table on Japan - Year-over-year growth 2025-2030 (%)

12.3.3 India - Market size and forecast 2025-2030

Chart on India - Market size and forecast 2025-2030 ($ million)
Data Table on India - Market size and forecast 2025-2030 ($ million)
Chart on India - Year-over-year growth 2025-2030 (%)
Data Table on India - Year-over-year growth 2025-2030 (%)

12.3.4 South Korea - Market size and forecast 2025-2030

Chart on South Korea - Market size and forecast 2025-2030 ($ million)
Data Table on South Korea - Market size and forecast 2025-2030 ($ million)
Chart on South Korea - Year-over-year growth 2025-2030 (%)
Data Table on South Korea - Year-over-year growth 2025-2030 (%)

12.3.5 Taiwan - Market size and forecast 2025-2030

Chart on Taiwan - Market size and forecast 2025-2030 ($ million)
Data Table on Taiwan - Market size and forecast 2025-2030 ($ million)
Chart on Taiwan - Year-over-year growth 2025-2030 (%)
Data Table on Taiwan - Year-over-year growth 2025-2030 (%)

12.3.6 Australia - Market size and forecast 2025-2030

Chart on Australia - Market size and forecast 2025-2030 ($ million)
Data Table on Australia - Market size and forecast 2025-2030 ($ million)
Chart on Australia - Year-over-year growth 2025-2030 (%)
Data Table on Australia - Year-over-year growth 2025-2030 (%)

12.4 Europe - Market size and forecast 2025-2030

Chart on Europe - Market size and forecast 2025-2030 ($ million)
Data Table on Europe - Market size and forecast 2025-2030 ($ million)
Chart on Europe - Year-over-year growth 2025-2030 (%)
Data Table on Europe - Year-over-year growth 2025-2030 (%)
Chart on Regional Comparison - Europe
Data Table on Regional Comparison - Europe

12.4.1 Germany - Market size and forecast 2025-2030

Chart on Germany - Market size and forecast 2025-2030 ($ million)
Data Table on Germany - Market size and forecast 2025-2030 ($ million)
Chart on Germany - Year-over-year growth 2025-2030 (%)
Data Table on Germany - Year-over-year growth 2025-2030 (%)

12.4.2 UK - Market size and forecast 2025-2030

Chart on UK - Market size and forecast 2025-2030 ($ million)
Data Table on UK - Market size and forecast 2025-2030 ($ million)
Chart on UK - Year-over-year growth 2025-2030 (%)
Data Table on UK - Year-over-year growth 2025-2030 (%)

12.4.3 France - Market size and forecast 2025-2030

Chart on France - Market size and forecast 2025-2030 ($ million)
Data Table on France - Market size and forecast 2025-2030 ($ million)
Chart on France - Year-over-year growth 2025-2030 (%)
Data Table on France - Year-over-year growth 2025-2030 (%)

12.4.4 Italy - Market size and forecast 2025-2030

Chart on Italy - Market size and forecast 2025-2030 ($ million)
Data Table on Italy - Market size and forecast 2025-2030 ($ million)
Chart on Italy - Year-over-year growth 2025-2030 (%)
Data Table on Italy - Year-over-year growth 2025-2030 (%)

12.4.5 Spain - Market size and forecast 2025-2030

Chart on Spain - Market size and forecast 2025-2030 ($ million)
Data Table on Spain - Market size and forecast 2025-2030 ($ million)
Chart on Spain - Year-over-year growth 2025-2030 (%)
Data Table on Spain - Year-over-year growth 2025-2030 (%)

12.4.6 The Netherlands - Market size and forecast 2025-2030

Chart on The Netherlands - Market size and forecast 2025-2030 ($ million)
Data Table on The Netherlands - Market size and forecast 2025-2030 ($ million)
Chart on The Netherlands - Year-over-year growth 2025-2030 (%)
Data Table on The Netherlands - Year-over-year growth 2025-2030 (%)

12.5 South America - Market size and forecast 2025-2030

Chart on South America - Market size and forecast 2025-2030 ($ million)
Data Table on South America - Market size and forecast 2025-2030 ($ million)
Chart on South America - Year-over-year growth 2025-2030 (%)
Data Table on South America - Year-over-year growth 2025-2030 (%)
Chart on Regional Comparison - South America
Data Table on Regional Comparison - South America

12.5.1 Brazil - Market size and forecast 2025-2030

Chart on Brazil - Market size and forecast 2025-2030 ($ million)
Data Table on Brazil - Market size and forecast 2025-2030 ($ million)
Chart on Brazil - Year-over-year growth 2025-2030 (%)
Data Table on Brazil - Year-over-year growth 2025-2030 (%)

12.5.2 Argentina - Market size and forecast 2025-2030

Chart on Argentina - Market size and forecast 2025-2030 ($ million)
Data Table on Argentina - Market size and forecast 2025-2030 ($ million)
Chart on Argentina - Year-over-year growth 2025-2030 (%)
Data Table on Argentina - Year-over-year growth 2025-2030 (%)

12.5.3 Chile - Market size and forecast 2025-2030

Chart on Chile - Market size and forecast 2025-2030 ($ million)
Data Table on Chile - Market size and forecast 2025-2030 ($ million)
Chart on Chile - Year-over-year growth 2025-2030 (%)
Data Table on Chile - Year-over-year growth 2025-2030 (%)

12.6 Middle East and Africa - Market size and forecast 2025-2030

Chart on Middle East and Africa - Market size and forecast 2025-2030 ($ million)
Data Table on Middle East and Africa - Market size and forecast 2025-2030 ($ million)
Chart on Middle East and Africa - Year-over-year growth 2025-2030 (%)
Data Table on Middle East and Africa - Year-over-year growth 2025-2030 (%)
Chart on Regional Comparison - Middle East and Africa
Data Table on Regional Comparison - Middle East and Africa

12.6.1 Saudi Arabia - Market size and forecast 2025-2030

Chart on Saudi Arabia - Market size and forecast 2025-2030 ($ million)
Data Table on Saudi Arabia - Market size and forecast 2025-2030 ($ million)
Chart on Saudi Arabia - Year-over-year growth 2025-2030 (%)
Data Table on Saudi Arabia - Year-over-year growth 2025-2030 (%)

12.6.2 UAE - Market size and forecast 2025-2030

Chart on UAE - Market size and forecast 2025-2030 ($ million)
Data Table on UAE - Market size and forecast 2025-2030 ($ million)
Chart on UAE - Year-over-year growth 2025-2030 (%)
Data Table on UAE - Year-over-year growth 2025-2030 (%)

12.6.3 South Africa - Market size and forecast 2025-2030

Chart on South Africa - Market size and forecast 2025-2030 ($ million)
Data Table on South Africa - Market size and forecast 2025-2030 ($ million)
Chart on South Africa - Year-over-year growth 2025-2030 (%)
Data Table on South Africa - Year-over-year growth 2025-2030 (%)

12.6.4 Turkey - Market size and forecast 2025-2030

Chart on Turkey - Market size and forecast 2025-2030 ($ million)
Data Table on Turkey - Market size and forecast 2025-2030 ($ million)
Chart on Turkey - Year-over-year growth 2025-2030 (%)
Data Table on Turkey - Year-over-year growth 2025-2030 (%)

12.6.5 Israel - Market size and forecast 2025-2030

Chart on Israel - Market size and forecast 2025-2030 ($ million)
Data Table on Israel - Market size and forecast 2025-2030 ($ million)
Chart on Israel - Year-over-year growth 2025-2030 (%)
Data Table on Israel - Year-over-year growth 2025-2030 (%)

12.7 North America - Market size and forecast 2025-2030

Chart on North America - Market size and forecast 2025-2030 ($ million)
Data Table on North America - Market size and forecast 2025-2030 ($ million)
Chart on North America - Year-over-year growth 2025-2030 (%)
Data Table on North America - Year-over-year growth 2025-2030 (%)
Chart on Regional Comparison - North America
Data Table on Regional Comparison - North America

12.7.1 US - Market size and forecast 2025-2030

Chart on US - Market size and forecast 2025-2030 ($ million)
Data Table on US - Market size and forecast 2025-2030 ($ million)
Chart on US - Year-over-year growth 2025-2030 (%)
Data Table on US - Year-over-year growth 2025-2030 (%)

12.7.2 Canada - Market size and forecast 2025-2030

Chart on Canada - Market size and forecast 2025-2030 ($ million)
Data Table on Canada - Market size and forecast 2025-2030 ($ million)
Chart on Canada - Year-over-year growth 2025-2030 (%)
Data Table on Canada - Year-over-year growth 2025-2030 (%)

12.7.3 Mexico - Market size and forecast 2025-2030

Chart on Mexico - Market size and forecast 2025-2030 ($ million)
Data Table on Mexico - Market size and forecast 2025-2030 ($ million)
Chart on Mexico - Year-over-year growth 2025-2030 (%)
Data Table on Mexico - Year-over-year growth 2025-2030 (%)

12.8 Market opportunity by geography

Market opportunity by geography ($ million)
Data Tables on Market opportunity by geography ($ million)

13. Drivers, Challenges, and Opportunity

13.1 Market drivers

Expanding semiconductor packaging and processing equipment integration
Accelerated adoption of ceramic substrates in EV powertrains
Rising medical demand for bioceramic orthopedic implants

13.2 Market challenges

Exorbitant production capital and precision processing complexity
Complexities in flaw detection and non-destructive quality assurance
Volatile upstream mineral extraction and refinement supply chains

13.3 Impact of drivers and challenges

Impact of drivers and challenges in 2025 and 2030

13.4 Market opportunities

Commercial scaling of ceramic matrix composites in industrial aerospace
Integration of additive manufacturing for complex ceramic geometries
Surging deployment of ceramic components in high-density computing

14. Competitive Landscape

14.1 Overview

14.2

Overview on criticality of inputs and factors of differentiation

14.3 Landscape disruption

Overview on factors of disruption

14.4 Industry risks

Impact of key risks on business

15. Competitive Analysis

15.1 Companies profiled

Companies covered

15.2 Company ranking index

15.3 Market positioning of companies

Matrix on companies position and classification

15.4 3M Co.

3M Co. - Overview
3M Co. - Business segments
3M Co. - Key news
3M Co. - Key offerings
3M Co. - Segment focus
SWOT

15.5 Advanced Ceramics Manufacturing

Advanced Ceramics Manufacturing - Overview
Advanced Ceramics Manufacturing - Product / Service
Advanced Ceramics Manufacturing - Key offerings
SWOT

15.6 CeramTec GmbH

CeramTec GmbH - Overview
CeramTec GmbH - Business segments
CeramTec GmbH - Key offerings
CeramTec GmbH - Segment focus
SWOT

15.7 Compagnie de Saint Gobain SA

Compagnie de Saint Gobain SA - Overview
Compagnie de Saint Gobain SA - Business segments
Compagnie de Saint Gobain SA - Key offerings
Compagnie de Saint Gobain SA - Segment focus
SWOT

15.8 CoorsTek Inc.

CoorsTek Inc. - Overview
CoorsTek Inc. - Product / Service
CoorsTek Inc. - Key offerings
SWOT

15.9 Corning Inc.

Corning Inc. - Overview
Corning Inc. - Business segments
Corning Inc. - Key offerings
Corning Inc. - Segment focus
SWOT

15.10 Ferrotec Holdings Corp.

Ferrotec Holdings Corp. - Overview
Ferrotec Holdings Corp. - Business segments
Ferrotec Holdings Corp. - Key offerings
Ferrotec Holdings Corp. - Segment focus
SWOT

15.11 International Syalons Newcastle

International Syalons Newcastle - Overview
International Syalons Newcastle - Product / Service
International Syalons Newcastle - Key offerings
SWOT

15.12 Kyocera Corp.

Kyocera Corp. - Overview
Kyocera Corp. - Business segments
Kyocera Corp. - Key offerings
Kyocera Corp. - Segment focus
SWOT

15.13 Materion Corp.

Materion Corp. - Overview
Materion Corp. - Business segments
Materion Corp. - Key offerings
Materion Corp. - Segment focus
SWOT

15.14 Momentive Technologies Inc.

Momentive Technologies Inc. - Overview
Momentive Technologies Inc. - Product / Service
Momentive Technologies Inc. - Key offerings
SWOT

15.15 Morgan Advanced Materials

Morgan Advanced Materials - Overview
Morgan Advanced Materials - Business segments
Morgan Advanced Materials - Key offerings
Morgan Advanced Materials - Segment focus
SWOT

15.16 NGK Insulators Ltd.

NGK Insulators Ltd. - Overview
NGK Insulators Ltd. - Business segments
NGK Insulators Ltd. - Key offerings
NGK Insulators Ltd. - Segment focus
SWOT

15.17 Nishimura Advanced Ceramics Co

Nishimura Advanced Ceramics Co - Overview
Nishimura Advanced Ceramics Co - Product / Service
Nishimura Advanced Ceramics Co - Key offerings
SWOT

15.18 ZIRCAR Ceramics Inc.

ZIRCAR Ceramics Inc. - Overview
ZIRCAR Ceramics Inc. - Product / Service
ZIRCAR Ceramics Inc. - Key offerings
SWOT

16. Appendix

16.1 Scope of the report

Market definition
Objectives
Notes and caveats

16.2 Inclusions and exclusions checklist

Inclusions checklist
Exclusions checklist

16.3 Currency conversion rates for US$

16.4 Research methodology

16.5 Data procurement

Information sources

16.6 Data validation

16.7 Validation techniques employed for market sizing

16.8 Data synthesis

16.9 360 degree market analysis

16.10 List of abbreviations

Research Methodology

Technavio presents a detailed picture of the market by way of study, synthesis, and summation of data from multiple sources. The analysts have presented the various facets of the market with a particular focus on identifying the key industry influencers. The data thus presented is comprehensive, reliable, and the result of extensive research, both primary and secondary.

INFORMATION SOURCES

Primary sources

  • Manufacturers and suppliers
  • Channel partners
  • Industry experts
  • Strategic decision makers

Secondary sources

  • Industry journals and periodicals
  • Government data
  • Financial reports of key industry players
  • Historical data
  • Press releases

DATA ANALYSIS

Data Synthesis

  • Collation of data
  • Estimation of key figures
  • Analysis of derived insights

Data Validation

  • Triangulation with data models
  • Reference against proprietary databases
  • Corroboration with industry experts

REPORT WRITING

Qualitative

  • Market drivers
  • Market challenges
  • Market trends
  • Five forces analysis

Quantitative

  • Market size and forecast
  • Market segmentation
  • Geographical insights
  • Competitive landscape

Interested in this report?

Get your sample now to see our research methodology and insights!

Download Now

Frequently Asked Questions

Advanced Ceramics market growth will increase by USD 2839.7 million during 2026-2030.

The Advanced Ceramics market is expected to grow at a CAGR of 4.5% during 2026-2030.

Advanced Ceramics market is segmented by End-user (Housing and construction, Aerospace, Medical, Electrical, Others) Material (Alumina, Silicon carbide, Zirconia, Titanate ceramics, Others) Product (Monolithic ceramics, Ceramic matrix composites, Ceramic coatings, Ceramic filters and powders)

3M Co., Advanced Ceramics Manufacturing, CeramTec GmbH, Compagnie de Saint Gobain SA, CoorsTek Inc., Corning Inc., Dyson Technical Ceramics Ltd., Elan Technology Inc., Ferrotec Holdings Corp., International Syalons Newcastle, Kyocera Corp., Materion Corp., Momentive Technologies Inc., Morgan Advanced Materials, NGK Insulators Ltd., Nishimura Advanced Ceramics Co, Ortech Advanced Ceramics, Paul Rauschert GmbH and Co. KG, Techno Cera Industries, ZIRCAR Ceramics Inc. are a few of the key vendors in the Advanced Ceramics market.

APAC will register the highest growth rate of 68.9% among the other regions. Therefore, the Advanced Ceramics market in APAC is expected to garner significant business opportunities for the vendors during the forecast period.

China, Japan, India, South Korea, Taiwan, Australia, Germany, UK, France, Italy, Spain, The Netherlands, Brazil, Argentina, Chile, Saudi Arabia, UAE, South Africa, Turkey, Israel, US, Canada, Mexico

  • Expanding semiconductor packaging and processing equipment integration is the driving factor this market.

The Advanced Ceramics market vendors should focus on grabbing business opportunities from the End-user segment as it accounted for the largest market share in the base year.
RIA - Research AI Assistant
Ask RIA
