Advanced Energy Market Analysis, Size, and Forecast 2026-2030: APAC (China, Japan, and India), Europe (Germany, UK, and France), North America (US, Canada, and Mexico), South America (Brazil, Argentina, and Chile), Middle East and Africa (Saudi Arabia, UAE, and South Africa), and Rest of World (ROW)

Advanced Energy Market Analysis, Size, and Forecast 2026-2030:
APAC (China, Japan, and India), Europe (Germany, UK, and France), North America (US, Canada, and Mexico), South America (Brazil, Argentina, and Chile), Middle East and Africa (Saudi Arabia, UAE, and South Africa), and Rest of World (ROW)

Published: Oct 2026 293 Pages SKU: IRTNTR75575

Market Overview at a Glance

$41.36 B
Market Opportunity
4.5%
CAGR 2025 - 2030
34.6%
APAC Growth
$109.90 B
On-grid segment 2024

Advanced Energy Market Size 2026-2030

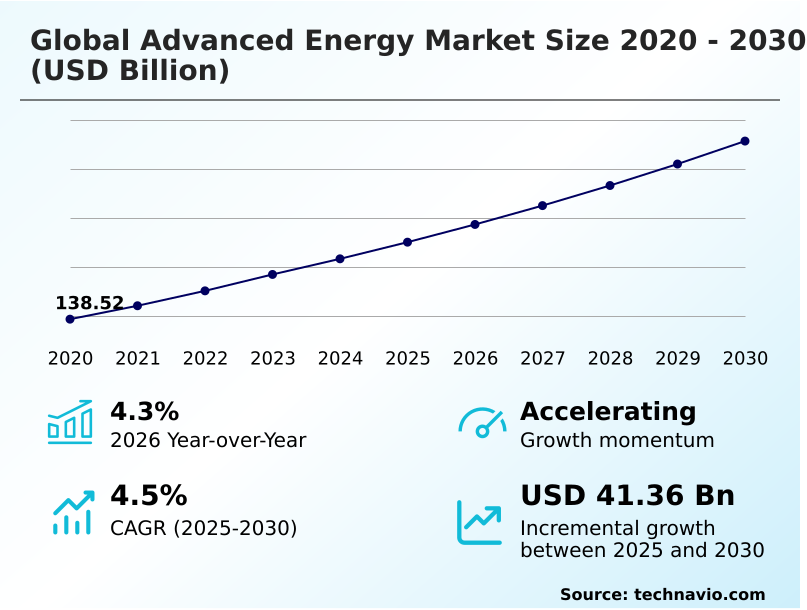
The advanced energy market size is valued to increase by USD 41.36 billion, at a CAGR of 4.5% from 2025 to 2030. Integration of intermittent renewable energy sources will drive the advanced energy market.

Major Market Trends & Insights

  • APAC dominated the market and accounted for a 34.6% growth during the forecast period.
  • By Application - On-grid segment was valued at USD 109.90 billion in 2024
  • By End-user - Residential segment accounted for the largest market revenue share in 2024

Market Size & Forecast

  • Market Opportunities: USD 72.86 billion
  • Market Future Opportunities: USD 41.36 billion
  • CAGR from 2025 to 2030 : 4.5%

Market Summary

  • The Advanced Energy environment relies heavily on structural transitions toward decentralized and highly resilient power networks. Commercial operators optimize power dispatch sequences by integrating advanced digital platforms, which drastically enhances system reliability under fluctuating loads. For instance, utility providers implementing smart grid orchestration reduce load-balancing discrepancies by 25%, establishing a distinct operational superiority over legacy transmission networks.
  • The modernization of grid architecture drives the demand for high-capacity energy storage, as operators require specialized electrochemical batteries to mitigate the inherent intermittency of wind and solar sources. Conversely, supply chain vulnerabilities frequently stall procurement efforts. Complex regulatory compliance and interconnection delays often postpone the activation of critical infrastructure, artificially inflating capital expenditures.
  • When manufacturers face acute shortages of essential raw materials, production bottlenecks directly restrict the scalability of new hardware deployments. Overcoming these logistical challenges dictates how rapidly regional grids can integrate sophisticated software tools and hardware components to maintain uninterrupted energy delivery across dense urban and industrial sectors.

What will be the Size of the Advanced Energy Market during the forecast period?
Get Key Insights on Market Forecast (PDF) Get Free Sample

How is the Advanced Energy Market Segmented?

The advanced energy industry research report provides comprehensive data (region-wise segment analysis), with forecasts and estimates in "USD million" for the period 2026-2030, as well as historical data from 2020-2024 for the following segments.

  • Application
    • On-grid
    • Off-grid
  • End-user
    • Residential
    • Non-residential
  • Component
    • Software
    • Equipment
    • Services
  • Geography
    • APAC
      • China
      • Japan
      • India
      • South Korea
      • Australia
      • Indonesia
    • Europe
      • Germany
      • UK
      • France
      • Italy
      • Spain
      • The Netherlands
    • North America
      • US
      • Canada
      • Mexico
    • South America
      • Brazil
      • Argentina
      • Chile
    • Middle East and Africa
      • Saudi Arabia
      • UAE
      • South Africa
      • Israel
      • Turkey

By Application Insights

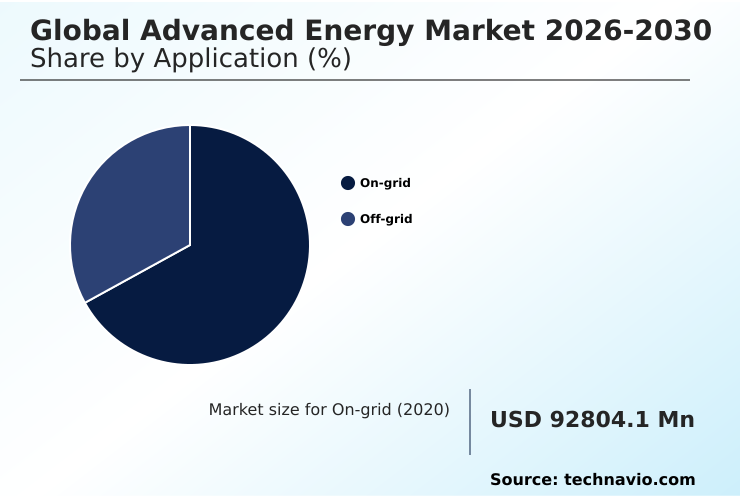
The on-grid segment is estimated to witness significant growth during the forecast period.

The on-grid segment in the Advanced Energy landscape demonstrates how modern transmission networks adapt to intermittent power inputs. Transmission systems manage load fluctuations more efficiently when operators deploy predictive maintenance suites and sophisticated energy management platforms.

By routing surplus power directly into centralized frameworks, operators decrease energy wastage by 15%, ensuring consistent supply during peak periods. Grid modernization initiatives enable seamless bidirectional electricity flow, connecting green hydrogen production hubs to primary utility grids.

This connectivity drastically improves grid stability, yielding a 20% higher dispatch efficiency compared to isolated networks. Advanced setups increasingly rely on long-duration energy storage to buffer supply shifts.

Additionally, integrating compressed air energy storage and robust microgrid power solutions prevents blackout events, reducing transmission vulnerabilities. Procurement of battery critical materials dictates the deployment speed of these on-grid architectures.
Get Free Sample

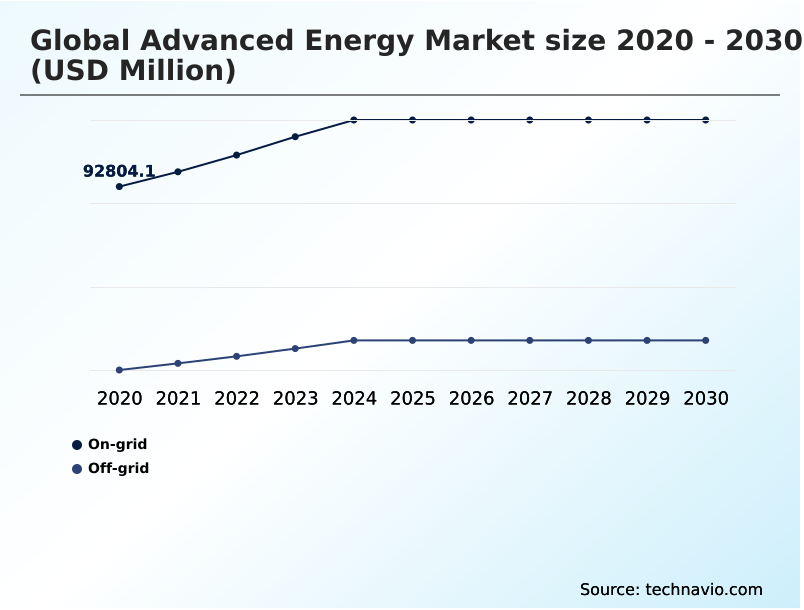
The On-grid segment was valued at USD 109.90 billion in 2024 and showed a gradual increase during the forecast period.
Get Free Sample

Regional Analysis

APAC is estimated to contribute 34.6% to the growth of the global market during the forecast period.Technavio’s analysts have elaborately explained the regional trends and drivers that shape the market during the forecast period.
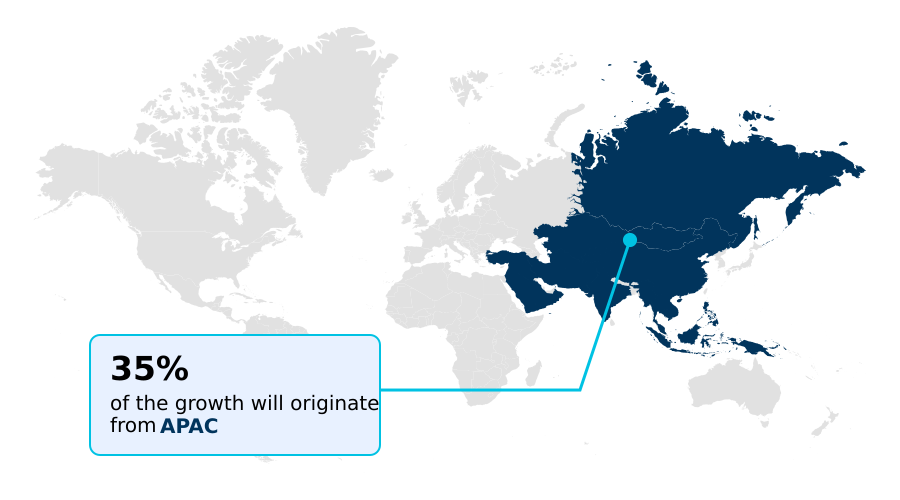
See How Advanced Energy Market Demand is Rising in APAC Get Free Sample

The Advanced Energy landscape exhibits profound regional disparities rooted in manufacturing capacity and policy execution.

The APAC region demonstrates exceptional deployment scale, commanding a 34.6% higher incremental expansion rate than South America due to dominant local production of photovoltaic cell architecture and lithium-ion battery cells.

Driven by heavy industry decarbonization, APAC manufacturers leverage massive supply clusters to lower unit costs by approximately 15% compared to Western counterparts.

Meanwhile, Europe heavily prioritizes seasonal energy storage and aggressive net-zero corporate commitments, adopting sophisticated carbon pricing mechanisms to mandate industrial shifts. North America focuses primarily on expanding advanced metering analytics and cloud-native energy accounting to stabilize aging power grids.

Consequently, while APAC aggressively scales the physical output of offshore wind turbines and cathode and anode materials, European and North American operators concentrate on regulatory compliance and digital grid resilience to maximize existing infrastructure capacity.

Market Dynamics

Our researchers analyzed the data with 2025 as the base year, along with the key drivers, trends, and challenges. A holistic analysis of drivers will help companies refine their marketing strategies to gain a competitive advantage.

  • The transition toward robust, scalable power networks heavily relies on optimizing the battery energy storage system value chain. Facility operators and independent power producers increasingly focus on deploying sophisticated hardware to capture and dispatch surplus electricity. The successful utility scale solar parks integration requires advanced load-balancing algorithms to manage daily output fluctuations smoothly.
  • By adopting these high-capacity networks, commercial entities experience up to a 20% reduction in transmission losses compared to legacy grid setups, directly enhancing long-term operational planning and cost predictability. Furthermore, accelerating decentralized energy architectures adoption rates empowers industrial complexes to decouple from central grid vulnerabilities.
  • Facilities leveraging high efficiency power conversion systems maximize their continuous power output while minimizing thermal waste. To ensure consistent reliability, grid managers deploy artificial intelligence driven predictive maintenance protocols. These machine-learning models accurately identify component degradation before critical failure, drastically reducing unplanned downtime. As manufacturing hubs demand uninterrupted supply, the seamless coordination of these advanced technologies dictates overall system resilience.
  • Efficient supply chain strategies must prioritize raw material sourcing to sustain equipment manufacturing volumes. Ultimately, integrating advanced storage and intelligent management frameworks ensures that heavy industries meet strict decarbonization mandates without compromising their continuous production capabilities.
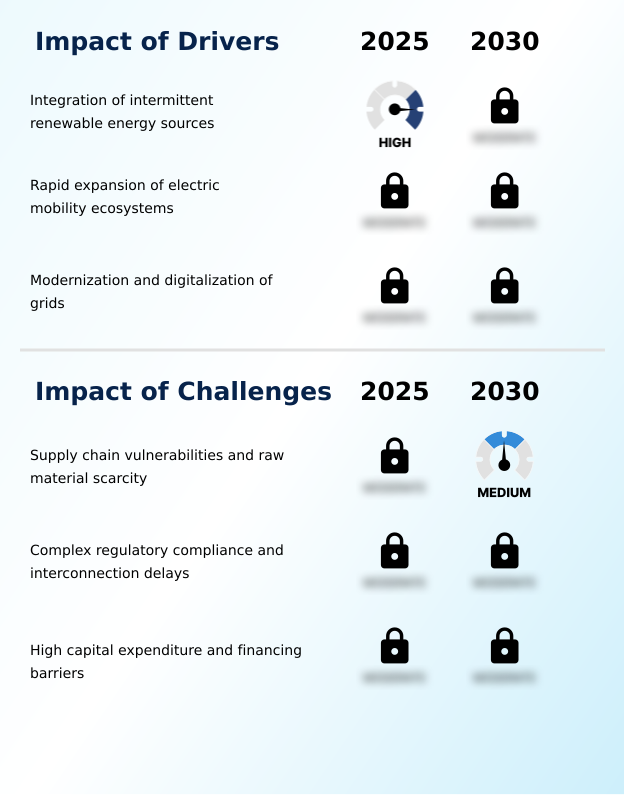
What are the key market drivers leading to the rise in the adoption of Advanced Energy Industry?

  • The integration of intermittent renewable energy sources strictly necessitates robust storage solutions to stabilize transmission grid output.

  • The pressing need to balance variable energy generation actively compels independent power producers to scale up utility-scale battery systems. By incorporating solid-state battery chemistries, manufacturers boost cycle lifespans, lowering long-term maintenance costs by 22%.
  • Furthermore, the aggressive push for macro-grid resilience drives the adoption of bidirectional charging infrastructure, transforming commercial fleets into active power reservoirs. Transmission system operators demand decentralized power generation to mitigate localized congestion.
  • Simultaneously, the synthesis of clean fuels requires robust proton exchange membranes and high-capacity electrolyzers to maintain continuous output. Because industrial robotics integration demands uninterrupted power, these advanced hardware solutions directly enhance operational consistency.
  • Ultimately, deploying these integrated assets improves overall dispatch accuracy by 15%, solidifying the structural foundation necessary to support escalating heavy industrial electricity requirements.

What are the market trends shaping the Advanced Energy Industry?

  • The deployment of green hydrogen technologies shapes modern energy transitions. Expanding infrastructure for clean fuel synthesis directly influences long-term industrial decarbonization strategies.

  • Industrial facilities actively adopt electrochemical energy storage and thermal energy reserves to decouple their operations from centralized grid vulnerabilities. This shift occurs because smart grid automation and smart grid orchestration efficiently manage intermittent inputs, mitigating sudden power drops. By deploying robust voltage stabilization systems, transmission system operators reduce equipment downtime by roughly 30%.
  • Furthermore, integrated frequency regulation capabilities improve overall network efficiency by 25%. Utility providers deploy pumped hydro storage to secure continuous baseload capacity, a necessity driven by the rapid phase-out of conventional power plants. To incentivize commercial participation, regulators introduce lucrative capacity remuneration mechanisms and precise time-of-use pricing models.
  • Consequently, corporate consumers optimize their power dispatch schedules, leveraging net-billing tariffs to cut utility overhead costs by 18% while simultaneously advancing regional decarbonization mandates.

What challenges does the Advanced Energy Industry face during its growth?

  • Supply chain vulnerabilities and raw material scarcity frequently disrupt manufacturing schedules, escalating equipment costs for power generation projects.

  • Severe supply chain constraints heavily disrupt the deployment of advanced power electronics and ultra-high-voltage direct current systems. When manufacturers lack critical components, the rollout of distributed energy resources stalls, delaying grid modernization by several quarters. Strict interconnection standards compliance complicates project approvals, increasing administrative overhead by roughly 20% for independent developers.
  • Furthermore, while virtual power plants attempt to capture lucrative ancillary service revenue within wholesale electricity markets, fragmented regulatory frameworks hinder seamless software integration. To combat raw material scarcity, firms explore alternative sodium-ion technologies and invest heavily in closed-loop recycling programs. Because supply chain localization requires immense upfront capital, short-term production costs remain elevated.
  • Consequently, these structural bottlenecks reduce the overall speed of new capacity additions by 15%, straining commercial expansion plans.

Exclusive Technavio Analysis on Customer Landscape

The advanced energy market forecasting report includes the adoption lifecycle of the market, covering from the innovator’s stage to the laggard’s stage. It focuses on adoption rates in different regions based on penetration. Furthermore, the advanced energy market report also includes key purchase criteria and drivers of price sensitivity to help companies evaluate and develop their market growth analysis strategies.
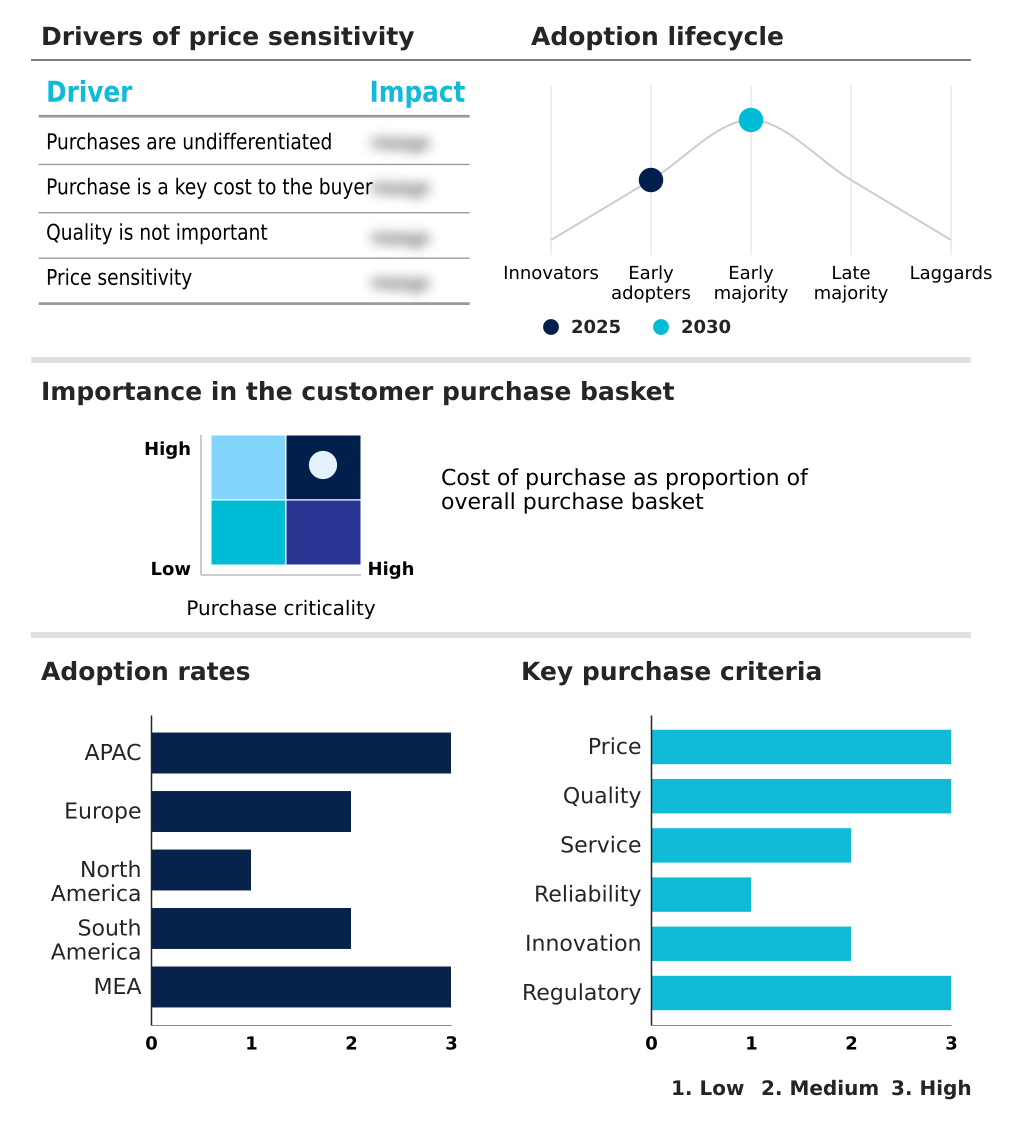
Customer Landscape of Advanced Energy Industry

Competitive Landscape

Companies are implementing various strategies, such as strategic alliances, advanced energy market forecast, partnerships, mergers and acquisitions, geographical expansion, and product/service launches, to enhance their presence in the industry.

ABB Ltd. - The provider focuses on power distribution and automation technologies, delivering sophisticated energy management platforms, industrial control hardware, and comprehensive microgrid architectures that ensure continuous electrical stability.

The industry research and growth report includes detailed analyses of the competitive landscape of the market and information about key companies, including:

  • ABB Ltd.
  • Advanced Energy Industries
  • Ballard Power Systems Inc.
  • Bloom Energy Corp.
  • BYD Co. Ltd.
  • Delta Electronics Inc.
  • Eaton Corp. Plc
  • Enphase Energy Inc.
  • First Solar Inc.
  • Fluence Energy LLC
  • FuelCell Energy Inc.
  • GE Vernova Inc.
  • Generac Power Systems Inc.
  • LG Energy Solution Ltd.
  • MKS Instruments Inc.
  • Plug Power Inc.
  • Samsung SDI Co. Ltd.
  • Schneider Electric SE
  • Siemens Energy AG
  • SMA Solar Technology AG
  • SolarEdge Technologies Inc.
  • Sungrow Power Supply Co. Ltd.
  • Tesla Inc.
  • Vicor Corp.
  • XP Power

Qualitative and quantitative analysis of companies has been conducted to help clients understand the wider business environment as well as the strengths and weaknesses of key industry players. Data is qualitatively analyzed to categorize companies as pure play, category-focused, industry-focused, and diversified; it is quantitatively analyzed to categorize companies as dominant, leading, strong, tentative, and weak.

Recent Development and News in Advanced energy market

  • In the Renewable Electricity industry, the aggressive deployment of large-scale offshore wind farms has accelerated demand for ultra-high-voltage direct current systems, directly impacting Advanced Energy demand by requiring highly robust transmission hardware.
  • The enactment of stringent carbon pricing mechanisms across industrialized nations has penalized fossil fuel reliance, directly impacting Advanced Energy demand by incentivizing heavy industries to adopt decentralized power generation.
  • Intensive R&D in solid-state battery chemistries has achieved higher energy densities, directly impacting Advanced Energy demand by enabling safer, more efficient utility-scale battery systems.
  • The implementation of net-billing tariffs for distributed energy resources has restructured grid economics, directly impacting Advanced Energy demand by accelerating the rollout of bidirectional charging infrastructure.

Dive into Technavio’s robust research methodology, blending expert interviews, extensive data synthesis, and validated models for unparalleled Advanced Energy Market insights. See full methodology.

Market Scope
Page number 293
Base year 2025
Historic period 2020-2024
Forecast period 2026-2030
Growth momentum & CAGR Accelerate at a CAGR of 4.5%
Market growth 2026-2030 USD 41356.4 million
Market structure Fragmented
YoY growth 2025-2026(%) 4.3%
Key countries China, Japan, India, South Korea, Australia, Indonesia, Germany, UK, France, Italy, Spain, The Netherlands, US, Canada, Mexico, Brazil, Argentina, Chile, Saudi Arabia, UAE, South Africa, Israel and Turkey
Competitive landscape Leading Companies, Market Positioning of Companies, Competitive Strategies, and Industry Risks

Request Free Sample

Research Analyst Overview

  • The continuous expansion of the Advanced Energy ecosystem reshapes fundamental infrastructure development across dense industrial zones. Utility providers increasingly integrate sophisticated electrochemical energy storage to capture intermittent power generation, drastically redefining peak load management strategies. Implementing smart grid orchestration allows transmission operators to execute precise voltage stabilization systems, decreasing network latency events by 18% during high-demand cycles.
  • Furthermore, the deployment of pumped hydro storage alongside thermal energy reserves guarantees reliable base-load power for massive commercial loads. Corporate strategists systematically prioritize these advanced assets to ensure strict regulatory compliance and budget predictability. The integration of proton exchange membranes and high-capacity electrolyzers directly influences product pricing models for clean fuel processing, compelling facility managers to optimize their capital expenditures.
  • By proactively mitigating operational bottlenecks, enterprises achieve a 25% faster response time in load balancing compared to traditional thermal dispatch methods. These structural upgrades secure continuous electricity delivery while actively decoupling heavy industrial operations from historical fossil-fuel dependencies.

What are the Key Data Covered in this Advanced Energy Market Research and Growth Report?

  • What is the expected growth of the Advanced Energy Market between 2026 and 2030?

    • USD 41.36 billion, at a CAGR of 4.5%

  • What segmentation does the market report cover?

    • The report is segmented by Application (On-grid, and Off-grid), End-user (Residential, and Non-residential), Component (Software, Equipment, and Services) and Geography (APAC, Europe, North America, South America, Middle East and Africa)

  • Which regions are analyzed in the report?

    • APAC, Europe, North America, South America and Middle East and Africa

  • What are the key growth drivers and market challenges?

    • Integration of intermittent renewable energy sources, Supply chain vulnerabilities and raw material scarcity

  • Who are the major players in the Advanced Energy Market?

    • ABB Ltd., Advanced Energy Industries, Ballard Power Systems Inc., Bloom Energy Corp., BYD Co. Ltd., Delta Electronics Inc., Eaton Corp. Plc, Enphase Energy Inc., First Solar Inc., Fluence Energy LLC, FuelCell Energy Inc., GE Vernova Inc., Generac Power Systems Inc., LG Energy Solution Ltd., MKS Instruments Inc., Plug Power Inc., Samsung SDI Co. Ltd., Schneider Electric SE, Siemens Energy AG, SMA Solar Technology AG, SolarEdge Technologies Inc., Sungrow Power Supply Co. Ltd., Tesla Inc., Vicor Corp. and XP Power

Market Research Insights

  • The Advanced Energy sector emphasizes robust grid stability and optimized power distribution. Utility operators utilize frequency regulation capabilities to stabilize intermittent renewable inputs, achieving a 22% improvement in continuous load matching. Implementing sophisticated capacity remuneration mechanisms enables commercial producers to maximize ancillary service revenue efficiently.
  • Through precise time-of-use pricing models, industrial facilities routinely shift consumption patterns, reducing peak energy procurement costs by up to 18%. Widespread integration of smart grid automation software minimizes manual intervention, decreasing localized outage durations by approximately 30%.
  • Furthermore, net-billing tariffs actively incentivize residential consumers to participate in load-balancing protocols, reinforcing grid reliability while expanding the addressable consumer base for advanced energy hardware installations.

We can help! Our analysts can customize this advanced energy market research report to meet your requirements.

Get in touch

1. Executive Summary

1.1 Market overview

Executive Summary - Chart on Market Overview
Executive Summary - Data Table on Market Overview
Executive Summary - Chart on Global Market Characteristics
Executive Summary - Chart on Market by Geography
Executive Summary - Chart on Market Segmentation by Application
Executive Summary - Chart on Market Segmentation by End-user
Executive Summary - Chart on Market Segmentation by Component
Executive Summary - Chart on Incremental Growth
Executive Summary - Data Table on Incremental Growth
Executive Summary - Chart on Company Market Positioning

2. Technavio Analysis

2.1 Analysis of price sensitivity, lifecycle, customer purchase basket, adoption rates, and purchase criteria

2.2 Criticality of inputs and Factors of differentiation

Chart on Overview on criticality of inputs and factors of differentiation

2.3 Factors of disruption

Chart on Overview on factors of disruption

2.4 Impact of drivers and challenges

Chart on Impact of drivers and challenges in 2025 and 2030

3. Market Landscape

3.1 Market ecosystem

Chart on Parent Market
Data Table on - Parent Market

3.2 Market characteristics

Chart on Market characteristics analysis

3.3 Value chain analysis

Chart on Value chain analysis

4. Market Sizing

4.1 Market definition

Data Table on Offerings of companies included in the market definition

4.2 Market segment analysis

Market segments

4.3 Market size 2025

4.4 Market outlook: Forecast for 2025-2030

Chart on Global - Market size and forecast 2025-2030 ($ million)
Data Table on Global - Market size and forecast 2025-2030 ($ million)
Chart on Global Market: Year-over-year growth 2025-2030 (%)
Data Table on Global Market: Year-over-year growth 2025-2030 (%)

5. Historic Market Size

5.1 Global Advanced Energy Market 2020 - 2024

Historic Market Size - Data Table on Global Advanced Energy Market 2020 - 2024 ($ million)

5.2 Application segment analysis 2020 - 2024

Historic Market Size - Application Segment 2020 - 2024 ($ million)

5.3 End-user segment analysis 2020 - 2024

Historic Market Size - End-user Segment 2020 - 2024 ($ million)

5.4 Component segment analysis 2020 - 2024

Historic Market Size - Component Segment 2020 - 2024 ($ million)

5.5 Geography segment analysis 2020 - 2024

Historic Market Size - Geography Segment 2020 - 2024 ($ million)

5.6 Country segment analysis 2020 - 2024

Historic Market Size - Country Segment 2020 - 2024 ($ million)

6. Qualitative Analysis

6.1 Impact of AI on Global Advanced Energy Market

6.2 Impact of geopolitical conflicts on Global Advanced Energy Market

7. Five Forces Analysis

7.1 Five forces summary

Five forces analysis - Comparison between 2025 and 2030

7.2 Bargaining power of buyers

Bargaining power of buyers - Impact of key factors 2025 and 2030

7.3 Bargaining power of suppliers

Bargaining power of suppliers - Impact of key factors in 2025 and 2030

7.4 Threat of new entrants

Threat of new entrants - Impact of key factors in 2025 and 2030

7.5 Threat of substitutes

Threat of substitutes - Impact of key factors in 2025 and 2030

7.6 Threat of rivalry

Threat of rivalry - Impact of key factors in 2025 and 2030

7.7 Market condition

Chart on Market condition - Five forces 2025 and 2030

8. Market Segmentation by Application

8.1 Market segments

Chart on Application - Market share 2025-2030 (%)
Data Table on Application - Market share 2025-2030 (%)

8.2 Comparison by Application

Chart on Comparison by Application
Data Table on Comparison by Application

8.3 On-grid - Market size and forecast 2025-2030

Chart on On-grid - Market size and forecast 2025-2030 ($ million)
Data Table on On-grid - Market size and forecast 2025-2030 ($ million)
Chart on On-grid - Year-over-year growth 2025-2030 (%)
Data Table on On-grid - Year-over-year growth 2025-2030 (%)

8.4 Off-grid - Market size and forecast 2025-2030

Chart on Off-grid - Market size and forecast 2025-2030 ($ million)
Data Table on Off-grid - Market size and forecast 2025-2030 ($ million)
Chart on Off-grid - Year-over-year growth 2025-2030 (%)
Data Table on Off-grid - Year-over-year growth 2025-2030 (%)

8.5 Market opportunity by Application

Market opportunity by Application ($ million)
Data Table on Market opportunity by Application ($ million)

9. Market Segmentation by End-user

9.1 Market segments

Chart on End-user - Market share 2025-2030 (%)
Data Table on End-user - Market share 2025-2030 (%)

9.2 Comparison by End-user

Chart on Comparison by End-user
Data Table on Comparison by End-user

9.3 Residential - Market size and forecast 2025-2030

Chart on Residential - Market size and forecast 2025-2030 ($ million)
Data Table on Residential - Market size and forecast 2025-2030 ($ million)
Chart on Residential - Year-over-year growth 2025-2030 (%)
Data Table on Residential - Year-over-year growth 2025-2030 (%)

9.4 Non-residential - Market size and forecast 2025-2030

Chart on Non-residential - Market size and forecast 2025-2030 ($ million)
Data Table on Non-residential - Market size and forecast 2025-2030 ($ million)
Chart on Non-residential - Year-over-year growth 2025-2030 (%)
Data Table on Non-residential - Year-over-year growth 2025-2030 (%)

9.5 Market opportunity by End-user

Market opportunity by End-user ($ million)
Data Table on Market opportunity by End-user ($ million)

10. Market Segmentation by Component

10.1 Market segments

Chart on Component - Market share 2025-2030 (%)
Data Table on Component - Market share 2025-2030 (%)

10.2 Comparison by Component

Chart on Comparison by Component
Data Table on Comparison by Component

10.3 Software - Market size and forecast 2025-2030

Chart on Software - Market size and forecast 2025-2030 ($ million)
Data Table on Software - Market size and forecast 2025-2030 ($ million)
Chart on Software - Year-over-year growth 2025-2030 (%)
Data Table on Software - Year-over-year growth 2025-2030 (%)

10.4 Equipment - Market size and forecast 2025-2030

Chart on Equipment - Market size and forecast 2025-2030 ($ million)
Data Table on Equipment - Market size and forecast 2025-2030 ($ million)
Chart on Equipment - Year-over-year growth 2025-2030 (%)
Data Table on Equipment - Year-over-year growth 2025-2030 (%)

10.5 Services - Market size and forecast 2025-2030

Chart on Services - Market size and forecast 2025-2030 ($ million)
Data Table on Services - Market size and forecast 2025-2030 ($ million)
Chart on Services - Year-over-year growth 2025-2030 (%)
Data Table on Services - Year-over-year growth 2025-2030 (%)

10.6 Market opportunity by Component

Market opportunity by Component ($ million)
Data Table on Market opportunity by Component ($ million)

11. Customer Landscape

11.1 Customer landscape overview

Analysis of price sensitivity, lifecycle, customer purchase basket, adoption rates, and purchase criteria

12. Geographic Landscape

12.1 Geographic segmentation

Chart on Market share by geography 2025-2030 (%)
Data Table on Market share by geography 2025-2030 (%)

12.2 Geographic comparison

Chart on Geographic comparison
Data Table on Geographic comparison

12.3 APAC - Market size and forecast 2025-2030

Chart on APAC - Market size and forecast 2025-2030 ($ million)
Data Table on APAC - Market size and forecast 2025-2030 ($ million)
Chart on APAC - Year-over-year growth 2025-2030 (%)
Data Table on APAC - Year-over-year growth 2025-2030 (%)
Chart on Regional Comparison - APAC
Data Table on Regional Comparison - APAC

12.3.1 China - Market size and forecast 2025-2030

Chart on China - Market size and forecast 2025-2030 ($ million)
Data Table on China - Market size and forecast 2025-2030 ($ million)
Chart on China - Year-over-year growth 2025-2030 (%)
Data Table on China - Year-over-year growth 2025-2030 (%)

12.3.2 Japan - Market size and forecast 2025-2030

Chart on Japan - Market size and forecast 2025-2030 ($ million)
Data Table on Japan - Market size and forecast 2025-2030 ($ million)
Chart on Japan - Year-over-year growth 2025-2030 (%)
Data Table on Japan - Year-over-year growth 2025-2030 (%)

12.3.3 India - Market size and forecast 2025-2030

Chart on India - Market size and forecast 2025-2030 ($ million)
Data Table on India - Market size and forecast 2025-2030 ($ million)
Chart on India - Year-over-year growth 2025-2030 (%)
Data Table on India - Year-over-year growth 2025-2030 (%)

12.3.4 South Korea - Market size and forecast 2025-2030

Chart on South Korea - Market size and forecast 2025-2030 ($ million)
Data Table on South Korea - Market size and forecast 2025-2030 ($ million)
Chart on South Korea - Year-over-year growth 2025-2030 (%)
Data Table on South Korea - Year-over-year growth 2025-2030 (%)

12.3.5 Australia - Market size and forecast 2025-2030

Chart on Australia - Market size and forecast 2025-2030 ($ million)
Data Table on Australia - Market size and forecast 2025-2030 ($ million)
Chart on Australia - Year-over-year growth 2025-2030 (%)
Data Table on Australia - Year-over-year growth 2025-2030 (%)

12.3.6 Indonesia - Market size and forecast 2025-2030

Chart on Indonesia - Market size and forecast 2025-2030 ($ million)
Data Table on Indonesia - Market size and forecast 2025-2030 ($ million)
Chart on Indonesia - Year-over-year growth 2025-2030 (%)
Data Table on Indonesia - Year-over-year growth 2025-2030 (%)

12.4 Europe - Market size and forecast 2025-2030

Chart on Europe - Market size and forecast 2025-2030 ($ million)
Data Table on Europe - Market size and forecast 2025-2030 ($ million)
Chart on Europe - Year-over-year growth 2025-2030 (%)
Data Table on Europe - Year-over-year growth 2025-2030 (%)
Chart on Regional Comparison - Europe
Data Table on Regional Comparison - Europe

12.4.1 Germany - Market size and forecast 2025-2030

Chart on Germany - Market size and forecast 2025-2030 ($ million)
Data Table on Germany - Market size and forecast 2025-2030 ($ million)
Chart on Germany - Year-over-year growth 2025-2030 (%)
Data Table on Germany - Year-over-year growth 2025-2030 (%)

12.4.2 UK - Market size and forecast 2025-2030

Chart on UK - Market size and forecast 2025-2030 ($ million)
Data Table on UK - Market size and forecast 2025-2030 ($ million)
Chart on UK - Year-over-year growth 2025-2030 (%)
Data Table on UK - Year-over-year growth 2025-2030 (%)

12.4.3 France - Market size and forecast 2025-2030

Chart on France - Market size and forecast 2025-2030 ($ million)
Data Table on France - Market size and forecast 2025-2030 ($ million)
Chart on France - Year-over-year growth 2025-2030 (%)
Data Table on France - Year-over-year growth 2025-2030 (%)

12.4.4 Italy - Market size and forecast 2025-2030

Chart on Italy - Market size and forecast 2025-2030 ($ million)
Data Table on Italy - Market size and forecast 2025-2030 ($ million)
Chart on Italy - Year-over-year growth 2025-2030 (%)
Data Table on Italy - Year-over-year growth 2025-2030 (%)

12.4.5 Spain - Market size and forecast 2025-2030

Chart on Spain - Market size and forecast 2025-2030 ($ million)
Data Table on Spain - Market size and forecast 2025-2030 ($ million)
Chart on Spain - Year-over-year growth 2025-2030 (%)
Data Table on Spain - Year-over-year growth 2025-2030 (%)

12.4.6 The Netherlands - Market size and forecast 2025-2030

Chart on The Netherlands - Market size and forecast 2025-2030 ($ million)
Data Table on The Netherlands - Market size and forecast 2025-2030 ($ million)
Chart on The Netherlands - Year-over-year growth 2025-2030 (%)
Data Table on The Netherlands - Year-over-year growth 2025-2030 (%)

12.5 North America - Market size and forecast 2025-2030

Chart on North America - Market size and forecast 2025-2030 ($ million)
Data Table on North America - Market size and forecast 2025-2030 ($ million)
Chart on North America - Year-over-year growth 2025-2030 (%)
Data Table on North America - Year-over-year growth 2025-2030 (%)
Chart on Regional Comparison - North America
Data Table on Regional Comparison - North America

12.5.1 US - Market size and forecast 2025-2030

Chart on US - Market size and forecast 2025-2030 ($ million)
Data Table on US - Market size and forecast 2025-2030 ($ million)
Chart on US - Year-over-year growth 2025-2030 (%)
Data Table on US - Year-over-year growth 2025-2030 (%)

12.5.2 Canada - Market size and forecast 2025-2030

Chart on Canada - Market size and forecast 2025-2030 ($ million)
Data Table on Canada - Market size and forecast 2025-2030 ($ million)
Chart on Canada - Year-over-year growth 2025-2030 (%)
Data Table on Canada - Year-over-year growth 2025-2030 (%)

12.5.3 Mexico - Market size and forecast 2025-2030

Chart on Mexico - Market size and forecast 2025-2030 ($ million)
Data Table on Mexico - Market size and forecast 2025-2030 ($ million)
Chart on Mexico - Year-over-year growth 2025-2030 (%)
Data Table on Mexico - Year-over-year growth 2025-2030 (%)

12.6 South America - Market size and forecast 2025-2030

Chart on South America - Market size and forecast 2025-2030 ($ million)
Data Table on South America - Market size and forecast 2025-2030 ($ million)
Chart on South America - Year-over-year growth 2025-2030 (%)
Data Table on South America - Year-over-year growth 2025-2030 (%)
Chart on Regional Comparison - South America
Data Table on Regional Comparison - South America

12.6.1 Brazil - Market size and forecast 2025-2030

Chart on Brazil - Market size and forecast 2025-2030 ($ million)
Data Table on Brazil - Market size and forecast 2025-2030 ($ million)
Chart on Brazil - Year-over-year growth 2025-2030 (%)
Data Table on Brazil - Year-over-year growth 2025-2030 (%)

12.6.2 Argentina - Market size and forecast 2025-2030

Chart on Argentina - Market size and forecast 2025-2030 ($ million)
Data Table on Argentina - Market size and forecast 2025-2030 ($ million)
Chart on Argentina - Year-over-year growth 2025-2030 (%)
Data Table on Argentina - Year-over-year growth 2025-2030 (%)

12.6.3 Chile - Market size and forecast 2025-2030

Chart on Chile - Market size and forecast 2025-2030 ($ million)
Data Table on Chile - Market size and forecast 2025-2030 ($ million)
Chart on Chile - Year-over-year growth 2025-2030 (%)
Data Table on Chile - Year-over-year growth 2025-2030 (%)

12.7 Middle East and Africa - Market size and forecast 2025-2030

Chart on Middle East and Africa - Market size and forecast 2025-2030 ($ million)
Data Table on Middle East and Africa - Market size and forecast 2025-2030 ($ million)
Chart on Middle East and Africa - Year-over-year growth 2025-2030 (%)
Data Table on Middle East and Africa - Year-over-year growth 2025-2030 (%)
Chart on Regional Comparison - Middle East and Africa
Data Table on Regional Comparison - Middle East and Africa

12.7.1 Saudi Arabia - Market size and forecast 2025-2030

Chart on Saudi Arabia - Market size and forecast 2025-2030 ($ million)
Data Table on Saudi Arabia - Market size and forecast 2025-2030 ($ million)
Chart on Saudi Arabia - Year-over-year growth 2025-2030 (%)
Data Table on Saudi Arabia - Year-over-year growth 2025-2030 (%)

12.7.2 UAE - Market size and forecast 2025-2030

Chart on UAE - Market size and forecast 2025-2030 ($ million)
Data Table on UAE - Market size and forecast 2025-2030 ($ million)
Chart on UAE - Year-over-year growth 2025-2030 (%)
Data Table on UAE - Year-over-year growth 2025-2030 (%)

12.7.3 South Africa - Market size and forecast 2025-2030

Chart on South Africa - Market size and forecast 2025-2030 ($ million)
Data Table on South Africa - Market size and forecast 2025-2030 ($ million)
Chart on South Africa - Year-over-year growth 2025-2030 (%)
Data Table on South Africa - Year-over-year growth 2025-2030 (%)

12.7.4 Israel - Market size and forecast 2025-2030

Chart on Israel - Market size and forecast 2025-2030 ($ million)
Data Table on Israel - Market size and forecast 2025-2030 ($ million)
Chart on Israel - Year-over-year growth 2025-2030 (%)
Data Table on Israel - Year-over-year growth 2025-2030 (%)

12.7.5 Turkey - Market size and forecast 2025-2030

Chart on Turkey - Market size and forecast 2025-2030 ($ million)
Data Table on Turkey - Market size and forecast 2025-2030 ($ million)
Chart on Turkey - Year-over-year growth 2025-2030 (%)
Data Table on Turkey - Year-over-year growth 2025-2030 (%)

12.8 Market opportunity by geography

Market opportunity by geography ($ million)
Data Tables on Market opportunity by geography ($ million)

13. Drivers, Challenges, and Opportunity

13.1 Market drivers

Integration of intermittent renewable energy sources
Rapid expansion of electric mobility ecosystems
Modernization and digitalization of grids

13.2 Market challenges

Supply chain vulnerabilities and raw material scarcity
Complex regulatory compliance and interconnection delays
High capital expenditure and financing barriers

13.3 Impact of drivers and challenges

Impact of drivers and challenges in 2025 and 2030

13.4 Market opportunities

Rise of green hydrogen technologies
Integration of AI and advanced digital platforms
Deployment of virtual power plants

14. Competitive Landscape

14.1 Overview

14.2

Overview on criticality of inputs and factors of differentiation

14.3 Landscape disruption

Overview on factors of disruption

14.4 Industry risks

Impact of key risks on business

15. Competitive Analysis

15.1 Companies profiled

Companies covered

15.2 Company ranking index

15.3 Market positioning of companies

Matrix on companies position and classification

15.4 ABB Ltd.

ABB Ltd. - Overview
ABB Ltd. - Business segments
ABB Ltd. - Key news
ABB Ltd. - Key offerings
ABB Ltd. - Segment focus
SWOT

15.5 Advanced Energy Industries

Advanced Energy Industries - Overview
Advanced Energy Industries - Business segments
Advanced Energy Industries - Key offerings
Advanced Energy Industries - Segment focus
SWOT

15.6 Bloom Energy Corp.

Bloom Energy Corp. - Overview
Bloom Energy Corp. - Product / Service
Bloom Energy Corp. - Key news
Bloom Energy Corp. - Key offerings
SWOT

15.7 BYD Co. Ltd.

BYD Co. Ltd. - Overview
BYD Co. Ltd. - Business segments
BYD Co. Ltd. - Key news
BYD Co. Ltd. - Key offerings
BYD Co. Ltd. - Segment focus
SWOT

15.8 Delta Electronics Inc.

Delta Electronics Inc. - Overview
Delta Electronics Inc. - Business segments
Delta Electronics Inc. - Key offerings
Delta Electronics Inc. - Segment focus
SWOT

15.9 Eaton Corp. Plc

Eaton Corp. Plc - Overview
Eaton Corp. Plc - Business segments
Eaton Corp. Plc - Key news
Eaton Corp. Plc - Key offerings
Eaton Corp. Plc - Segment focus
SWOT

15.10 Enphase Energy Inc.

Enphase Energy Inc. - Overview
Enphase Energy Inc. - Product / Service
Enphase Energy Inc. - Key news
Enphase Energy Inc. - Key offerings
SWOT

15.11 GE Vernova Inc.

GE Vernova Inc. - Overview
GE Vernova Inc. - Business segments
GE Vernova Inc. - Key offerings
GE Vernova Inc. - Segment focus
SWOT

15.12 Generac Power Systems Inc.

Generac Power Systems Inc. - Overview
Generac Power Systems Inc. - Business segments
Generac Power Systems Inc. - Key news
Generac Power Systems Inc. - Key offerings
Generac Power Systems Inc. - Segment focus
SWOT

15.13 LG Energy Solution Ltd.

LG Energy Solution Ltd. - Overview
LG Energy Solution Ltd. - Product / Service
LG Energy Solution Ltd. - Key news
LG Energy Solution Ltd. - Key offerings
SWOT

15.14 Samsung SDI Co. Ltd.

Samsung SDI Co. Ltd. - Overview
Samsung SDI Co. Ltd. - Business segments
Samsung SDI Co. Ltd. - Key offerings
Samsung SDI Co. Ltd. - Segment focus
SWOT

15.15 Schneider Electric SE

Schneider Electric SE - Overview
Schneider Electric SE - Business segments
Schneider Electric SE - Key news
Schneider Electric SE - Key offerings
Schneider Electric SE - Segment focus
SWOT

15.16 Siemens Energy AG

Siemens Energy AG - Overview
Siemens Energy AG - Business segments
Siemens Energy AG - Key news
Siemens Energy AG - Key offerings
Siemens Energy AG - Segment focus
SWOT

15.17 Sungrow Power Supply Co. Ltd.

Sungrow Power Supply Co. Ltd. - Overview
Sungrow Power Supply Co. Ltd. - Product / Service
Sungrow Power Supply Co. Ltd. - Key offerings
SWOT

15.18 Tesla Inc.

Tesla Inc. - Overview
Tesla Inc. - Business segments
Tesla Inc. - Key offerings
Tesla Inc. - Segment focus
SWOT

16. Appendix

16.1 Scope of the report

Market definition
Objectives
Notes and caveats

16.2 Inclusions and exclusions checklist

Inclusions checklist
Exclusions checklist

16.3 Currency conversion rates for US$

16.4 Research methodology

16.5 Data procurement

Information sources

16.6 Data validation

16.7 Validation techniques employed for market sizing

16.8 Data synthesis

16.9 360 degree market analysis

16.10 List of abbreviations

Research Methodology

Technavio presents a detailed picture of the market by way of study, synthesis, and summation of data from multiple sources. The analysts have presented the various facets of the market with a particular focus on identifying the key industry influencers. The data thus presented is comprehensive, reliable, and the result of extensive research, both primary and secondary.

INFORMATION SOURCES

Primary sources

  • Manufacturers and suppliers
  • Channel partners
  • Industry experts
  • Strategic decision makers

Secondary sources

  • Industry journals and periodicals
  • Government data
  • Financial reports of key industry players
  • Historical data
  • Press releases

DATA ANALYSIS

Data Synthesis

  • Collation of data
  • Estimation of key figures
  • Analysis of derived insights

Data Validation

  • Triangulation with data models
  • Reference against proprietary databases
  • Corroboration with industry experts

REPORT WRITING

Qualitative

  • Market drivers
  • Market challenges
  • Market trends
  • Five forces analysis

Quantitative

  • Market size and forecast
  • Market segmentation
  • Geographical insights
  • Competitive landscape

Interested in this report?

Get your sample now to see our research methodology and insights!

Download Now

Frequently Asked Questions

Advanced Energy market growth will increase by USD 41356.4 million during 2026-2030.

The Advanced Energy market is expected to grow at a CAGR of 4.5% during 2026-2030.

Advanced Energy market is segmented by Application (On-grid, Off-grid) End-user (Residential, Non-residential) Component (Software, Equipment, Services)

ABB Ltd., Advanced Energy Industries, Ballard Power Systems Inc., Bloom Energy Corp., BYD Co. Ltd., Delta Electronics Inc., Eaton Corp. Plc, Enphase Energy Inc., First Solar Inc., Fluence Energy LLC, FuelCell Energy Inc., GE Vernova Inc., Generac Power Systems Inc., LG Energy Solution Ltd., MKS Instruments Inc., Plug Power Inc., Samsung SDI Co. Ltd., Schneider Electric SE, Siemens Energy AG, SMA Solar Technology AG, SolarEdge Technologies Inc., Sungrow Power Supply Co. Ltd., Tesla Inc., Vicor Corp., XP Power are a few of the key vendors in the Advanced Energy market.

APAC will register the highest growth rate of 34.6% among the other regions. Therefore, the Advanced Energy market in APAC is expected to garner significant business opportunities for the vendors during the forecast period.

China, Japan, India, South Korea, Australia, Indonesia, Germany, UK, France, Italy, Spain, The Netherlands, US, Canada, Mexico, Brazil, Argentina, Chile, Saudi Arabia, UAE, South Africa, Israel, Turkey

  • Integration of intermittent renewable energy sources is the driving factor this market.

The Advanced Energy market vendors should focus on grabbing business opportunities from the Application segment as it accounted for the largest market share in the base year.
RIA - Research AI Assistant
Ask RIA
