
Advanced High Strength Steel Market Analysis, Size, and Forecast 2026-2030: APAC (China, Japan, and India), North America (US, Canada, and Mexico), Europe (Germany, UK, and France), South America (Brazil, Argentina, and Chile), Middle East and Africa (Saudi Arabia, Turkey, and UAE), and Rest of World (ROW)

Advanced High Strength Steel Market Analysis, Size, and Forecast 2026-2030:
APAC (China, Japan, and India), North America (US, Canada, and Mexico), Europe (Germany, UK, and France), South America (Brazil, Argentina, and Chile), Middle East and Africa (Saudi Arabia, Turkey, and UAE), and Rest of World (ROW)

Published: Oct 2026 312 Pages SKU: IRTNTR46602

Market Overview at a Glance

$22.39 B
Market Opportunity
13.2%
CAGR 2025 - 2030
47.6%
APAC Growth
$9.65 B
Dual phase segment 2024

Advanced High Strength Steel Market Size 2026-2030

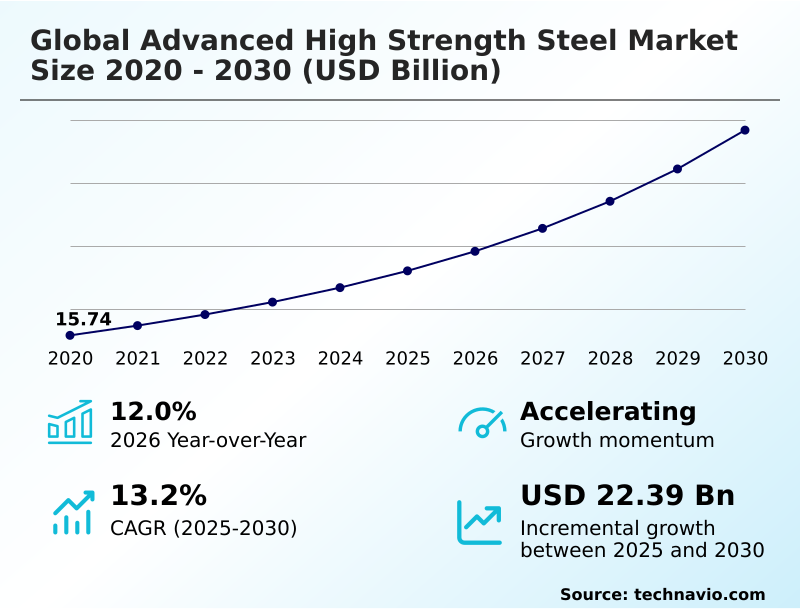
The advanced high strength steel market size is valued to increase by USD 22.39 billion, at a CAGR of 13.2% from 2025 to 2030. Vehicle lightweighting and strict emission regulations will drive the advanced high strength steel market.

Major Market Trends & Insights

  • APAC dominated the market and accounted for a 47.6% growth during the forecast period.
  • By Grade Type - Dual phase segment was valued at USD 9.65 billion in 2024
  • By End-user - Automobile segment accounted for the largest market revenue share in 2024

Market Size & Forecast

  • Market Opportunities: USD 32.64 billion
  • Market Future Opportunities: USD 22.39 billion
  • CAGR from 2025 to 2030 : 13.2%

Market Summary

  • The Advanced High Strength Steel Market operates as a critical materials foundation for modern manufacturing, driven by the universal mandate to optimize structural integrity while minimizing mass. Original equipment manufacturers consistently substitute conventional mild steels with complex multiphase alloys to achieve superior strength-to-weight ratios.
  • In a practical supply chain scenario, automotive producers implementing these advanced metallurgical grades have achieved a 30% reduction in vehicle body weight compared to traditional carbon steel assemblies, significantly extending the operational range of electric vehicle battery platforms.
  • Strict tailpipe emission regulations and crash safety mandates act as the primary drivers, compelling engineers to specify gigapascal-class materials for passenger cabin architectures. Conversely, the high capital investment required to upgrade continuous annealing lines and modify stamping die tooling acts as a substantial operational challenge for tier-one suppliers.
  • Despite these integration barriers, the ongoing transition toward fossil-free production frameworks ensures that high-performance steel remains essential for sustainable industrial fabrication. Advanced high strength steel continues to redefine the boundaries of heavy infrastructure engineering.

What will be the Size of the Advanced High Strength Steel Market during the forecast period?
Get Key Insights on Market Forecast (PDF) Get Free Sample

How is the Advanced High Strength Steel Market Segmented?

The advanced high strength steel industry research report provides comprehensive data (region-wise segment analysis), with forecasts and estimates in "USD million" for the period 2026-2030, as well as historical data from 2020-2024 for the following segments.

  • Grade type
    • Dual phase
    • Complex phase
    • Transformation-induced plasticity
    • Others
  • End-user
    • Automobile
    • Construction
    • Aviation and marine
    • Others
  • Product type
    • Sheets
    • Coils
    • Plates
    • Others
  • Geography
    • APAC
      • China
      • Japan
      • India
      • South Korea
      • Australia
      • Indonesia
    • North America
      • US
      • Canada
      • Mexico
    • Europe
      • Germany
      • UK
      • France
      • Italy
      • Spain
      • The Netherlands
    • South America
      • Brazil
      • Argentina
      • Chile
    • Middle East and Africa
      • Saudi Arabia
      • Turkey
      • UAE
      • South Africa
      • Israel

By Grade Type Insights

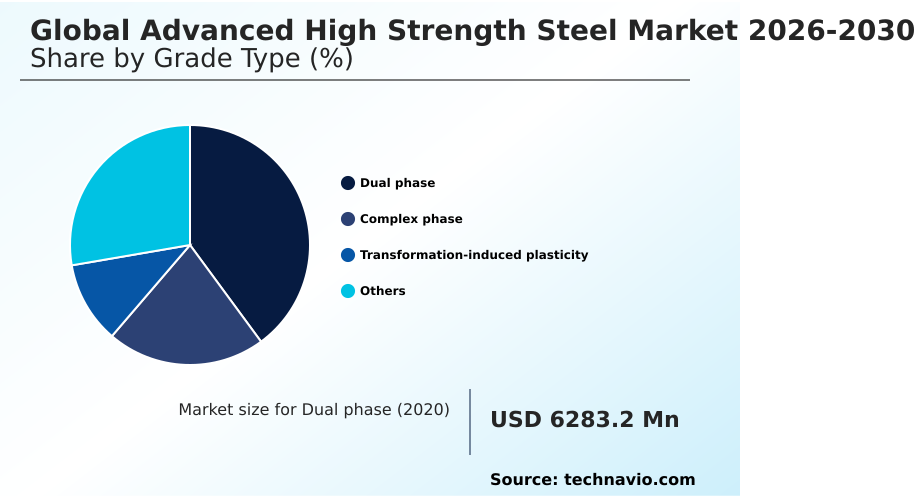
The dual phase segment is estimated to witness significant growth during the forecast period.

The dual phase steel segment anchors the Advanced High Strength Steel operations across the automotive manufacturing sector due to its optimal balance of high tensile strength and superior formability.

Characterized by a soft ferrite matrix interspersed with hard martensitic steel islands, this material delivers an exceptional yield to tensile ratio alongside rapid work hardening rates during automated press-forming.

Original equipment manufacturers integrate these materials extensively into body in white structures and passenger cabin safety cages to maximize crash energy absorption.

By enabling significant vehicle mass reduction without compromising structural integrity, automotive lightweighting initiatives have achieved a 30% reduction in total component weight.

This material efficiency directly enhances structural crashworthiness while streamlining continuous stamping operations, ensuring manufacturers meet stringent safety mandates while maintaining high-volume production throughput.
Get Free Sample

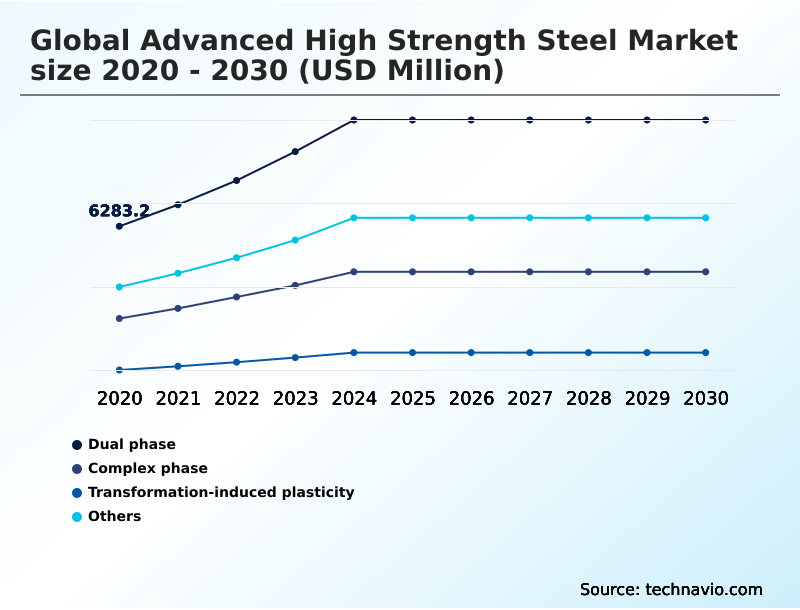
The Dual phase segment was valued at USD 9.65 billion in 2024 and showed a gradual increase during the forecast period.
Get Free Sample

Regional Analysis

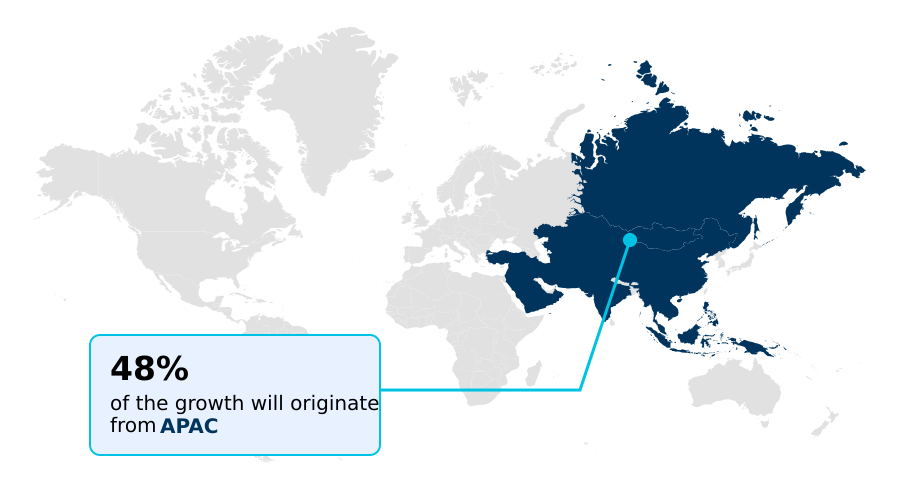
APAC is estimated to contribute 47.6% to the growth of the global market during the forecast period.Technavio’s analysts have elaborately explained the regional trends and drivers that shape the market during the forecast period.
See How Advanced High Strength Steel Market Demand is Rising in APAC Get Free Sample

The Advanced High Strength Steel landscape exhibits distinct regional variations driven by industrial maturation and supply chain localization.

APAC dominates the consumption landscape, demonstrating a 47.6% regional incremental growth advantage over North America, largely fueled by massive electric vehicle manufacturing clusters in China and South Korea.

In APAC, the rapid integration of direct reduced iron facilities has optimized continuous stamping operations, yielding a 20% enhancement in high-volume production throughput.

Conversely, the North America region prioritizes stringent safety mandates, leading to a 15% faster adoption rate of press hardened boron steel for side impact intrusion beams.

While APAC accelerates capacity expansion for battery enclosure frames, North America focuses on upgrading continuous annealing lines to support domestic automotive lightweighting mandates.

These regional disparities reflect diverging strategic priorities, where Asian manufacturers optimize for scale and cost efficiency, while North American operations invest heavily in compliance-driven crash energy absorption upgrades.

Market Dynamics

Our researchers analyzed the data with 2025 as the base year, along with the key drivers, trends, and challenges. A holistic analysis of drivers will help companies refine their marketing strategies to gain a competitive advantage.

  • The continuous evolution of the Advanced High Strength Steel sector is fundamentally reshaping how industrial manufacturers approach structural engineering and supply chain resilience. As original equipment manufacturers prioritize decarbonization, the integration of hydrogen based direct reduction technology has become a critical compliance mechanism, offering a significantly lower carbon footprint than traditional blast furnace operations.
  • This shift directly supports the commercial viability of third generation automotive structural steels, which are rapidly replacing heavier legacy alloys in mass-production environments. By implementing these advanced multiphase materials, automotive engineers can achieve an estimated 20% reduction in total structural mass, a critical factor for optimizing electric vehicle battery protection architectures.
  • Furthermore, the complexities of forming these ultra-high-tensile materials have driven stamping facilities to adopt artificial intelligence optimized die design, thereby minimizing springback defects and reducing costly physical tooling iterations. This digital transformation in the manufacturing workflow allows tier-one suppliers to produce ultra high strength safety cages with unparalleled precision and repeatability.
  • In comparison to conventional steel sourcing, the procurement of these advanced grades requires more rigorous metallurgical validation, pushing procurement teams to establish long-term strategic partnerships with specialized steelmakers. Ultimately, the intersection of green steelmaking and advanced digital processing ensures that high-performance steel solutions remain the material of choice for demanding structural applications.
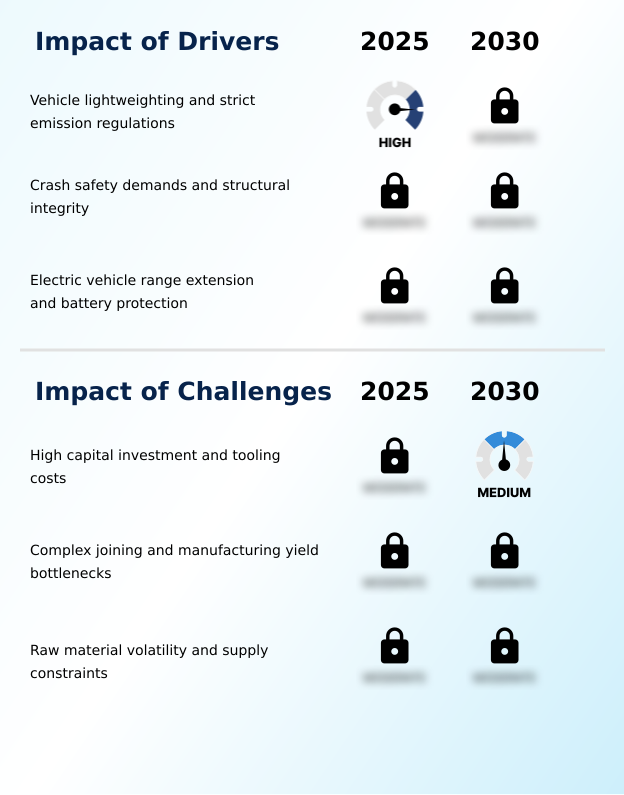
What are the key market drivers leading to the rise in the adoption of Advanced High Strength Steel Industry?

  • Vehicle lightweighting initiatives, coupled with strict emission regulations, act as the primary drivers propelling market growth.

  • Aggressive regulatory frameworks mandating vehicle mass reduction serve as a paramount driver propelling the Advanced High Strength Steel operations.
  • Automotive engineers are compelled to specify gigapascal class steel materials to offset heavy battery loads, triggering a 25% increase in the utilization of multiphasic microstructures across new vehicle platforms.
  • Concurrently, the expansion of green hydrogen reduction within electric arc furnace operations has optimized the supply of low-carbon inputs. This structural transition allows manufacturers to enhance resistance spot welding reliability, subsequently lowering assembly line rework costs by 12%.
  • Beyond mobility, the necessity for robust offshore energy infrastructure continually drives procurement of high-yield plates capable of withstanding extreme environmental stresses. These dynamics directly benefit industrial operations by maximizing load-bearing capacities and extending the lifecycle of critical engineering assets.

What are the market trends shaping the Advanced High Strength Steel Industry?

  • The commercialization of third-generation steel grades represents a prominent upcoming trend in the market. These advanced materials optimize the balance between tensile strength and formability for complex manufacturing applications.

  • The integration of fossil free steel into commercial manufacturing networks represents a definitive trend reshaping the Advanced High Strength Steel operational landscape. Driven by stringent corporate net-zero targets, prominent metallurgical enterprises are actively transitioning toward sustainable steelmaking methodologies.
  • By leveraging optimized quenching and partitioning processes, steelmakers have increased the stabilization of retained austenite, resulting in a 15% enhancement in material elongation properties. This shift allows automotive manufacturers to stamp intricate structural components while simultaneously lowering embodied carbon footprints by up to 30% compared to traditional fossil-fueled production.
  • The expansion of high-purity scrap metal recycling further supports this trend, ensuring that electric arc furnaces maintain consistent melt chemistry. These continuous process refinements directly impact businesses by aligning material procurement strategies with rigorous environmental compliance mandates.

What challenges does the Advanced High Strength Steel Industry face during its growth?

  • High capital investments and substantial tooling costs constitute the primary challenges hindering industry expansion.

  • The inherent metallurgical complexities associated with automated roll forming of ultra-high-tensile materials present significant structural challenges for the Advanced High Strength Steel sector. Elevated alloying elements required to achieve an optimal yield to tensile ratio frequently exacerbate liquid metal embrittlement during high-speed assembly, leading to a 20% increase in non-destructive testing requirements.
  • Furthermore, the pronounced springback behavior of these multiphase steels dramatically extends die tryout phases, elevating initial tooling expenditure by as much as 30% for tier-one automotive suppliers. This operational friction forces engineering teams to invest heavily in advanced sensor networks and servo-hydraulic press controls.
  • Consequently, the high capital threshold required to process these advanced materials restricts rapid adoption among smaller fabrication enterprises supplying components for seismic resistant construction and heavy machinery applications.

Exclusive Technavio Analysis on Customer Landscape

The advanced high strength steel market forecasting report includes the adoption lifecycle of the market, covering from the innovator’s stage to the laggard’s stage. It focuses on adoption rates in different regions based on penetration. Furthermore, the advanced high strength steel market report also includes key purchase criteria and drivers of price sensitivity to help companies evaluate and develop their market growth analysis strategies.
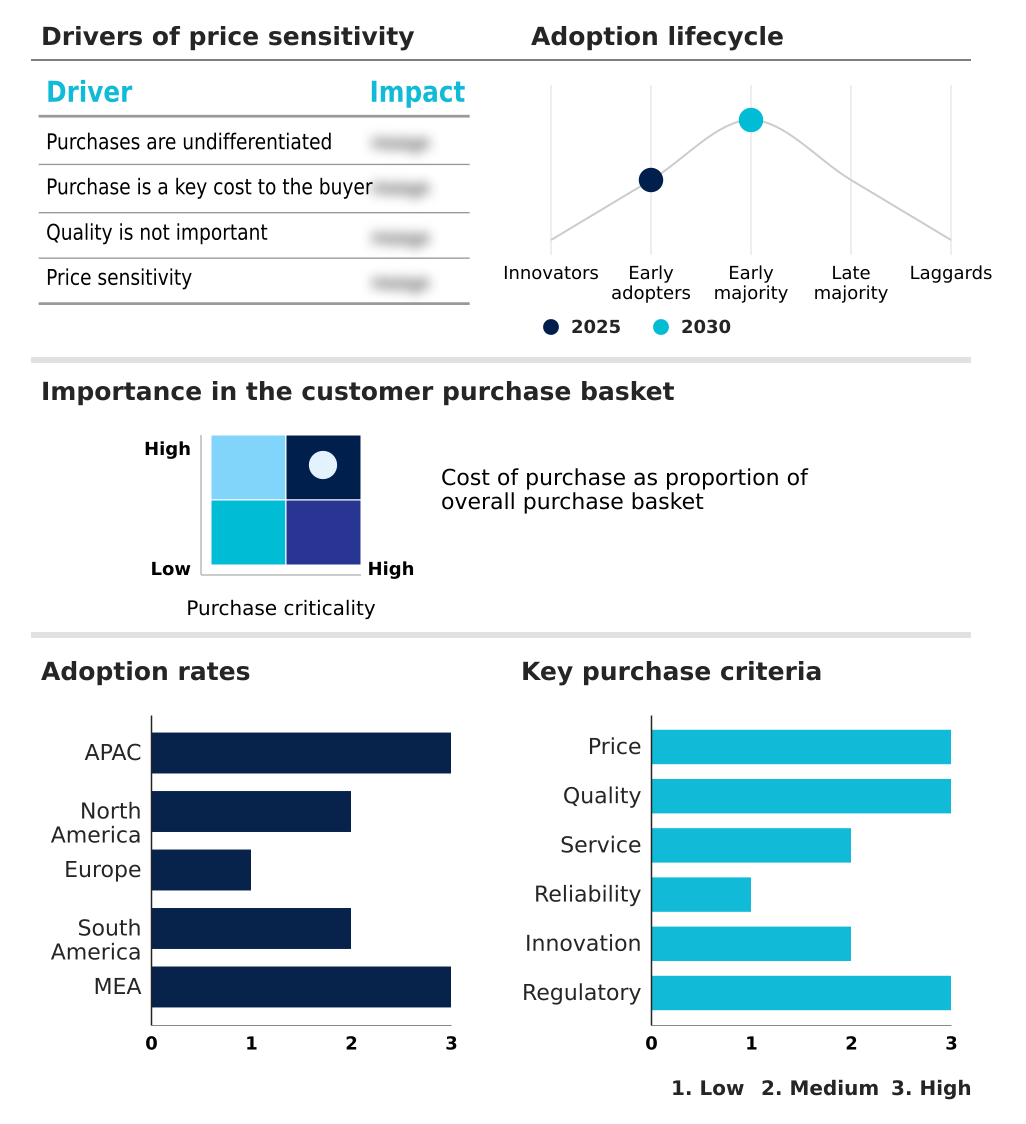
Customer Landscape of Advanced High Strength Steel Industry

Competitive Landscape

Companies are implementing various strategies, such as strategic alliances, advanced high strength steel market forecast, partnerships, mergers and acquisitions, geographical expansion, and product/service launches, to enhance their presence in the industry.

Ansteel Group Corp. - Provides specialized advanced high strength steel solutions, including dual-phase and quench-and-partitioning grades, engineered to enhance automotive structural integrity and facilitate critical vehicle lightweighting strategies.

The industry research and growth report includes detailed analyses of the competitive landscape of the market and information about key companies, including:

  • Ansteel Group Corp.
  • ArcelorMittal S.A.
  • Baosteel Co. Ltd.
  • China Steel Corp.
  • Cleveland Cliffs Inc.
  • Companhia Siderurgica Nacional
  • Hyundai Steel Co.
  • JSW Steel Ltd.
  • Kobe Steel Ltd.
  • Nippon Steel Corp.
  • NLMK Group
  • Nucor Corp.
  • PAO Severstal
  • POSCO Co. Ltd.
  • Salzgitter AG
  • SSAB AB
  • Steel Dynamics Inc.
  • Tata Steel Ltd.
  • Ternium S.A.
  • United States Steel Corp.

Qualitative and quantitative analysis of companies has been conducted to help clients understand the wider business environment as well as the strengths and weaknesses of key industry players. Data is qualitatively analyzed to categorize companies as pure play, category-focused, industry-focused, and diversified; it is quantitatively analyzed to categorize companies as dominant, leading, strong, tentative, and weak.

Recent Development and News in Advanced high strength steel market

  • In the Steel industry, the rapid deployment of electric arc furnace technologies utilizing green hydrogen reduction has optimized sustainable steelmaking, directly impacting Advanced High Strength Steel demand by providing low-emission structural materials for eco-conscious automotive platforms.
  • The implementation of the EU Carbon Border Adjustment Mechanism has accelerated scrap metal recycling initiatives, directly impacting Advanced High Strength Steel demand by forcing European manufacturers to source fossil free steel for critical infrastructure projects.
  • The integration of digital twin simulations and machine learning algorithms into continuous annealing lines has reduced production scrap by 15%, directly impacting Advanced High Strength Steel supply by enhancing the microstructural consistency of gigapascal class steel grades.
  • The shift toward complex multiphasic microstructures in heavy industrial machinery design has improved low temperature fracture toughness, directly impacting Advanced High Strength Steel demand by enabling the construction of highly durable offshore energy infrastructure.

Dive into Technavio’s robust research methodology, blending expert interviews, extensive data synthesis, and validated models for unparalleled Advanced High Strength Steel Market insights. See full methodology.

Market Scope
Page number 312
Base year 2025
Historic period 2020-2024
Forecast period 2026-2030
Growth momentum & CAGR Accelerate at a CAGR of 13.2%
Market growth 2026-2030 USD 22390.5 million
Market structure Fragmented
YoY growth 2025-2026(%) 12.0%
Key countries China, Japan, India, South Korea, Australia, Indonesia, US, Canada, Mexico, Germany, UK, France, Italy, Spain, The Netherlands, Brazil, Argentina, Chile, Saudi Arabia, Turkey, UAE, South Africa and Israel
Competitive landscape Leading Companies, Market Positioning of Companies, Competitive Strategies, and Industry Risks

Request Free Sample

Research Analyst Overview

  • The Advanced High Strength Steel landscape is undergoing a profound metallurgical transformation characterized by the widespread adoption of complex phase steel and twinning induced plasticity formulations. Industrial processors are rapidly upgrading thermo mechanical rolling and hot dip galvanizing capabilities to meet rigorous safety specifications without increasing material thickness.
  • This transition critically impacts boardroom-level product strategy, as engineering directors pivot toward multiphasic microstructures to satisfy stringent environmental and performance regulations. By substituting conventional materials with transformation induced plasticity grades, automotive stamping facilities have realized a 25% improvement in stretch flangeability, enabling the consolidation of multi-piece welded assemblies into single, complex-formed components.
  • This optimization significantly enhances edge crack resistance during high-stress forming operations. Furthermore, the strategic deployment of micro alloying precipitates within the bainite matrix allows manufacturers to achieve unprecedented strength levels while maintaining essential ductility.
  • Consequently, advanced high-strength solutions remain indispensable for heavy infrastructure and mobility applications, ensuring that structural integrity and operational efficiency continually progress in tandem with evolving industrial demands.

What are the Key Data Covered in this Advanced High Strength Steel Market Research and Growth Report?

  • What is the expected growth of the Advanced High Strength Steel Market between 2026 and 2030?

    • USD 22.39 billion, at a CAGR of 13.2%

  • What segmentation does the market report cover?

    • The report is segmented by Grade Type (Dual phase, Complex phase, Transformation-induced plasticity, and Others), End-user (Automobile, Construction, Aviation and marine, and Others), Product Type (Sheets, Coils, Plates, and Others) and Geography (APAC, North America, Europe, South America, Middle East and Africa)

  • Which regions are analyzed in the report?

    • APAC, North America, Europe, South America and Middle East and Africa

  • What are the key growth drivers and market challenges?

    • Vehicle lightweighting and strict emission regulations, High capital investment and tooling costs

  • Who are the major players in the Advanced High Strength Steel Market?

    • Ansteel Group Corp., ArcelorMittal S.A., Baosteel Co. Ltd., China Steel Corp., Cleveland Cliffs Inc., Companhia Siderurgica Nacional, Hyundai Steel Co., JSW Steel Ltd., Kobe Steel Ltd., Nippon Steel Corp., NLMK Group, Nucor Corp., PAO Severstal, POSCO Co. Ltd., Salzgitter AG, SSAB AB, Steel Dynamics Inc., Tata Steel Ltd., Ternium S.A. and United States Steel Corp.

Market Research Insights

  • The Advanced High Strength Steel Market demonstrates robust structural evolution driven by the integration of tailor welded blanks and automation in continuous stamping operations. Industrial manufacturers leveraging these high-performance alloys have realized a 25% improvement in structural crashworthiness, fundamentally altering automotive safety designs.
  • Concurrently, the adoption of digital twin simulations during die tryout phases has accelerated production cycles, reducing material scrap rates by 18% compared to traditional tooling methods. This transition directly supports automotive lightweighting strategies, enabling original equipment manufacturers to optimize battery enclosure frames for electric platforms.
  • These measurable efficiency gains underscore the critical role of advanced metallurgical solutions in enhancing both operational cost-effectiveness and long-term regulatory compliance.

We can help! Our analysts can customize this advanced high strength steel market research report to meet your requirements.

Get in touch

1. Executive Summary

1.1 Market overview

Executive Summary - Chart on Market Overview
Executive Summary - Data Table on Market Overview
Executive Summary - Chart on Global Market Characteristics
Executive Summary - Chart on Market by Geography
Executive Summary - Chart on Market Segmentation by Grade Type
Executive Summary - Chart on Market Segmentation by End-user
Executive Summary - Chart on Market Segmentation by Product Type
Executive Summary - Chart on Incremental Growth
Executive Summary - Data Table on Incremental Growth
Executive Summary - Chart on Company Market Positioning

2. Technavio Analysis

2.1 Analysis of price sensitivity, lifecycle, customer purchase basket, adoption rates, and purchase criteria

2.2 Criticality of inputs and Factors of differentiation

Chart on Overview on criticality of inputs and factors of differentiation

2.3 Factors of disruption

Chart on Overview on factors of disruption

2.4 Impact of drivers and challenges

Chart on Impact of drivers and challenges in 2025 and 2030

3. Market Landscape

3.1 Market ecosystem

Chart on Parent Market
Data Table on - Parent Market

3.2 Market characteristics

Chart on Market characteristics analysis

3.3 Value chain analysis

Chart on Value chain analysis

4. Market Sizing

4.1 Market definition

Data Table on Offerings of companies included in the market definition

4.2 Market segment analysis

Market segments

4.3 Market size 2025

4.4 Market outlook: Forecast for 2025-2030

Chart on Global - Market size and forecast 2025-2030 ($ million)
Data Table on Global - Market size and forecast 2025-2030 ($ million)
Chart on Global Market: Year-over-year growth 2025-2030 (%)
Data Table on Global Market: Year-over-year growth 2025-2030 (%)

5. Historic Market Size

5.1 Global Advanced High Strength Steel Market 2020 - 2024

Historic Market Size - Data Table on Global Advanced High Strength Steel Market 2020 - 2024 ($ million)

5.2 Grade Type segment analysis 2020 - 2024

Historic Market Size - Grade Type Segment 2020 - 2024 ($ million)

5.3 End-user segment analysis 2020 - 2024

Historic Market Size - End-user Segment 2020 - 2024 ($ million)

5.4 Product Type segment analysis 2020 - 2024

Historic Market Size - Product Type Segment 2020 - 2024 ($ million)

5.5 Geography segment analysis 2020 - 2024

Historic Market Size - Geography Segment 2020 - 2024 ($ million)

5.6 Country segment analysis 2020 - 2024

Historic Market Size - Country Segment 2020 - 2024 ($ million)

6. Qualitative Analysis

6.1 Impact of AI on global advanced high strength steel market

6.2 Impact of geopolitical conflicts on global advanced high strength steel market

7. Five Forces Analysis

7.1 Five forces summary

Five forces analysis - Comparison between 2025 and 2030

7.2 Bargaining power of buyers

Bargaining power of buyers - Impact of key factors 2025 and 2030

7.3 Bargaining power of suppliers

Bargaining power of suppliers - Impact of key factors in 2025 and 2030

7.4 Threat of new entrants

Threat of new entrants - Impact of key factors in 2025 and 2030

7.5 Threat of substitutes

Threat of substitutes - Impact of key factors in 2025 and 2030

7.6 Threat of rivalry

Threat of rivalry - Impact of key factors in 2025 and 2030

7.7 Market condition

Chart on Market condition - Five forces 2025 and 2030

8. Market Segmentation by Grade Type

8.1 Market segments

Chart on Grade Type - Market share 2025-2030 (%)
Data Table on Grade Type - Market share 2025-2030 (%)

8.2 Comparison by Grade Type

Chart on Comparison by Grade Type
Data Table on Comparison by Grade Type

8.3 Dual phase - Market size and forecast 2025-2030

Chart on Dual phase - Market size and forecast 2025-2030 ($ million)
Data Table on Dual phase - Market size and forecast 2025-2030 ($ million)
Chart on Dual phase - Year-over-year growth 2025-2030 (%)
Data Table on Dual phase - Year-over-year growth 2025-2030 (%)

8.4 Complex phase - Market size and forecast 2025-2030

Chart on Complex phase - Market size and forecast 2025-2030 ($ million)
Data Table on Complex phase - Market size and forecast 2025-2030 ($ million)
Chart on Complex phase - Year-over-year growth 2025-2030 (%)
Data Table on Complex phase - Year-over-year growth 2025-2030 (%)

8.5 Transformation-induced plasticity - Market size and forecast 2025-2030

Chart on Transformation-induced plasticity - Market size and forecast 2025-2030 ($ million)
Data Table on Transformation-induced plasticity - Market size and forecast 2025-2030 ($ million)
Chart on Transformation-induced plasticity - Year-over-year growth 2025-2030 (%)
Data Table on Transformation-induced plasticity - Year-over-year growth 2025-2030 (%)

8.6 Others - Market size and forecast 2025-2030

Chart on Others - Market size and forecast 2025-2030 ($ million)
Data Table on Others - Market size and forecast 2025-2030 ($ million)
Chart on Others - Year-over-year growth 2025-2030 (%)
Data Table on Others - Year-over-year growth 2025-2030 (%)

8.7 Market opportunity by Grade Type

Market opportunity by Grade Type ($ million)
Data Table on Market opportunity by Grade Type ($ million)

9. Market Segmentation by End-user

9.1 Market segments

Chart on End-user - Market share 2025-2030 (%)
Data Table on End-user - Market share 2025-2030 (%)

9.2 Comparison by End-user

Chart on Comparison by End-user
Data Table on Comparison by End-user

9.3 Automobile - Market size and forecast 2025-2030

Chart on Automobile - Market size and forecast 2025-2030 ($ million)
Data Table on Automobile - Market size and forecast 2025-2030 ($ million)
Chart on Automobile - Year-over-year growth 2025-2030 (%)
Data Table on Automobile - Year-over-year growth 2025-2030 (%)

9.4 Construction - Market size and forecast 2025-2030

Chart on Construction - Market size and forecast 2025-2030 ($ million)
Data Table on Construction - Market size and forecast 2025-2030 ($ million)
Chart on Construction - Year-over-year growth 2025-2030 (%)
Data Table on Construction - Year-over-year growth 2025-2030 (%)

9.5 Aviation and marine - Market size and forecast 2025-2030

Chart on Aviation and marine - Market size and forecast 2025-2030 ($ million)
Data Table on Aviation and marine - Market size and forecast 2025-2030 ($ million)
Chart on Aviation and marine - Year-over-year growth 2025-2030 (%)
Data Table on Aviation and marine - Year-over-year growth 2025-2030 (%)

9.6 Others - Market size and forecast 2025-2030

Chart on Others - Market size and forecast 2025-2030 ($ million)
Data Table on Others - Market size and forecast 2025-2030 ($ million)
Chart on Others - Year-over-year growth 2025-2030 (%)
Data Table on Others - Year-over-year growth 2025-2030 (%)

9.7 Market opportunity by End-user

Market opportunity by End-user ($ million)
Data Table on Market opportunity by End-user ($ million)

10. Market Segmentation by Product Type

10.1 Market segments

Chart on Product Type - Market share 2025-2030 (%)
Data Table on Product Type - Market share 2025-2030 (%)

10.2 Comparison by Product Type

Chart on Comparison by Product Type
Data Table on Comparison by Product Type

10.3 Sheets - Market size and forecast 2025-2030

Chart on Sheets - Market size and forecast 2025-2030 ($ million)
Data Table on Sheets - Market size and forecast 2025-2030 ($ million)
Chart on Sheets - Year-over-year growth 2025-2030 (%)
Data Table on Sheets - Year-over-year growth 2025-2030 (%)

10.4 Coils - Market size and forecast 2025-2030

Chart on Coils - Market size and forecast 2025-2030 ($ million)
Data Table on Coils - Market size and forecast 2025-2030 ($ million)
Chart on Coils - Year-over-year growth 2025-2030 (%)
Data Table on Coils - Year-over-year growth 2025-2030 (%)

10.5 Plates - Market size and forecast 2025-2030

Chart on Plates - Market size and forecast 2025-2030 ($ million)
Data Table on Plates - Market size and forecast 2025-2030 ($ million)
Chart on Plates - Year-over-year growth 2025-2030 (%)
Data Table on Plates - Year-over-year growth 2025-2030 (%)

10.6 Others - Market size and forecast 2025-2030

Chart on Others - Market size and forecast 2025-2030 ($ million)
Data Table on Others - Market size and forecast 2025-2030 ($ million)
Chart on Others - Year-over-year growth 2025-2030 (%)
Data Table on Others - Year-over-year growth 2025-2030 (%)

10.7 Market opportunity by Product Type

Market opportunity by Product Type ($ million)
Data Table on Market opportunity by Product Type ($ million)

11. Customer Landscape

11.1 Customer landscape overview

Analysis of price sensitivity, lifecycle, customer purchase basket, adoption rates, and purchase criteria

12. Geographic Landscape

12.1 Geographic segmentation

Chart on Market share by geography 2025-2030 (%)
Data Table on Market share by geography 2025-2030 (%)

12.2 Geographic comparison

Chart on Geographic comparison
Data Table on Geographic comparison

12.3 APAC - Market size and forecast 2025-2030

Chart on APAC - Market size and forecast 2025-2030 ($ million)
Data Table on APAC - Market size and forecast 2025-2030 ($ million)
Chart on APAC - Year-over-year growth 2025-2030 (%)
Data Table on APAC - Year-over-year growth 2025-2030 (%)
Chart on Regional Comparison - APAC
Data Table on Regional Comparison - APAC

12.3.1 China - Market size and forecast 2025-2030

Chart on China - Market size and forecast 2025-2030 ($ million)
Data Table on China - Market size and forecast 2025-2030 ($ million)
Chart on China - Year-over-year growth 2025-2030 (%)
Data Table on China - Year-over-year growth 2025-2030 (%)

12.3.2 Japan - Market size and forecast 2025-2030

Chart on Japan - Market size and forecast 2025-2030 ($ million)
Data Table on Japan - Market size and forecast 2025-2030 ($ million)
Chart on Japan - Year-over-year growth 2025-2030 (%)
Data Table on Japan - Year-over-year growth 2025-2030 (%)

12.3.3 India - Market size and forecast 2025-2030

Chart on India - Market size and forecast 2025-2030 ($ million)
Data Table on India - Market size and forecast 2025-2030 ($ million)
Chart on India - Year-over-year growth 2025-2030 (%)
Data Table on India - Year-over-year growth 2025-2030 (%)

12.3.4 South Korea - Market size and forecast 2025-2030

Chart on South Korea - Market size and forecast 2025-2030 ($ million)
Data Table on South Korea - Market size and forecast 2025-2030 ($ million)
Chart on South Korea - Year-over-year growth 2025-2030 (%)
Data Table on South Korea - Year-over-year growth 2025-2030 (%)

12.3.5 Australia - Market size and forecast 2025-2030

Chart on Australia - Market size and forecast 2025-2030 ($ million)
Data Table on Australia - Market size and forecast 2025-2030 ($ million)
Chart on Australia - Year-over-year growth 2025-2030 (%)
Data Table on Australia - Year-over-year growth 2025-2030 (%)

12.3.6 Indonesia - Market size and forecast 2025-2030

Chart on Indonesia - Market size and forecast 2025-2030 ($ million)
Data Table on Indonesia - Market size and forecast 2025-2030 ($ million)
Chart on Indonesia - Year-over-year growth 2025-2030 (%)
Data Table on Indonesia - Year-over-year growth 2025-2030 (%)

12.4 North America - Market size and forecast 2025-2030

Chart on North America - Market size and forecast 2025-2030 ($ million)
Data Table on North America - Market size and forecast 2025-2030 ($ million)
Chart on North America - Year-over-year growth 2025-2030 (%)
Data Table on North America - Year-over-year growth 2025-2030 (%)
Chart on Regional Comparison - North America
Data Table on Regional Comparison - North America

12.4.1 US - Market size and forecast 2025-2030

Chart on US - Market size and forecast 2025-2030 ($ million)
Data Table on US - Market size and forecast 2025-2030 ($ million)
Chart on US - Year-over-year growth 2025-2030 (%)
Data Table on US - Year-over-year growth 2025-2030 (%)

12.4.2 Canada - Market size and forecast 2025-2030

Chart on Canada - Market size and forecast 2025-2030 ($ million)
Data Table on Canada - Market size and forecast 2025-2030 ($ million)
Chart on Canada - Year-over-year growth 2025-2030 (%)
Data Table on Canada - Year-over-year growth 2025-2030 (%)

12.4.3 Mexico - Market size and forecast 2025-2030

Chart on Mexico - Market size and forecast 2025-2030 ($ million)
Data Table on Mexico - Market size and forecast 2025-2030 ($ million)
Chart on Mexico - Year-over-year growth 2025-2030 (%)
Data Table on Mexico - Year-over-year growth 2025-2030 (%)

12.5 Europe - Market size and forecast 2025-2030

Chart on Europe - Market size and forecast 2025-2030 ($ million)
Data Table on Europe - Market size and forecast 2025-2030 ($ million)
Chart on Europe - Year-over-year growth 2025-2030 (%)
Data Table on Europe - Year-over-year growth 2025-2030 (%)
Chart on Regional Comparison - Europe
Data Table on Regional Comparison - Europe

12.5.1 Germany - Market size and forecast 2025-2030

Chart on Germany - Market size and forecast 2025-2030 ($ million)
Data Table on Germany - Market size and forecast 2025-2030 ($ million)
Chart on Germany - Year-over-year growth 2025-2030 (%)
Data Table on Germany - Year-over-year growth 2025-2030 (%)

12.5.2 UK - Market size and forecast 2025-2030

Chart on UK - Market size and forecast 2025-2030 ($ million)
Data Table on UK - Market size and forecast 2025-2030 ($ million)
Chart on UK - Year-over-year growth 2025-2030 (%)
Data Table on UK - Year-over-year growth 2025-2030 (%)

12.5.3 France - Market size and forecast 2025-2030

Chart on France - Market size and forecast 2025-2030 ($ million)
Data Table on France - Market size and forecast 2025-2030 ($ million)
Chart on France - Year-over-year growth 2025-2030 (%)
Data Table on France - Year-over-year growth 2025-2030 (%)

12.5.4 Italy - Market size and forecast 2025-2030

Chart on Italy - Market size and forecast 2025-2030 ($ million)
Data Table on Italy - Market size and forecast 2025-2030 ($ million)
Chart on Italy - Year-over-year growth 2025-2030 (%)
Data Table on Italy - Year-over-year growth 2025-2030 (%)

12.5.5 Spain - Market size and forecast 2025-2030

Chart on Spain - Market size and forecast 2025-2030 ($ million)
Data Table on Spain - Market size and forecast 2025-2030 ($ million)
Chart on Spain - Year-over-year growth 2025-2030 (%)
Data Table on Spain - Year-over-year growth 2025-2030 (%)

12.5.6 The Netherlands - Market size and forecast 2025-2030

Chart on The Netherlands - Market size and forecast 2025-2030 ($ million)
Data Table on The Netherlands - Market size and forecast 2025-2030 ($ million)
Chart on The Netherlands - Year-over-year growth 2025-2030 (%)
Data Table on The Netherlands - Year-over-year growth 2025-2030 (%)

12.6 South America - Market size and forecast 2025-2030

Chart on South America - Market size and forecast 2025-2030 ($ million)
Data Table on South America - Market size and forecast 2025-2030 ($ million)
Chart on South America - Year-over-year growth 2025-2030 (%)
Data Table on South America - Year-over-year growth 2025-2030 (%)
Chart on Regional Comparison - South America
Data Table on Regional Comparison - South America

12.6.1 Brazil - Market size and forecast 2025-2030

Chart on Brazil - Market size and forecast 2025-2030 ($ million)
Data Table on Brazil - Market size and forecast 2025-2030 ($ million)
Chart on Brazil - Year-over-year growth 2025-2030 (%)
Data Table on Brazil - Year-over-year growth 2025-2030 (%)

12.6.2 Argentina - Market size and forecast 2025-2030

Chart on Argentina - Market size and forecast 2025-2030 ($ million)
Data Table on Argentina - Market size and forecast 2025-2030 ($ million)
Chart on Argentina - Year-over-year growth 2025-2030 (%)
Data Table on Argentina - Year-over-year growth 2025-2030 (%)

12.6.3 Chile - Market size and forecast 2025-2030

Chart on Chile - Market size and forecast 2025-2030 ($ million)
Data Table on Chile - Market size and forecast 2025-2030 ($ million)
Chart on Chile - Year-over-year growth 2025-2030 (%)
Data Table on Chile - Year-over-year growth 2025-2030 (%)

12.7 Middle East and Africa - Market size and forecast 2025-2030

Chart on Middle East and Africa - Market size and forecast 2025-2030 ($ million)
Data Table on Middle East and Africa - Market size and forecast 2025-2030 ($ million)
Chart on Middle East and Africa - Year-over-year growth 2025-2030 (%)
Data Table on Middle East and Africa - Year-over-year growth 2025-2030 (%)
Chart on Regional Comparison - Middle East and Africa
Data Table on Regional Comparison - Middle East and Africa

12.7.1 Saudi Arabia - Market size and forecast 2025-2030

Chart on Saudi Arabia - Market size and forecast 2025-2030 ($ million)
Data Table on Saudi Arabia - Market size and forecast 2025-2030 ($ million)
Chart on Saudi Arabia - Year-over-year growth 2025-2030 (%)
Data Table on Saudi Arabia - Year-over-year growth 2025-2030 (%)

12.7.2 Turkey - Market size and forecast 2025-2030

Chart on Turkey - Market size and forecast 2025-2030 ($ million)
Data Table on Turkey - Market size and forecast 2025-2030 ($ million)
Chart on Turkey - Year-over-year growth 2025-2030 (%)
Data Table on Turkey - Year-over-year growth 2025-2030 (%)

12.7.3 UAE - Market size and forecast 2025-2030

Chart on UAE - Market size and forecast 2025-2030 ($ million)
Data Table on UAE - Market size and forecast 2025-2030 ($ million)
Chart on UAE - Year-over-year growth 2025-2030 (%)
Data Table on UAE - Year-over-year growth 2025-2030 (%)

12.7.4 South Africa - Market size and forecast 2025-2030

Chart on South Africa - Market size and forecast 2025-2030 ($ million)
Data Table on South Africa - Market size and forecast 2025-2030 ($ million)
Chart on South Africa - Year-over-year growth 2025-2030 (%)
Data Table on South Africa - Year-over-year growth 2025-2030 (%)

12.7.5 Israel - Market size and forecast 2025-2030

Chart on Israel - Market size and forecast 2025-2030 ($ million)
Data Table on Israel - Market size and forecast 2025-2030 ($ million)
Chart on Israel - Year-over-year growth 2025-2030 (%)
Data Table on Israel - Year-over-year growth 2025-2030 (%)

12.8 Market opportunity by geography

Market opportunity by geography ($ million)
Data Tables on Market opportunity by geography ($ million)

13. Drivers, Challenges, and Opportunity

13.1 Market drivers

Vehicle lightweighting and strict emission regulations
Crash safety demands and structural integrity
Electric vehicle range extension and battery protection

13.2 Market challenges

High capital investment and tooling costs
Complex joining and manufacturing yield bottlenecks
Raw material volatility and supply constraints

13.3 Impact of drivers and challenges

Impact of drivers and challenges in 2025 and 2030

13.4 Market opportunities

Commercialization of third generation steel grades
Integration of decarbonized and fossil-free production
Digital simulation and AI optimization

14. Competitive Landscape

14.1 Overview

14.2

Overview on criticality of inputs and factors of differentiation

14.3 Landscape disruption

Overview on factors of disruption

14.4 Industry risks

Impact of key risks on business

15. Competitive Analysis

15.1 Companies profiled

Companies covered

15.2 Company ranking index

15.3 Market positioning of companies

Matrix on companies position and classification

15.4 ArcelorMittal S.A.

ArcelorMittal S.A. - Overview
ArcelorMittal S.A. - Business segments
ArcelorMittal S.A. - Key offerings
ArcelorMittal S.A. - Segment focus
SWOT

15.5 Baosteel Co. Ltd.

Baosteel Co. Ltd. - Overview
Baosteel Co. Ltd. - Product / Service
Baosteel Co. Ltd. - Key offerings
SWOT

15.6 China Steel Corp.

China Steel Corp. - Overview
China Steel Corp. - Business segments
China Steel Corp. - Key offerings
China Steel Corp. - Segment focus
SWOT

15.7 Hyundai Steel Co.

Hyundai Steel Co. - Overview
Hyundai Steel Co. - Product / Service
Hyundai Steel Co. - Key offerings
SWOT

15.8 JSW Steel Ltd.

JSW Steel Ltd. - Overview
JSW Steel Ltd. - Product / Service
JSW Steel Ltd. - Key offerings
SWOT

15.9 Kobe Steel Ltd.

Kobe Steel Ltd. - Overview
Kobe Steel Ltd. - Business segments
Kobe Steel Ltd. - Key offerings
Kobe Steel Ltd. - Segment focus
SWOT

15.10 Nippon Steel Corp.

Nippon Steel Corp. - Overview
Nippon Steel Corp. - Business segments
Nippon Steel Corp. - Key offerings
Nippon Steel Corp. - Segment focus
SWOT

15.11 NLMK Group

NLMK Group - Overview
NLMK Group - Product / Service
NLMK Group - Key offerings
SWOT

15.12 Nucor Corp.

Nucor Corp. - Overview
Nucor Corp. - Business segments
Nucor Corp. - Key news
Nucor Corp. - Key offerings
Nucor Corp. - Segment focus
SWOT

15.13 POSCO Co. Ltd.

POSCO Co. Ltd. - Overview
POSCO Co. Ltd. - Business segments
POSCO Co. Ltd. - Key news
POSCO Co. Ltd. - Key offerings
POSCO Co. Ltd. - Segment focus
SWOT

15.14 SSAB AB

SSAB AB - Overview
SSAB AB - Business segments
SSAB AB - Key offerings
SSAB AB - Segment focus
SWOT

15.15 Steel Dynamics Inc.

Steel Dynamics Inc. - Overview
Steel Dynamics Inc. - Product / Service
Steel Dynamics Inc. - Key offerings
SWOT

15.16 Tata Steel Ltd.

Tata Steel Ltd. - Overview
Tata Steel Ltd. - Business segments
Tata Steel Ltd. - Key offerings
Tata Steel Ltd. - Segment focus
SWOT

15.17 Ternium S.A.

Ternium S.A. - Overview
Ternium S.A. - Product / Service
Ternium S.A. - Key offerings
SWOT

15.18 United States Steel Corp.

United States Steel Corp. - Overview
United States Steel Corp. - Business segments
United States Steel Corp. - Key offerings
United States Steel Corp. - Segment focus
SWOT

16. Appendix

16.1 Scope of the report

Market definition
Objectives
Notes and caveats

16.2 Inclusions and exclusions checklist

Inclusions checklist
Exclusions checklist

16.3 Currency conversion rates for US$

16.4 Research methodology

16.5 Data procurement

Information sources

16.6 Data validation

16.7 Validation techniques employed for market sizing

16.8 Data synthesis

16.9 360 degree market analysis

16.10 List of abbreviations

Research Methodology

Technavio presents a detailed picture of the market by way of study, synthesis, and summation of data from multiple sources. The analysts have presented the various facets of the market with a particular focus on identifying the key industry influencers. The data thus presented is comprehensive, reliable, and the result of extensive research, both primary and secondary.

INFORMATION SOURCES

Primary sources

  • Manufacturers and suppliers
  • Channel partners
  • Industry experts
  • Strategic decision makers

Secondary sources

  • Industry journals and periodicals
  • Government data
  • Financial reports of key industry players
  • Historical data
  • Press releases

DATA ANALYSIS

Data Synthesis

  • Collation of data
  • Estimation of key figures
  • Analysis of derived insights

Data Validation

  • Triangulation with data models
  • Reference against proprietary databases
  • Corroboration with industry experts

REPORT WRITING

Qualitative

  • Market drivers
  • Market challenges
  • Market trends
  • Five forces analysis

Quantitative

  • Market size and forecast
  • Market segmentation
  • Geographical insights
  • Competitive landscape

Interested in this report?

Get your sample now to see our research methodology and insights!

Download Now

Frequently Asked Questions

Advanced High Strength Steel market growth will increase by USD 22390.5 million during 2026-2030.

The Advanced High Strength Steel market is expected to grow at a CAGR of 13.2% during 2026-2030.

Advanced High Strength Steel market is segmented by Grade type (Dual phase, Complex phase, Transformation-induced plasticity, Others) End-user (Automobile, Construction, Aviation and marine, Others) Product type (Sheets, Coils, Plates, Others)

Ansteel Group Corp., ArcelorMittal S.A., Baosteel Co. Ltd., China Steel Corp., Cleveland Cliffs Inc., Companhia Siderurgica Nacional, Hyundai Steel Co., JSW Steel Ltd., Kobe Steel Ltd., Nippon Steel Corp., NLMK Group, Nucor Corp., PAO Severstal, POSCO Co. Ltd., Salzgitter AG, SSAB AB, Steel Dynamics Inc., Tata Steel Ltd., Ternium S.A., United States Steel Corp. are a few of the key vendors in the Advanced High Strength Steel market.

APAC will register the highest growth rate of 47.6% among the other regions. Therefore, the Advanced High Strength Steel market in APAC is expected to garner significant business opportunities for the vendors during the forecast period.

China, Japan, India, South Korea, Australia, Indonesia, US, Canada, Mexico, Germany, UK, France, Italy, Spain, The Netherlands, Brazil, Argentina, Chile, Saudi Arabia, Turkey, UAE, South Africa, Israel

  • Vehicle lightweighting and strict emission regulations is the driving factor this market.

The Advanced High Strength Steel market vendors should focus on grabbing business opportunities from the Grade type segment as it accounted for the largest market share in the base year.
RIA - Research AI Assistant
Ask RIA
