AI In Dentistry Market Analysis, Size, and Forecast 2026-2030: North America (US, Canada, and Mexico), Europe (Germany, UK, and France), Asia (China, Japan, and India), South America (Brazil), Middle East and Africa (Turkey, South Africa, and UAE), Rest of World (ROW)

AI In Dentistry Market Analysis, Size, and Forecast 2026-2030:
North America (US, Canada, and Mexico), Europe (Germany, UK, and France), Asia (China, Japan, and India), South America (Brazil), Middle East and Africa (Turkey, South Africa, and UAE), Rest of World (ROW)

Published: Oct 2026 295 Pages SKU: IRTNTR81685

Market Overview at a Glance

$904.52 Mn
Market Opportunity
21%
CAGR 2025 - 2030
34.6%
North America Growth
$256.50 Mn
Software segment 2024

Ai In Dentistry Market Size 2026-2030

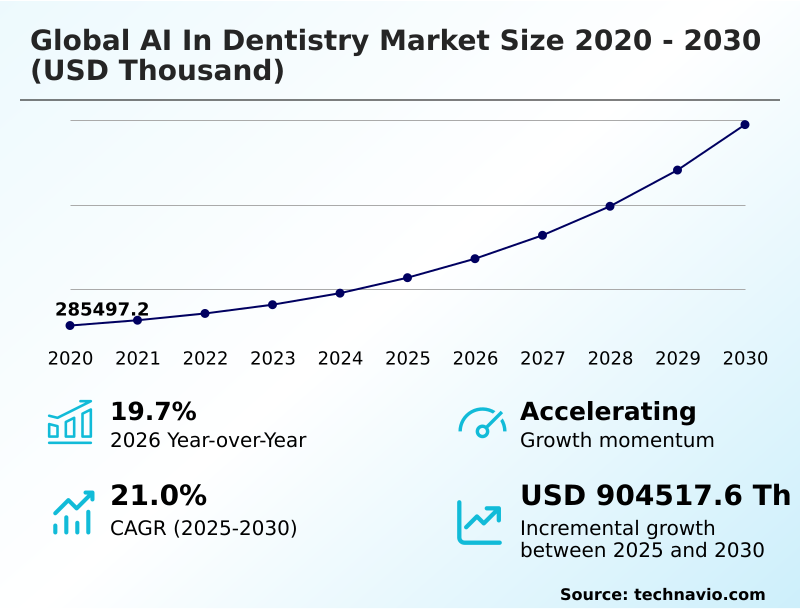
The ai in dentistry market size is valued to increase by USD 904.52 million, at a CAGR of 21% from 2025 to 2030. Surging demand for precision diagnostics and early pathological detection will drive the ai in dentistry market.

Major Market Trends & Insights

  • North America dominated the market and accounted for a 34.6% growth during the forecast period.
  • By Component - Software segment was valued at USD 256.50 million in 2024
  • By End-user - Dental clinics segment accounted for the largest market revenue share in 2024

Market Size & Forecast

  • Market Opportunities:
  • Market Future Opportunities: USD 904.52 million
  • CAGR from 2025 to 2030 : 21%

Market Summary

  • The AI In Dentistry Market demonstrates accelerating expansion as dental service organizations and independent clinics transition toward data-driven clinical workflows. Driven by the critical need for precision diagnostics, practices are heavily investing in algorithmic diagnostic software that acts as an automated second opinion during routine oral examinations.
  • For example, large corporate dental networks utilizing centralized diagnostic tracking report a 22% improvement in treatment plan acceptance rates due to highly objective patient communication visuals. This operational shift reduces diagnostic variability and streamlines revenue cycle operations across multi-location facilities.
  • However, high capital requirements and interoperability hurdles with legacy on-premise servers present formidable challenges for smaller independent practices attempting digital modernization. The necessity to adhere strictly to healthcare data privacy regulations further complicates rapid deployment. Despite these structural challenges, the continuous demand for operational efficiency and proactive preventive care management forces clinical directors to prioritize scalable technological investments.
  • As smart diagnostic integrations become an industry standard, oral healthcare providers leverage these intelligent tools to maximize chairside efficiency and elevate long-term patient outcomes.

What will be the Size of the Ai In Dentistry Market during the forecast period?
Get Key Insights on Market Forecast (PDF) Get Free Sample

How is the Ai In Dentistry Market Segmented?

The ai in dentistry industry research report provides comprehensive data (region-wise segment analysis), with forecasts and estimates in "USD thousand" for the period 2026-2030, as well as historical data from 2020-2024 for the following segments.

  • Component
    • Software
    • Hardware
    • Services
  • End-user
    • Dental clinics
    • Hospitals and dental centers
    • Dental laboratories
    • Academic and research institutes
  • Application
    • Diagnosis and imaging
    • Treatment planning
    • Practice management
  • Geography
    • North America
      • US
      • Canada
      • Mexico
    • Europe
      • Germany
      • UK
      • France
      • Italy
      • The Netherlands
      • Spain
    • Asia
      • China
      • Japan
      • India
      • South Korea
      • Indonesia
      • Thailand
      • Singapore
    • Rest of World (ROW)

By Component Insights

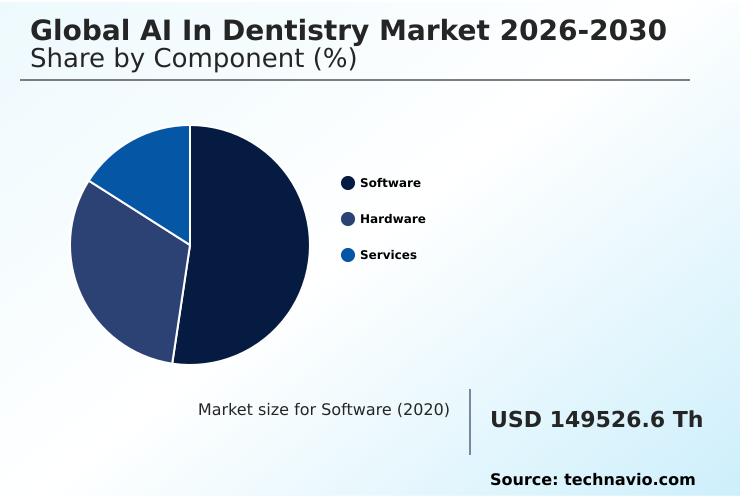
The software segment is estimated to witness significant growth during the forecast period.

The software category dictates operational and clinical modernization within the AI In Dentistry Market through advanced algorithms. Facilities transition from localized installations to sophisticated software formats, facilitating real-time updates and seamless remote diagnostics.

These deep learning models directly analyze imaging, accelerating diagnostic workflows and reducing clinical subjectivity. Integration with predictive analytics engines allows clinics to assess longitudinal clinical histories and optimize preventive care management effectively.

By automating routine documentation via natural language processing and deploying smart patient scheduling, practitioners reclaim valuable clinical hours. This seamless algorithmic output interpretation reduces false-positive pathology detections by up to 18%, significantly lowering unnecessary interventional costs.

Dental practices utilizing cloud based analytics see accelerated automated insurance claim review processes, transforming clinical software into a core asset that boosts revenue cycle operations.
Get Free Sample

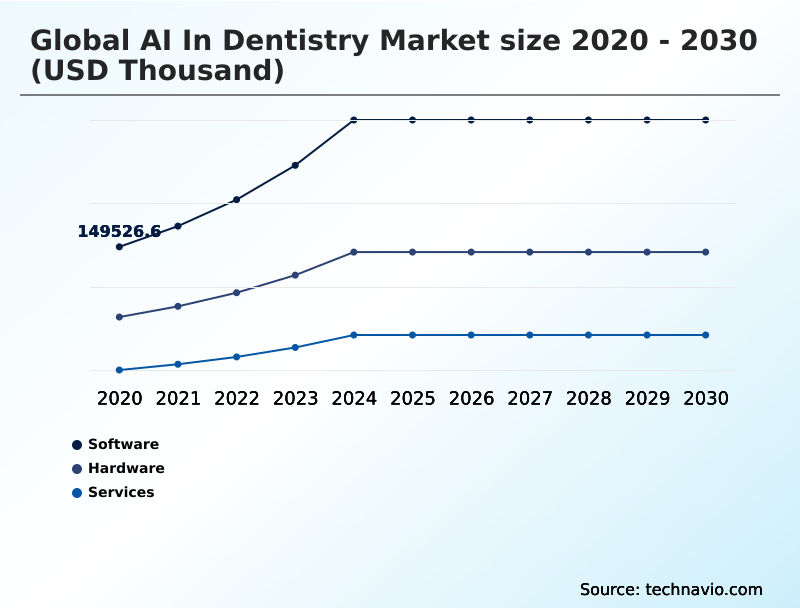
The Software segment was valued at USD 256.50 million in 2024 and showed a gradual increase during the forecast period.
Get Free Sample

Regional Analysis

North America is estimated to contribute 34.6% to the growth of the global market during the forecast period.Technavio’s analysts have elaborately explained the regional trends and drivers that shape the market during the forecast period.
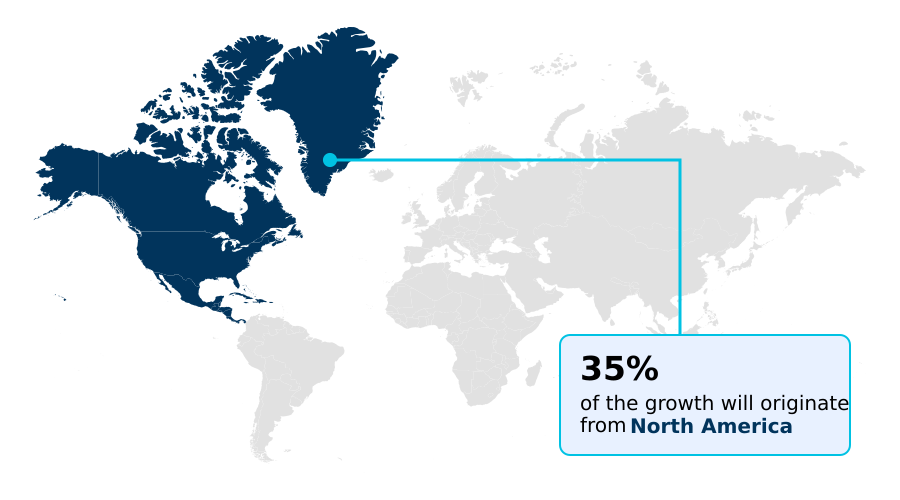
See How Ai In Dentistry Market Demand is Rising in North America Get Free Sample

Regional adoption dynamics within the AI In Dentistry Market highlight a stark contrast between established digital ecosystems and emerging clinical frameworks.

North America maintains a distinct operational advantage, with massive dental service organizations deploying advanced computer vision algorithms to achieve a 30% faster administrative turnaround compared to standalone European clinics.

The rigid compliance environment in Europe necessitates highly secure cloud data management, slowing initial deployment but yielding a 12% reduction in diagnostic compliance errors long-term. Meanwhile, facilities in APAC are accelerating teledentistry adoption to overcome specialist shortages in rural territories.

North American practices effectively utilize automated caries detection to decrease missed pathology rates by 18%, prioritizing high-volume efficiency. Conversely, European academic centers focus on radiographic image analysis and 3d anatomical segmentation to enhance prosthodontic fabrications and complex maxillofacial trauma evaluation.

Furthermore, the integration of cephalometric tracing algorithms is rapidly standardizing orthodontic assessments across all major geographic regions.

Market Dynamics

Our researchers analyzed the data with 2025 as the base year, along with the key drivers, trends, and challenges. A holistic analysis of drivers will help companies refine their marketing strategies to gain a competitive advantage.

  • The modernization of clinical oral health facilities is fundamentally altering diagnostic and administrative workflows across the AI In Dentistry Market. As dental organizations expand, the integration of ai driven intraoral scanner integration has become a crucial operational mandate, reducing manual impression errors and accelerating the fabrication of custom prosthetics.
  • Concurrently, automated caries detection deep learning protocols provide practitioners with highly objective analytical support, identifying sub-surface demineralization with a 15% higher detection rate compared to traditional visual examinations. This precision directly influences preventive intervention strategies and reduces long-term restorative costs.
  • Furthermore, the shift toward proactive clinical management is heavily supported by predictive analytics in periodontal care, allowing specialists to forecast alveolar bone degradation and optimize patient recall schedules effectively. To manage the vast influx of digital imaging and patient data, corporate networks are heavily adopting cloud based dental practice management solutions.
  • This architectural transition eliminates data silos, improves multi-site clinical standardization, and enhances overall revenue cycle efficiency. In the highly competitive cosmetic sector, ai powered clear aligner planning streamlines orthodontic workflows by simulating complex tooth movements with remarkable biomechanical accuracy.
  • These integrated digital tools collectively drive a 20% improvement in operational throughput, enabling modern dental enterprises to scale efficiently while elevating the overarching standard of patient care.
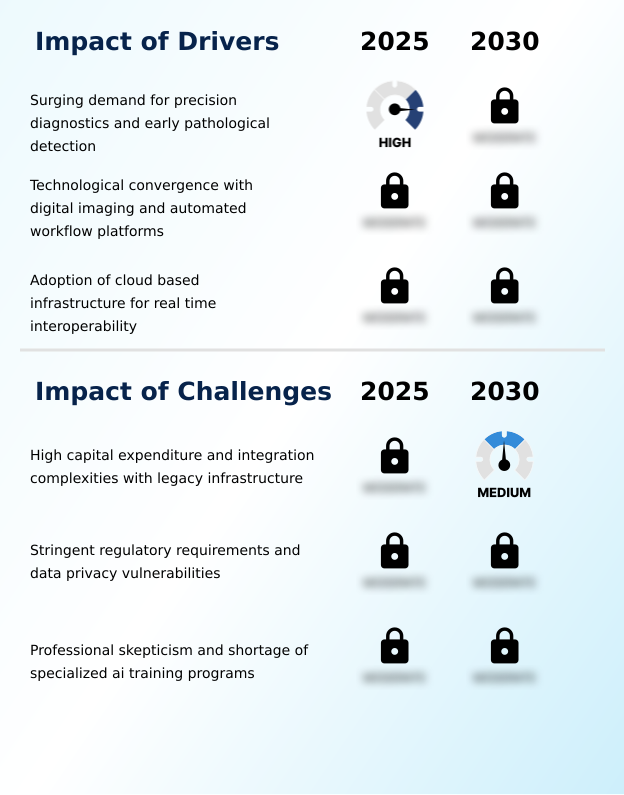
What are the key market drivers leading to the rise in the adoption of Ai In Dentistry Industry?

  • A surging demand for precision diagnostics and the early detection of oral pathologies serves as a primary catalyst accelerating widespread technological adoption across the clinical landscape.

  • A surging demand for objective precision serves as a primary catalyst expanding the AI In Dentistry Market. Human interpretation of radiographs is inherently susceptible to cognitive fatigue, prompting practices to adopt automated pathology detection systems.
  • By implementing these sophisticated tools for diagnostic accuracy improvement, clinical networks have lowered false-negative rates by 18%, capturing early-stage degradation reliably. Additionally, the integration of automated secondary opinions directly into electronic dental records minimizes administrative charting burdens.
  • Modern intraoral scanning software vastly enhances digital impression quality, which allows front-office teams to streamline operations and drive a 15% reduction in overhead costs.
  • As clinics prioritize workflow bottleneck reduction, they rapidly deploy ai powered remote monitoring to oversee patient progress continuously. The utilization of automated margin detection ensures exceptional restorative fit, making these technologies essential for maintaining clinical consistency monitoring across high-volume facilities.

What are the market trends shaping the Ai In Dentistry Industry?

  • The integration of generative artificial intelligence into patient communication and treatment protocols represents a defining trend within the industry. This technological advancement significantly enhances clinical transparency and improves patient understanding of complex therapeutic procedures.

  • The continuous evolution of generative visualization features is radically transforming patient engagement protocols across the AI In Dentistry Market. Clinical facilities are rapidly integrating these advanced tools to translate complex diagnostic heat maps into intuitive patient communication visuals. This enhanced transparency directly addresses patient skepticism, leading to a 28% increase in treatment plan acceptance for elective restorative procedures.
  • Furthermore, the adoption of automated root canal morphology analysis allows endodontic specialists to navigate internal anatomies precisely. By optimizing automated treatment planning, specialized dental centers have reduced surgical preparation durations by 35%. This technological shift fundamentally alters how clinicians approach case presentation, utilizing clear aligner therapy sequences and orthodontic realignment simulation to drive predictable outcomes.
  • Consequently, digital dentistry workflows are becoming highly standardized, empowering corporate networks to master restorative margin design and achieve a 20% improvement in clinical conversion metrics while fostering long-term patient trust.

What challenges does the Ai In Dentistry Industry face during its growth?

  • Substantial initial capital expenditure requirements combined with the complexities of integrating modern algorithms into legacy clinical infrastructure pose significant barriers to widespread industry expansion.

  • Severe structural constraints and substantial capital requirements act as prominent barriers within the AI In Dentistry Market. Many independent clinics operate on legacy systems that lack the frameworks necessary for seamless cloud based infrastructure integration, impeding real time interoperability.
  • This technological friction forces clinical staff to manually transfer patient data, inadvertently increasing administrative processing time by up to 20% during initial algorithmic diagnostic software onboarding. Furthermore, deploying advanced convolutional neural networks for accurate cbct scanning optimization demands robust, high-cost computing hardware. Consequently, resource-constrained practices experience a 15% delay in technology deployment schedules.
  • This financial hurdle stalls the broader democratization of intelligent chairside decision support, significantly limiting the capacity of smaller facilities to implement advanced periodontal bone loss tracking and specialized geriatric oral health interventions across diverse patient demographics.

Exclusive Technavio Analysis on Customer Landscape

The ai in dentistry market forecasting report includes the adoption lifecycle of the market, covering from the innovator’s stage to the laggard’s stage. It focuses on adoption rates in different regions based on penetration. Furthermore, the ai in dentistry market report also includes key purchase criteria and drivers of price sensitivity to help companies evaluate and develop their market growth analysis strategies.
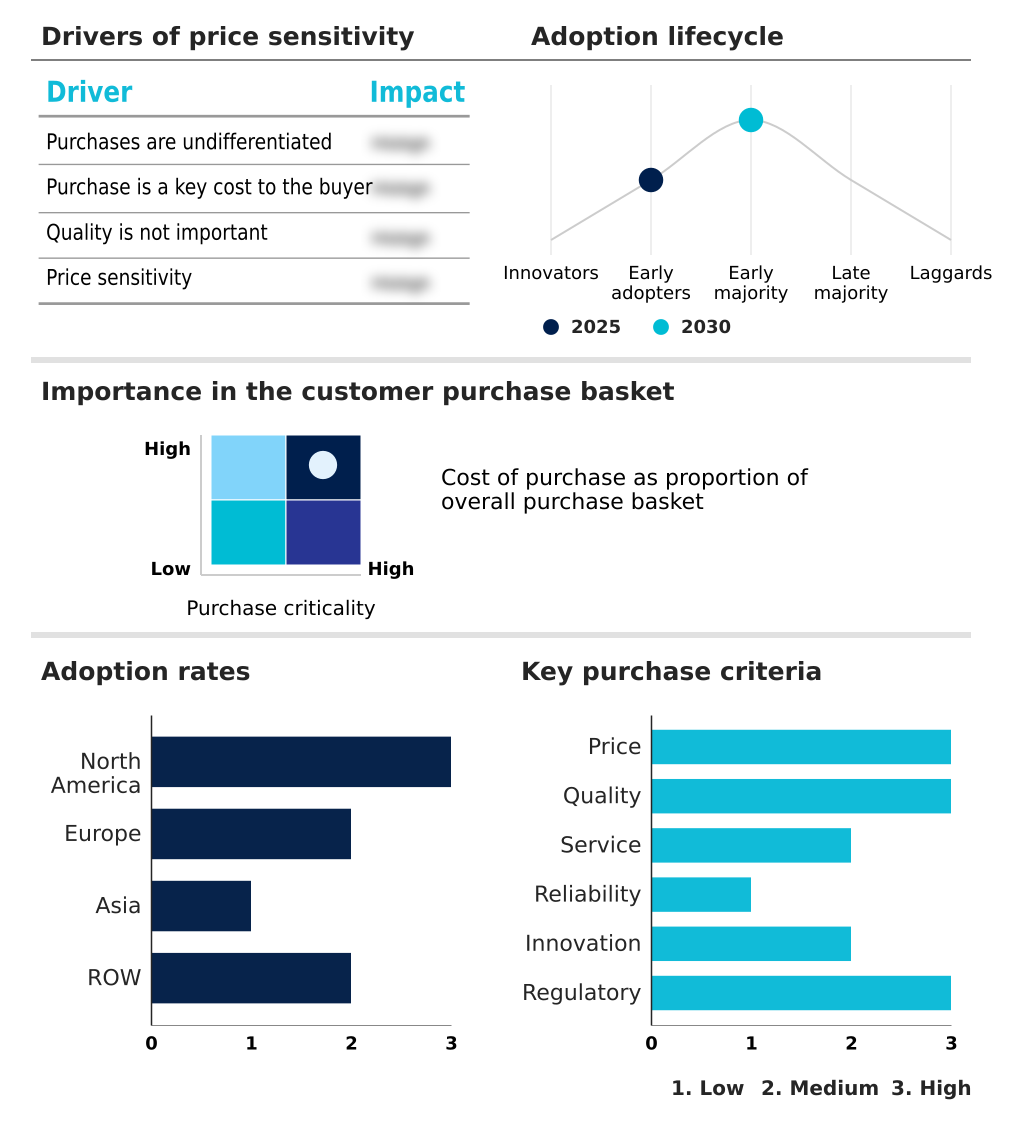
Customer Landscape of Ai In Dentistry Industry

Competitive Landscape

Companies are implementing various strategies, such as strategic alliances, ai in dentistry market forecast, partnerships, mergers and acquisitions, geographical expansion, and product/service launches, to enhance their presence in the industry.

3Shape AS - Provides advanced algorithmic solutions including intelligent intraoral scanning workflows and digital diagnostic systems that optimize clinical treatment planning and enhance restorative accuracy for modern dental professionals.

The industry research and growth report includes detailed analyses of the competitive landscape of the market and information about key companies, including:

  • 3Shape AS
  • Align Technology Inc.
  • Carestream Dental LLC
  • Dental Monitoring SAS
  • Dentsply Sirona Inc.
  • DGNCT LLC
  • Envista Holdings Corp.
  • Formlabs Inc.
  • Imagoworks Inc.
  • Institut Straumann AG
  • Medit Corp.
  • Orca Dental AI Ltd.
  • Overjet Inc.
  • Pearl Inc.
  • Planet DDS Inc.
  • Planmeca Oy
  • Promaton
  • Relu BV
  • SoftSmile Inc.
  • VideaHealth

Qualitative and quantitative analysis of companies has been conducted to help clients understand the wider business environment as well as the strengths and weaknesses of key industry players. Data is qualitatively analyzed to categorize companies as pure play, category-focused, industry-focused, and diversified; it is quantitatively analyzed to categorize companies as dominant, leading, strong, tentative, and weak.

Recent Development and News in Ai in dentistry market

  • In the Health Care Technology industry, the rapid standardization of interoperability protocols such as HL7 FHIR has enabled seamless data exchange across electronic health record systems, directly impacting AI In Dentistry demand by allowing intelligent diagnostic platforms to integrate effortlessly with existing clinical infrastructure.
  • The widespread transition toward cloud native edge computing architectures across medical imaging sectors has reduced processing latency for high resolution 3D scans by over 40%, accelerating the adoption of real time chairside decision support tools in modern oral healthcare facilities.
  • Stringent enforcement of international data privacy frameworks like the General Data Protection Regulation has driven substantial investments in secure cloud data management, creating a compliance-driven demand surge for encrypted algorithmic diagnostic software in dental practices.
  • The increasing consolidation of independent medical facilities into large scale corporate healthcare networks has necessitated centralized clinical consistency monitoring, fueling the procurement of enterprise grade automated secondary opinions and diagnostic tracking platforms.

Dive into Technavio’s robust research methodology, blending expert interviews, extensive data synthesis, and validated models for unparalleled Ai In Dentistry Market insights. See full methodology.

Market Scope
Page number 295
Base year 2025
Historic period 2020-2024
Forecast period 2026-2030
Growth momentum & CAGR Accelerate at a CAGR of 21%
Market growth 2026-2030 USD 904517.6 thousand
Market structure Fragmented
YoY growth 2025-2026(%) 19.7%
Key countries US, Canada, Mexico, Germany, UK, France, Italy, The Netherlands, Spain, Russia, China, Japan, India, South Korea, Indonesia, Thailand, Singapore, Australia, Brazil, Turkey, South Africa, UAE and Saudi Arabia
Competitive landscape Leading Companies, Market Positioning of Companies, Competitive Strategies, and Industry Risks

Request Free Sample

Research Analyst Overview

  • The operational landscape of the AI In Dentistry Market is experiencing a profound technological evolution as enterprise clinics integrate sophisticated computer vision algorithms directly into their diagnostic pipelines. This strategic shift towards algorithmic automation addresses critical workflow inefficiencies, enabling clinical directors to optimize resource allocation and standardize quality control.
  • By leveraging convolutional neural networks for radiographic image analysis, practices report a 25% reduction in diagnostic processing times, directly increasing daily patient throughput. Furthermore, the deployment of intelligent intraoral scanning software supports highly accurate prosthodontic and orthodontic planning, fundamentally altering procurement strategies as clinics prioritize fully interoperable digital ecosystems.
  • The continuous refinement of automated margin detection algorithms ensures exceptional restorative fit, thereby minimizing costly laboratory remakes. Simultaneously, integration of generative visualization features bridges the clinical communication gap, empowering patients to make informed financial decisions regarding their care.
  • As automated treatment planning becomes intrinsically linked to clinical compliance and revenue generation, healthcare administrators are systematically restructuring their capital expenditure models to prioritize intelligent diagnostic architectures over traditional analog equipment.

What are the Key Data Covered in this Ai In Dentistry Market Research and Growth Report?

  • What is the expected growth of the Ai In Dentistry Market between 2026 and 2030?

    • USD 904.52 million, at a CAGR of 21%

  • What segmentation does the market report cover?

    • The report is segmented by Component (Software, Hardware, and Services), End-user (Dental clinics, Hospitals and dental centers, Dental laboratories, and Academic and research institutes), Application (Diagnosis and imaging, Treatment planning, and Practice management) and Geography (North America, Europe, Asia, Rest of World (ROW))

  • Which regions are analyzed in the report?

    • North America, Europe, Asia and Rest of World (ROW)

  • What are the key growth drivers and market challenges?

    • Surging demand for precision diagnostics and early pathological detection, High capital expenditure and integration complexities with legacy infrastructure

  • Who are the major players in the Ai In Dentistry Market?

    • 3Shape AS, Align Technology Inc., Carestream Dental LLC, Dental Monitoring SAS, Dentsply Sirona Inc., DGNCT LLC, Envista Holdings Corp., Formlabs Inc., Imagoworks Inc., Institut Straumann AG, Medit Corp., Orca Dental AI Ltd., Overjet Inc., Pearl Inc., Planet DDS Inc., Planmeca Oy, Promaton, Relu BV, SoftSmile Inc. and VideaHealth

Market Research Insights

  • The AI In Dentistry Market is undergoing a rapid structural transformation as clinical facilities prioritize objective diagnostics and operational automation. By deploying automated secondary opinions, practitioners have reduced diagnostic variability by 15%, ensuring higher clinical consistency across patient populations.
  • The integration of intelligent algorithms into daily workflows accelerates administrative efficiency, allowing dental service organizations to handle 20% higher patient volumes without proportionally expanding support staff. Enhanced imaging simplifies complex radiograph interpretations, directly boosting treatment plan acceptance by up to 25% in cosmetic and restorative procedures. This strategic integration optimizes preventive care while standardizing digital protocols.

We can help! Our analysts can customize this ai in dentistry market research report to meet your requirements.

Get in touch

1. Executive Summary

1.1 Market overview

Executive Summary - Chart on Market Overview
Executive Summary - Data Table on Market Overview
Executive Summary - Chart on Global Market Characteristics
Executive Summary - Chart on Market by Geography
Executive Summary - Chart on Market Segmentation by Component
Executive Summary - Chart on Market Segmentation by End-user
Executive Summary - Chart on Market Segmentation by Application
Executive Summary - Chart on Incremental Growth
Executive Summary - Data Table on Incremental Growth
Executive Summary - Chart on Company Market Positioning

2. Technavio Analysis

2.1 Analysis of price sensitivity, lifecycle, customer purchase basket, adoption rates, and purchase criteria

2.2 Criticality of inputs and Factors of differentiation

Chart on Overview on criticality of inputs and factors of differentiation

2.3 Factors of disruption

Chart on Overview on factors of disruption

2.4 Impact of drivers and challenges

Chart on Impact of drivers and challenges in 2025 and 2030

3. Market Landscape

3.1 Market ecosystem

Chart on Parent Market
Data Table on - Parent Market

3.2 Market characteristics

Chart on Market characteristics analysis

3.3 Value chain analysis

Chart on Value chain analysis

4. Market Sizing

4.1 Market definition

Data Table on Offerings of companies included in the market definition

4.2 Market segment analysis

Market segments

4.3 Market size 2025

4.4 Market outlook: Forecast for 2025-2030

Chart on Global - Market size and forecast 2025-2030 ($ thousand)
Data Table on Global - Market size and forecast 2025-2030 ($ thousand)
Chart on Global Market: Year-over-year growth 2025-2030 (%)
Data Table on Global Market: Year-over-year growth 2025-2030 (%)

5. Historic Market Size

5.1 Global AI In Dentistry Market 2020 - 2024

Historic Market Size - Data Table on Global AI In Dentistry Market 2020 - 2024 ($ thousand)

5.2 Component segment analysis 2020 - 2024

Historic Market Size - Component Segment 2020 - 2024 ($ thousand)

5.3 End-user segment analysis 2020 - 2024

Historic Market Size - End-user Segment 2020 - 2024 ($ thousand)

5.4 Application segment analysis 2020 - 2024

Historic Market Size - Application Segment 2020 - 2024 ($ thousand)

5.5 Geography segment analysis 2020 - 2024

Historic Market Size - Geography Segment 2020 - 2024 ($ thousand)

5.6 Country segment analysis 2020 - 2024

Historic Market Size - Country Segment 2020 - 2024 ($ thousand)

6. Qualitative Analysis

6.1 Impact of Geopolitical Conflicts on Global AI in Dentistry Market

7. Five Forces Analysis

7.1 Five forces summary

Five forces analysis - Comparison between 2025 and 2030

7.2 Bargaining power of buyers

Bargaining power of buyers - Impact of key factors 2025 and 2030

7.3 Bargaining power of suppliers

Bargaining power of suppliers - Impact of key factors in 2025 and 2030

7.4 Threat of new entrants

Threat of new entrants - Impact of key factors in 2025 and 2030

7.5 Threat of substitutes

Threat of substitutes - Impact of key factors in 2025 and 2030

7.6 Threat of rivalry

Threat of rivalry - Impact of key factors in 2025 and 2030

7.7 Market condition

Chart on Market condition - Five forces 2025 and 2030

8. Market Segmentation by Component

8.1 Market segments

Chart on Component - Market share 2025-2030 (%)
Data Table on Component - Market share 2025-2030 (%)

8.2 Comparison by Component

Chart on Comparison by Component
Data Table on Comparison by Component

8.3 Software - Market size and forecast 2025-2030

Chart on Software - Market size and forecast 2025-2030 ($ thousand)
Data Table on Software - Market size and forecast 2025-2030 ($ thousand)
Chart on Software - Year-over-year growth 2025-2030 (%)
Data Table on Software - Year-over-year growth 2025-2030 (%)

8.4 Hardware - Market size and forecast 2025-2030

Chart on Hardware - Market size and forecast 2025-2030 ($ thousand)
Data Table on Hardware - Market size and forecast 2025-2030 ($ thousand)
Chart on Hardware - Year-over-year growth 2025-2030 (%)
Data Table on Hardware - Year-over-year growth 2025-2030 (%)

8.5 Services - Market size and forecast 2025-2030

Chart on Services - Market size and forecast 2025-2030 ($ thousand)
Data Table on Services - Market size and forecast 2025-2030 ($ thousand)
Chart on Services - Year-over-year growth 2025-2030 (%)
Data Table on Services - Year-over-year growth 2025-2030 (%)

8.6 Market opportunity by Component

Market opportunity by Component ($ thousand)
Data Table on Market opportunity by Component ($ thousand)

9. Market Segmentation by End-user

9.1 Market segments

Chart on End-user - Market share 2025-2030 (%)
Data Table on End-user - Market share 2025-2030 (%)

9.2 Comparison by End-user

Chart on Comparison by End-user
Data Table on Comparison by End-user

9.3 Dental clinics - Market size and forecast 2025-2030

Chart on Dental clinics - Market size and forecast 2025-2030 ($ thousand)
Data Table on Dental clinics - Market size and forecast 2025-2030 ($ thousand)
Chart on Dental clinics - Year-over-year growth 2025-2030 (%)
Data Table on Dental clinics - Year-over-year growth 2025-2030 (%)

9.4 Hospitals and dental centers - Market size and forecast 2025-2030

Chart on Hospitals and dental centers - Market size and forecast 2025-2030 ($ thousand)
Data Table on Hospitals and dental centers - Market size and forecast 2025-2030 ($ thousand)
Chart on Hospitals and dental centers - Year-over-year growth 2025-2030 (%)
Data Table on Hospitals and dental centers - Year-over-year growth 2025-2030 (%)

9.5 Dental laboratories - Market size and forecast 2025-2030

Chart on Dental laboratories - Market size and forecast 2025-2030 ($ thousand)
Data Table on Dental laboratories - Market size and forecast 2025-2030 ($ thousand)
Chart on Dental laboratories - Year-over-year growth 2025-2030 (%)
Data Table on Dental laboratories - Year-over-year growth 2025-2030 (%)

9.6 Academic and research institutes - Market size and forecast 2025-2030

Chart on Academic and research institutes - Market size and forecast 2025-2030 ($ thousand)
Data Table on Academic and research institutes - Market size and forecast 2025-2030 ($ thousand)
Chart on Academic and research institutes - Year-over-year growth 2025-2030 (%)
Data Table on Academic and research institutes - Year-over-year growth 2025-2030 (%)

9.7 Market opportunity by End-user

Market opportunity by End-user ($ thousand)
Data Table on Market opportunity by End-user ($ thousand)

10. Market Segmentation by Application

10.1 Market segments

Chart on Application - Market share 2025-2030 (%)
Data Table on Application - Market share 2025-2030 (%)

10.2 Comparison by Application

Chart on Comparison by Application
Data Table on Comparison by Application

10.3 Diagnosis and imaging - Market size and forecast 2025-2030

Chart on Diagnosis and imaging - Market size and forecast 2025-2030 ($ thousand)
Data Table on Diagnosis and imaging - Market size and forecast 2025-2030 ($ thousand)
Chart on Diagnosis and imaging - Year-over-year growth 2025-2030 (%)
Data Table on Diagnosis and imaging - Year-over-year growth 2025-2030 (%)

10.4 Treatment planning - Market size and forecast 2025-2030

Chart on Treatment planning - Market size and forecast 2025-2030 ($ thousand)
Data Table on Treatment planning - Market size and forecast 2025-2030 ($ thousand)
Chart on Treatment planning - Year-over-year growth 2025-2030 (%)
Data Table on Treatment planning - Year-over-year growth 2025-2030 (%)

10.5 Practice management - Market size and forecast 2025-2030

Chart on Practice management - Market size and forecast 2025-2030 ($ thousand)
Data Table on Practice management - Market size and forecast 2025-2030 ($ thousand)
Chart on Practice management - Year-over-year growth 2025-2030 (%)
Data Table on Practice management - Year-over-year growth 2025-2030 (%)

10.6 Market opportunity by Application

Market opportunity by Application ($ thousand)
Data Table on Market opportunity by Application ($ thousand)

11. Customer Landscape

11.1 Customer landscape overview

Analysis of price sensitivity, lifecycle, customer purchase basket, adoption rates, and purchase criteria

12. Geographic Landscape

12.1 Geographic segmentation

Chart on Market share by geography 2025-2030 (%)
Data Table on Market share by geography 2025-2030 (%)

12.2 Geographic comparison

Chart on Geographic comparison
Data Table on Geographic comparison

12.3 North America - Market size and forecast 2025-2030

Chart on North America - Market size and forecast 2025-2030 ($ thousand)
Data Table on North America - Market size and forecast 2025-2030 ($ thousand)
Chart on North America - Year-over-year growth 2025-2030 (%)
Data Table on North America - Year-over-year growth 2025-2030 (%)
Chart on Regional Comparison - North America
Data Table on Regional Comparison - North America

12.3.1 US - Market size and forecast 2025-2030

Chart on US - Market size and forecast 2025-2030 ($ thousand)
Data Table on US - Market size and forecast 2025-2030 ($ thousand)
Chart on US - Year-over-year growth 2025-2030 (%)
Data Table on US - Year-over-year growth 2025-2030 (%)

12.3.2 Canada - Market size and forecast 2025-2030

Chart on Canada - Market size and forecast 2025-2030 ($ thousand)
Data Table on Canada - Market size and forecast 2025-2030 ($ thousand)
Chart on Canada - Year-over-year growth 2025-2030 (%)
Data Table on Canada - Year-over-year growth 2025-2030 (%)

12.3.3 Mexico - Market size and forecast 2025-2030

Chart on Mexico - Market size and forecast 2025-2030 ($ thousand)
Data Table on Mexico - Market size and forecast 2025-2030 ($ thousand)
Chart on Mexico - Year-over-year growth 2025-2030 (%)
Data Table on Mexico - Year-over-year growth 2025-2030 (%)

12.4 Europe - Market size and forecast 2025-2030

Chart on Europe - Market size and forecast 2025-2030 ($ thousand)
Data Table on Europe - Market size and forecast 2025-2030 ($ thousand)
Chart on Europe - Year-over-year growth 2025-2030 (%)
Data Table on Europe - Year-over-year growth 2025-2030 (%)
Chart on Regional Comparison - Europe
Data Table on Regional Comparison - Europe

12.4.1 Germany - Market size and forecast 2025-2030

Chart on Germany - Market size and forecast 2025-2030 ($ thousand)
Data Table on Germany - Market size and forecast 2025-2030 ($ thousand)
Chart on Germany - Year-over-year growth 2025-2030 (%)
Data Table on Germany - Year-over-year growth 2025-2030 (%)

12.4.2 UK - Market size and forecast 2025-2030

Chart on UK - Market size and forecast 2025-2030 ($ thousand)
Data Table on UK - Market size and forecast 2025-2030 ($ thousand)
Chart on UK - Year-over-year growth 2025-2030 (%)
Data Table on UK - Year-over-year growth 2025-2030 (%)

12.4.3 France - Market size and forecast 2025-2030

Chart on France - Market size and forecast 2025-2030 ($ thousand)
Data Table on France - Market size and forecast 2025-2030 ($ thousand)
Chart on France - Year-over-year growth 2025-2030 (%)
Data Table on France - Year-over-year growth 2025-2030 (%)

12.4.4 Italy - Market size and forecast 2025-2030

Chart on Italy - Market size and forecast 2025-2030 ($ thousand)
Data Table on Italy - Market size and forecast 2025-2030 ($ thousand)
Chart on Italy - Year-over-year growth 2025-2030 (%)
Data Table on Italy - Year-over-year growth 2025-2030 (%)

12.4.5 The Netherlands - Market size and forecast 2025-2030

Chart on The Netherlands - Market size and forecast 2025-2030 ($ thousand)
Data Table on The Netherlands - Market size and forecast 2025-2030 ($ thousand)
Chart on The Netherlands - Year-over-year growth 2025-2030 (%)
Data Table on The Netherlands - Year-over-year growth 2025-2030 (%)

12.4.6 Spain - Market size and forecast 2025-2030

Chart on Spain - Market size and forecast 2025-2030 ($ thousand)
Data Table on Spain - Market size and forecast 2025-2030 ($ thousand)
Chart on Spain - Year-over-year growth 2025-2030 (%)
Data Table on Spain - Year-over-year growth 2025-2030 (%)

12.4.7 Russia - Market size and forecast 2025-2030

Chart on Russia - Market size and forecast 2025-2030 ($ thousand)
Data Table on Russia - Market size and forecast 2025-2030 ($ thousand)
Chart on Russia - Year-over-year growth 2025-2030 (%)
Data Table on Russia - Year-over-year growth 2025-2030 (%)

12.5 Asia - Market size and forecast 2025-2030

Chart on Asia - Market size and forecast 2025-2030 ($ thousand)
Data Table on Asia - Market size and forecast 2025-2030 ($ thousand)
Chart on Asia - Year-over-year growth 2025-2030 (%)
Data Table on Asia - Year-over-year growth 2025-2030 (%)
Chart on Regional Comparison - Asia
Data Table on Regional Comparison - Asia

12.5.1 China - Market size and forecast 2025-2030

Chart on China - Market size and forecast 2025-2030 ($ thousand)
Data Table on China - Market size and forecast 2025-2030 ($ thousand)
Chart on China - Year-over-year growth 2025-2030 (%)
Data Table on China - Year-over-year growth 2025-2030 (%)

12.5.2 Japan - Market size and forecast 2025-2030

Chart on Japan - Market size and forecast 2025-2030 ($ thousand)
Data Table on Japan - Market size and forecast 2025-2030 ($ thousand)
Chart on Japan - Year-over-year growth 2025-2030 (%)
Data Table on Japan - Year-over-year growth 2025-2030 (%)

12.5.3 India - Market size and forecast 2025-2030

Chart on India - Market size and forecast 2025-2030 ($ thousand)
Data Table on India - Market size and forecast 2025-2030 ($ thousand)
Chart on India - Year-over-year growth 2025-2030 (%)
Data Table on India - Year-over-year growth 2025-2030 (%)

12.5.4 South Korea - Market size and forecast 2025-2030

Chart on South Korea - Market size and forecast 2025-2030 ($ thousand)
Data Table on South Korea - Market size and forecast 2025-2030 ($ thousand)
Chart on South Korea - Year-over-year growth 2025-2030 (%)
Data Table on South Korea - Year-over-year growth 2025-2030 (%)

12.5.5 Indonesia - Market size and forecast 2025-2030

Chart on Indonesia - Market size and forecast 2025-2030 ($ thousand)
Data Table on Indonesia - Market size and forecast 2025-2030 ($ thousand)
Chart on Indonesia - Year-over-year growth 2025-2030 (%)
Data Table on Indonesia - Year-over-year growth 2025-2030 (%)

12.5.6 Thailand - Market size and forecast 2025-2030

Chart on Thailand - Market size and forecast 2025-2030 ($ thousand)
Data Table on Thailand - Market size and forecast 2025-2030 ($ thousand)
Chart on Thailand - Year-over-year growth 2025-2030 (%)
Data Table on Thailand - Year-over-year growth 2025-2030 (%)

12.5.7 Singapore - Market size and forecast 2025-2030

Chart on Singapore - Market size and forecast 2025-2030 ($ thousand)
Data Table on Singapore - Market size and forecast 2025-2030 ($ thousand)
Chart on Singapore - Year-over-year growth 2025-2030 (%)
Data Table on Singapore - Year-over-year growth 2025-2030 (%)

12.6 Rest of World (ROW) - Market size and forecast 2025-2030

Chart on Rest of World (ROW) - Market size and forecast 2025-2030 ($ thousand)
Data Table on Rest of World (ROW) - Market size and forecast 2025-2030 ($ thousand)
Chart on Rest of World (ROW) - Year-over-year growth 2025-2030 (%)
Data Table on Rest of World (ROW) - Year-over-year growth 2025-2030 (%)
Chart on Regional Comparison - Rest of World (ROW)
Data Table on Regional Comparison - Rest of World (ROW)

12.6.1 Australia - Market size and forecast 2025-2030

Chart on Australia - Market size and forecast 2025-2030 ($ thousand)
Data Table on Australia - Market size and forecast 2025-2030 ($ thousand)
Chart on Australia - Year-over-year growth 2025-2030 (%)
Data Table on Australia - Year-over-year growth 2025-2030 (%)

12.6.2 Brazil - Market size and forecast 2025-2030

Chart on Brazil - Market size and forecast 2025-2030 ($ thousand)
Data Table on Brazil - Market size and forecast 2025-2030 ($ thousand)
Chart on Brazil - Year-over-year growth 2025-2030 (%)
Data Table on Brazil - Year-over-year growth 2025-2030 (%)

12.6.3 Turkey - Market size and forecast 2025-2030

Chart on Turkey - Market size and forecast 2025-2030 ($ thousand)
Data Table on Turkey - Market size and forecast 2025-2030 ($ thousand)
Chart on Turkey - Year-over-year growth 2025-2030 (%)
Data Table on Turkey - Year-over-year growth 2025-2030 (%)

12.6.4 South Africa - Market size and forecast 2025-2030

Chart on South Africa - Market size and forecast 2025-2030 ($ thousand)
Data Table on South Africa - Market size and forecast 2025-2030 ($ thousand)
Chart on South Africa - Year-over-year growth 2025-2030 (%)
Data Table on South Africa - Year-over-year growth 2025-2030 (%)

12.6.5 UAE - Market size and forecast 2025-2030

Chart on UAE - Market size and forecast 2025-2030 ($ thousand)
Data Table on UAE - Market size and forecast 2025-2030 ($ thousand)
Chart on UAE - Year-over-year growth 2025-2030 (%)
Data Table on UAE - Year-over-year growth 2025-2030 (%)

12.6.6 Saudi Arabia - Market size and forecast 2025-2030

Chart on Saudi Arabia - Market size and forecast 2025-2030 ($ thousand)
Data Table on Saudi Arabia - Market size and forecast 2025-2030 ($ thousand)
Chart on Saudi Arabia - Year-over-year growth 2025-2030 (%)
Data Table on Saudi Arabia - Year-over-year growth 2025-2030 (%)

12.7 Market opportunity by geography

Market opportunity by geography ($ thousand)
Data Tables on Market opportunity by geography ($ thousand)

13. Drivers, Challenges, and Opportunity

13.1 Market drivers

Surging demand for precision diagnostics and early pathological detection
Technological convergence with digital imaging and automated workflow platforms
Adoption of cloud based infrastructure for real time interoperability

13.2 Market challenges

High capital expenditure and integration complexities with legacy infrastructure
Stringent regulatory requirements and data privacy vulnerabilities
Professional skepticism and shortage of specialized ai training programs

13.3 Impact of drivers and challenges

Impact of drivers and challenges in 2025 and 2030

13.4 Market opportunities

Integration of generative AI in patient communication and treatment
Emergence of predictive analytics for personalized preventive oral healthcare
Rapid expansion of dental service organizations and standardization of clinical quality

14. Competitive Landscape

14.1 Overview

14.2

Overview on criticality of inputs and factors of differentiation

14.3 Landscape disruption

Overview on factors of disruption

14.4 Industry risks

Impact of key risks on business

15. Competitive Analysis

15.1 Companies profiled

Companies covered

15.2 Company ranking index

15.3 Market positioning of companies

Matrix on companies position and classification

15.4 3Shape AS

3Shape AS - Overview
3Shape AS - Product / Service
3Shape AS - Key offerings
SWOT

15.5 Align Technology Inc.

Align Technology Inc. - Overview
Align Technology Inc. - Business segments
Align Technology Inc. - Key offerings
Align Technology Inc. - Segment focus
SWOT

15.6 Carestream Dental LLC

Carestream Dental LLC - Overview
Carestream Dental LLC - Product / Service
Carestream Dental LLC - Key offerings
SWOT

15.7 Dentsply Sirona Inc.

Dentsply Sirona Inc. - Overview
Dentsply Sirona Inc. - Business segments
Dentsply Sirona Inc. - Key offerings
Dentsply Sirona Inc. - Segment focus
SWOT

15.8 DGNCT LLC

DGNCT LLC - Overview
DGNCT LLC - Product / Service
DGNCT LLC - Key offerings
SWOT

15.9 Envista Holdings Corp.

Envista Holdings Corp. - Overview
Envista Holdings Corp. - Business segments
Envista Holdings Corp. - Key offerings
Envista Holdings Corp. - Segment focus
SWOT

15.10 Formlabs Inc.

Formlabs Inc. - Overview
Formlabs Inc. - Product / Service
Formlabs Inc. - Key offerings
SWOT

15.11 Institut Straumann AG

Institut Straumann AG - Overview
Institut Straumann AG - Product / Service
Institut Straumann AG - Key offerings
SWOT

15.12 Medit Corp.

Medit Corp. - Overview
Medit Corp. - Product / Service
Medit Corp. - Key offerings
SWOT

15.13 Overjet Inc.

Overjet Inc. - Overview
Overjet Inc. - Product / Service
Overjet Inc. - Key offerings
SWOT

15.14 Pearl Inc.

Pearl Inc. - Overview
Pearl Inc. - Product / Service
Pearl Inc. - Key offerings
SWOT

15.15 Planet DDS Inc.

Planet DDS Inc. - Overview
Planet DDS Inc. - Product / Service
Planet DDS Inc. - Key offerings
SWOT

15.16 Planmeca Oy

Planmeca Oy - Overview
Planmeca Oy - Product / Service
Planmeca Oy - Key offerings
SWOT

15.17 SoftSmile Inc.

SoftSmile Inc. - Overview
SoftSmile Inc. - Product / Service
SoftSmile Inc. - Key offerings
SWOT

15.18 VideaHealth

VideaHealth - Overview
VideaHealth - Product / Service
VideaHealth - Key offerings
SWOT

16. Appendix

16.1 Scope of the report

Market definition
Objectives
Notes and caveats

16.2 Inclusions and exclusions checklist

Inclusions checklist
Exclusions checklist

16.3 Currency conversion rates for US$

16.4 Research methodology

16.5 Data procurement

Information sources

16.6 Data validation

16.7 Validation techniques employed for market sizing

16.8 Data synthesis

16.9 360 degree market analysis

16.10 List of abbreviations

Research Methodology

Technavio presents a detailed picture of the market by way of study, synthesis, and summation of data from multiple sources. The analysts have presented the various facets of the market with a particular focus on identifying the key industry influencers. The data thus presented is comprehensive, reliable, and the result of extensive research, both primary and secondary.

INFORMATION SOURCES

Primary sources

  • Manufacturers and suppliers
  • Channel partners
  • Industry experts
  • Strategic decision makers

Secondary sources

  • Industry journals and periodicals
  • Government data
  • Financial reports of key industry players
  • Historical data
  • Press releases

DATA ANALYSIS

Data Synthesis

  • Collation of data
  • Estimation of key figures
  • Analysis of derived insights

Data Validation

  • Triangulation with data models
  • Reference against proprietary databases
  • Corroboration with industry experts

REPORT WRITING

Qualitative

  • Market drivers
  • Market challenges
  • Market trends
  • Five forces analysis

Quantitative

  • Market size and forecast
  • Market segmentation
  • Geographical insights
  • Competitive landscape

Interested in this report?

Get your sample now to see our research methodology and insights!

Download Now

Frequently Asked Questions

Ai In Dentistry market growth will increase by USD 904517.6 thousand thousand during 2026-2030.

The Ai In Dentistry market is expected to grow at a CAGR of 21% during 2026-2030.

Ai In Dentistry market is segmented by Component (Software, Hardware, Services) End-user (Dental clinics, Hospitals and dental centers, Dental laboratories, Academic and research institutes) Application (Diagnosis and imaging, Treatment planning, Practice management)

3Shape AS, Align Technology Inc., Carestream Dental LLC, Dental Monitoring SAS, Dentsply Sirona Inc., DGNCT LLC, Envista Holdings Corp., Formlabs Inc., Imagoworks Inc., Institut Straumann AG, Medit Corp., Orca Dental AI Ltd., Overjet Inc., Pearl Inc., Planet DDS Inc., Planmeca Oy, Promaton, Relu BV, SoftSmile Inc., VideaHealth are a few of the key vendors in the Ai In Dentistry market.

North America will register the highest growth rate of 34.6% among the other regions. Therefore, the Ai In Dentistry market in North America is expected to garner significant business opportunities for the vendors during the forecast period.

US, Canada, Mexico, Germany, UK, France, Italy, The Netherlands, Spain, Russia, China, Japan, India, South Korea, Indonesia, Thailand, Singapore, Australia, Brazil, Turkey, South Africa, UAE, Saudi Arabia

  • Surging demand for precision diagnostics and early pathological detection is the driving factor this market.

The Ai In Dentistry market vendors should focus on grabbing business opportunities from the Component segment as it accounted for the largest market share in the base year.
RIA - Research AI Assistant
Ask RIA
