
AI Servers In Financial Services Market Analysis, Size, and Forecast 2026-2030: North America (US, Canada, and Mexico), Europe (UK, Germany, and France), APAC (China, India, and Singapore), Middle East and Africa (Saudi Arabia, UAE, and South Africa), South America (Brazil, Argentina, and Chile), and Rest of World (ROW)

AI Servers In Financial Services Market Analysis, Size, and Forecast 2026-2030:
North America (US, Canada, and Mexico), Europe (UK, Germany, and France), APAC (China, India, and Singapore), Middle East and Africa (Saudi Arabia, UAE, and South Africa), South America (Brazil, Argentina, and Chile), and Rest of World (ROW)

Published: Oct 2026 307 Pages SKU: IRTNTR80950

Market Overview at a Glance

$50.66 B
Market Opportunity
40.2%
CAGR 2025 - 2030
33.8%
North America Growth
$3.09 B
Fraud detection segment 2024

Ai Servers In Financial Services Market Size 2026-2030

The ai servers in financial services market size is valued to increase by USD 50.66 billion, at a CAGR of 40.2% from 2025 to 2030. Advanced fraud detection and proactive cybersecurity measures will drive the ai servers in financial services market.

Major Market Trends & Insights

  • North America dominated the market and accounted for a 33.8% growth during the forecast period.
  • By Application - Fraud detection segment was valued at USD 3.09 billion in 2024
  • By Component - Hardware segment accounted for the largest market revenue share in 2024

Market Size & Forecast

  • Market Opportunities: USD 58.22 billion
  • Market Future Opportunities: USD 50.66 billion
  • CAGR from 2025 to 2030 : 40.2%

Market Summary

  • The AI Servers In Financial Services Market is undergoing a rapid architectural transformation driven by the exponential growth of unstructured data and real-time analytical workloads. Financial institutions are aggressively modernizing their core data centers, pivoting from traditional centralized processing to massively parallel computing frameworks.
  • For example, in algorithmic trading supply chains, institutions require sub-millisecond execution to optimize portfolio risk against volatile market feeds; this operational shift has allowed firms to accelerate transaction verification speeds by over 40% compared to legacy architectures.
  • The fundamental driver of this expansion is the critical necessity for advanced fraud detection, where continuous deep learning models scan millions of daily telemetry points to proactively intercept synthetic identity breaches. Conversely, this infrastructure overhaul is heavily constrained by stringent data sovereignty regulations that prohibit the transmission of sensitive financial profiles to public environments.
  • This regulatory friction forces institutions to construct costly, air-gapped localized server clusters, significantly extending deployment timelines and inflating upfront capital requirements while they strive to maintain operational supremacy.

What will be the Size of the Ai Servers In Financial Services Market during the forecast period?
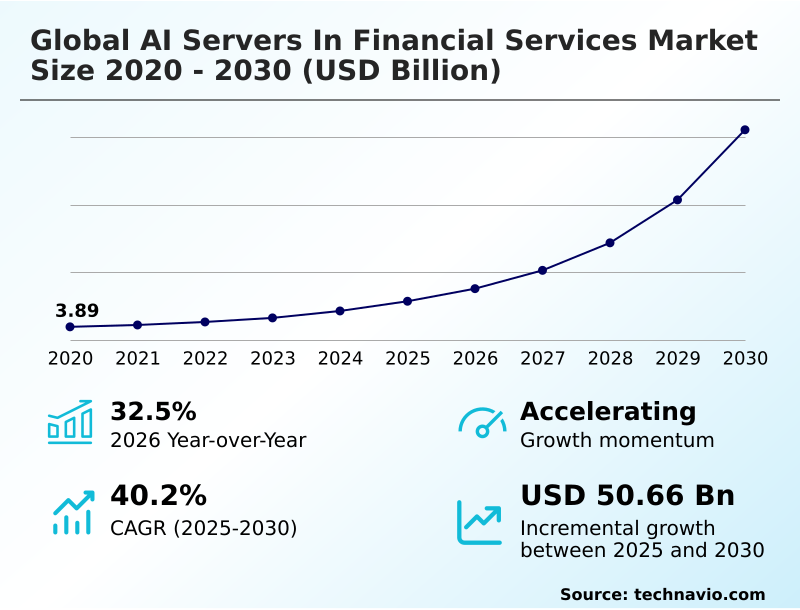
Get Key Insights on Market Forecast (PDF) Get Free Sample

How is the Ai Servers In Financial Services Market Segmented?

The ai servers in financial services industry research report provides comprehensive data (region-wise segment analysis), with forecasts and estimates in "USD million" for the period 2026-2030, as well as historical data from 2020-2024 for the following segments.

  • Application
    • Fraud detection
    • Risk management
    • Forecasting and reporting
    • Credit scoring
    • Others
  • Component
    • Hardware
    • Services
    • Software
  • Deployment
    • Cloud-based
    • On-premises
  • Geography
    • North America
      • US
      • Canada
      • Mexico
    • Europe
      • UK
      • Germany
      • France
      • The Netherlands
      • Italy
      • Spain
    • APAC
      • China
      • India
      • Singapore
      • South Korea
      • Japan
      • Australia
    • Middle East and Africa
      • Saudi Arabia
      • UAE
      • South Africa
      • Israel
      • Egypt
    • South America
      • Brazil
      • Argentina
      • Chile

By Application Insights

The fraud detection segment is estimated to witness significant growth during the forecast period.

Modern financial institutions rely on specialized AI Servers In Financial Services to execute continuous transaction monitoring across sprawling digital payment networks. The fraud detection segment requires high-frequency predictive execution to analyze complex authentication requests in real time.

Transitioning from traditional rule-based systems to dynamic frameworks has resulted in false positive reductions exceeding 15%, alongside a 25% improvement in processing velocity compared to legacy architectures.

By leveraging anti-money laundering graph neural networks, banking organizations seamlessly correlate dispersed contextual data points to identify synthetic identity threats before unauthorized settlements occur.

Furthermore, integrating dynamic credit scoring algorithms and digital identity verification telemetry allows predictive risk engines to evaluate unstructured datasets with ultra-low latency.

Distributed microservices execution ensures that these compute-intensive tasks, including monte carlo simulation workloads, scale efficiently without compromising settlement speed.

Geopolitical exposure analytics and algorithmic tax-loss harvesting occasionally share these same advanced compute resources, but fraud screening remains the primary catalyst for massive hardware deployments.
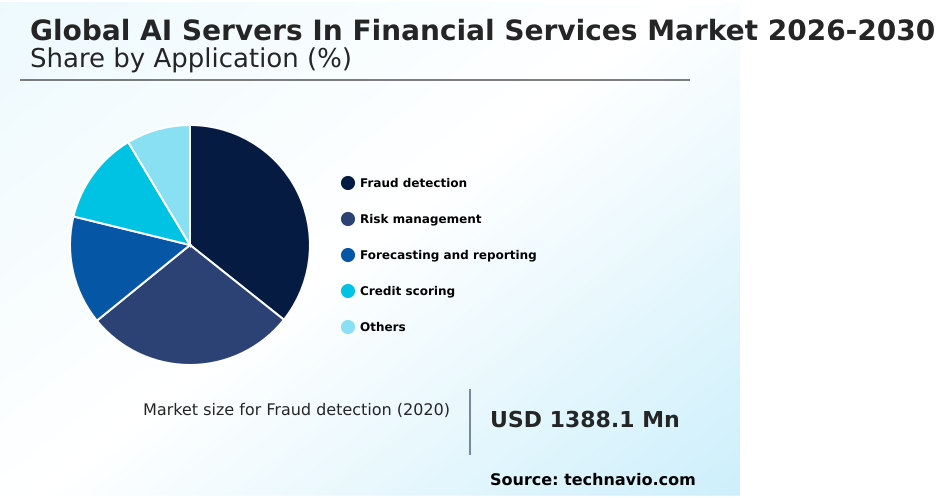
Get Free Sample

The Fraud detection segment was valued at USD 3.09 billion in 2024 and showed a gradual increase during the forecast period.
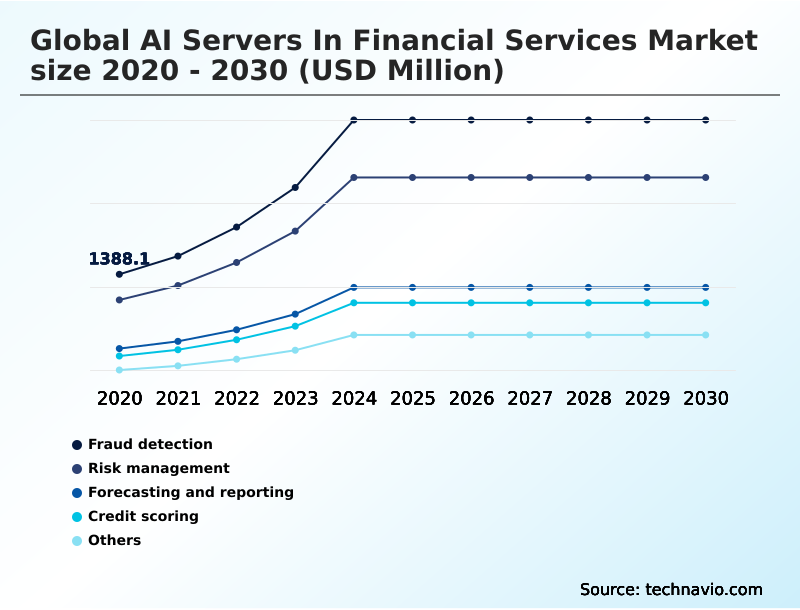
Get Free Sample

Regional Analysis

North America is estimated to contribute 33.8% to the growth of the global market during the forecast period.Technavio’s analysts have elaborately explained the regional trends and drivers that shape the market during the forecast period.
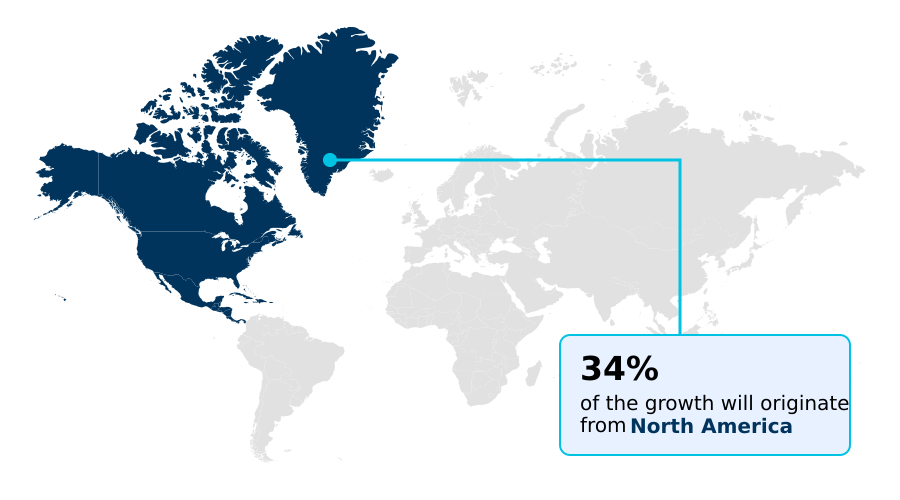
See How Ai Servers In Financial Services Market Demand is Rising in North America Get Free Sample

The AI Servers In Financial Services Market exhibits distinct structural disparities between North America and APAC.

North America maintains a dominant infrastructure footprint, where institutions heavily utilize direct-to-chip liquid cooling systems to manage thermal loads, achieving a 30% reduction in data center power consumption compared to traditional air-chilled facilities.

This region's focus on ultra-low latency transaction screening allows banks to execute mission-critical workload orchestration with exceptional precision. Conversely, APAC is experiencing a rapid technological acceleration, adopting specialized neural processing units to accommodate massive digital banking transaction volumes.

The integration of field-programmable gate arrays across Asian financial hubs has improved cross-border settlement validation speeds by 25%.

While North American entities prioritize continuous systemic operational assessment and statutory financial disclosure automation to meet rigorous oversight, APAC institutions aggressively deploy gpu-accelerated algorithmic models to capture regional market share.

These diverse adoption strategies highlight how geographic regulatory demands and consumer banking behaviors shape underlying hardware procurement.

Market Dynamics

Our researchers analyzed the data with 2025 as the base year, along with the key drivers, trends, and challenges. A holistic analysis of drivers will help companies refine their marketing strategies to gain a competitive advantage.

  • The continuous evolution of the AI Servers In Financial Services Market is fundamentally driven by the need for superior computational agility. Institutions are rapidly advancing their high-throughput tensor accelerator deployment to handle immense volumes of unstructured financial data processing nodes in real time.
  • By prioritizing algorithmic trading execution pipeline scaling, investment firms achieve critical microsecond advantages, enabling them to execute predictive risk analytics model training far more efficiently than competitors relying on sequential logic.
  • To support these intense workloads without thermal throttling, direct-to-chip liquid cooling integration is becoming a standard requirement, driving an estimated 40% improvement in sustained hardware performance compared to conventional cooling layouts. Furthermore, compliance mandates are forcing risk managers to focus on anti-money laundering graph neural execution and dynamic credit scoring algorithm execution, ensuring robust client profiling.
  • To mitigate cybersecurity vulnerabilities, banks are investing heavily in zero-trust network isolation implementation and specialized air-gapped localized server environment setup protocols. This secure foundation allows for safe monte carlo simulation workload processing and reliable retrieval-augmented generation architecture hosting without exposing proprietary logic. Simultaneously, retail banking divisions are advancing gpu-accelerated algorithmic model inference to deliver highly personalized services.
  • Ensuring that ultra-low latency transaction screening servers function flawlessly requires comprehensive hybrid cloud localized infrastructure scaling, which effectively bridges the gap between massive public cloud agility and the uncompromising security of sovereign enterprise hardware.
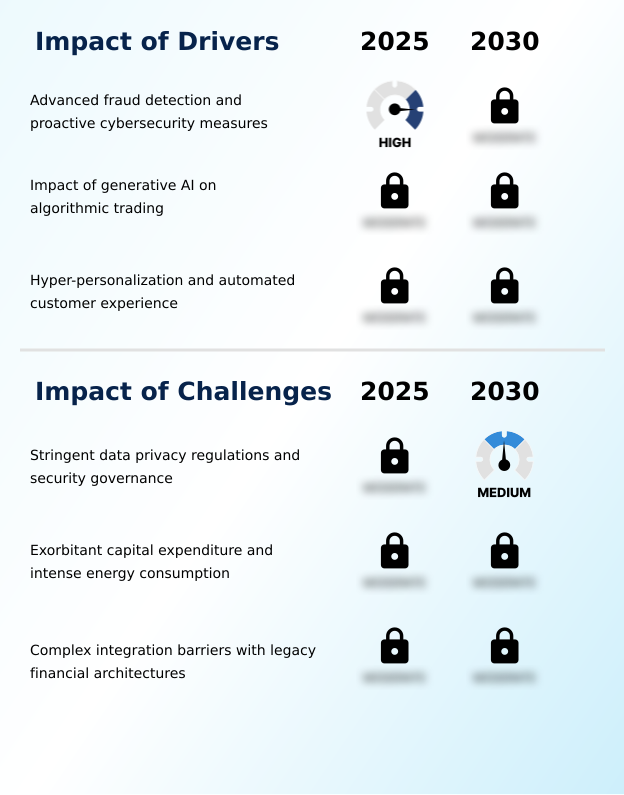
What are the key market drivers leading to the rise in the adoption of Ai Servers In Financial Services Industry?

  • The escalating demand for advanced fraud detection and proactive cybersecurity measures serves as a primary driver propelling institutional investment in high-performance computing infrastructure.

  • The escalating demand for instantaneous algorithmic trading execution pipelines and predictive risk analytics models acts as a profound catalyst for the AI Servers In Financial Services Market.
  • Investment banks must process volatile market telemetry without delay, prompting the aggressive procurement of high-throughput tensor accelerators and parallel processing compute clusters.
  • This modernization allows quantitative portfolio management execution to operate with exceptional precision, reducing latency-induced slippage by up to 35%.
  • Additionally, the reliance on generative artificial intelligence inference for real-time anomaly identification has drastically improved threat interception accuracy, yielding a 28% reduction in false-positive security alerts.
  • By deploying secure transactional telemetry processing hardware, institutions confidently run dynamic multi-asset value-at-risk calculations and predictive capital adequacy modeling, ensuring sustained competitive advantages in a hyper-connected global economy.

What are the market trends shaping the Ai Servers In Financial Services Industry?

  • The proliferation of autonomous digital agents in retail banking represents a transformative market trend. These advanced computational systems autonomously execute complex financial transactions and optimize customer wealth management operations.

  • The AI Servers In Financial Services Market is rapidly embracing the proliferation of autonomous conversational banking agents and hyper-personalized wealth advisory platforms. Financial institutions are moving away from scripted chatbots, instead adopting advanced retrieval-augmented generation architectures that reason dynamically.
  • This structural shift allows retail banks to process complex user inquiries natively, resulting in a 40% decrease in human agent escalation rates. Furthermore, the integration of natural language processing engines enables automated pitchbook creation and institutional client intelligence automation, cutting document generation time by nearly 50%.
  • To support these intensive inference workloads, enterprises are deploying dense rack-scale integrated systems featuring high-bandwidth memory channels. Sustainable enterprise thermal management systems accompany these deployments, yielding a 25% improvement in overall cooling efficiency. These innovations ensure that financial organizations can maintain superior client engagement while managing the extreme thermal outputs generated by modern mixture of experts architectures.

What challenges does the Ai Servers In Financial Services Industry face during its growth?

  • Stringent data privacy regulations and complex security governance frameworks present formidable challenges that complicate the rapid deployment of next-generation predictive computing architectures.

  • Stringent regulatory mandates regarding sovereign data privacy frameworks present substantial operational barriers within the AI Servers In Financial Services Market. Deploying unstructured financial data processing algorithms natively requires institutions to establish robust air-gapped localized server environments and enforce zero-trust network isolation. This complex localized security approach increases infrastructure deployment timelines by over 40% compared to standard public network integrations.
  • Furthermore, the sheer complexity of legacy mainframe workload migration introduces severe data synchronization bottlenecks, heavily inflating IT modernization budgets by an estimated 25%. Financial infrastructure modernization is additionally hampered by the need to guarantee explainable artificial intelligence interpretability during automated regulatory compliance reporting.
  • These strict governance demands force institutions to rely on highly customized hardware security modules and specialized hybrid cloud localized infrastructure, restricting deployment velocity.

Exclusive Technavio Analysis on Customer Landscape

The ai servers in financial services market forecasting report includes the adoption lifecycle of the market, covering from the innovator’s stage to the laggard’s stage. It focuses on adoption rates in different regions based on penetration. Furthermore, the ai servers in financial services market report also includes key purchase criteria and drivers of price sensitivity to help companies evaluate and develop their market growth analysis strategies.
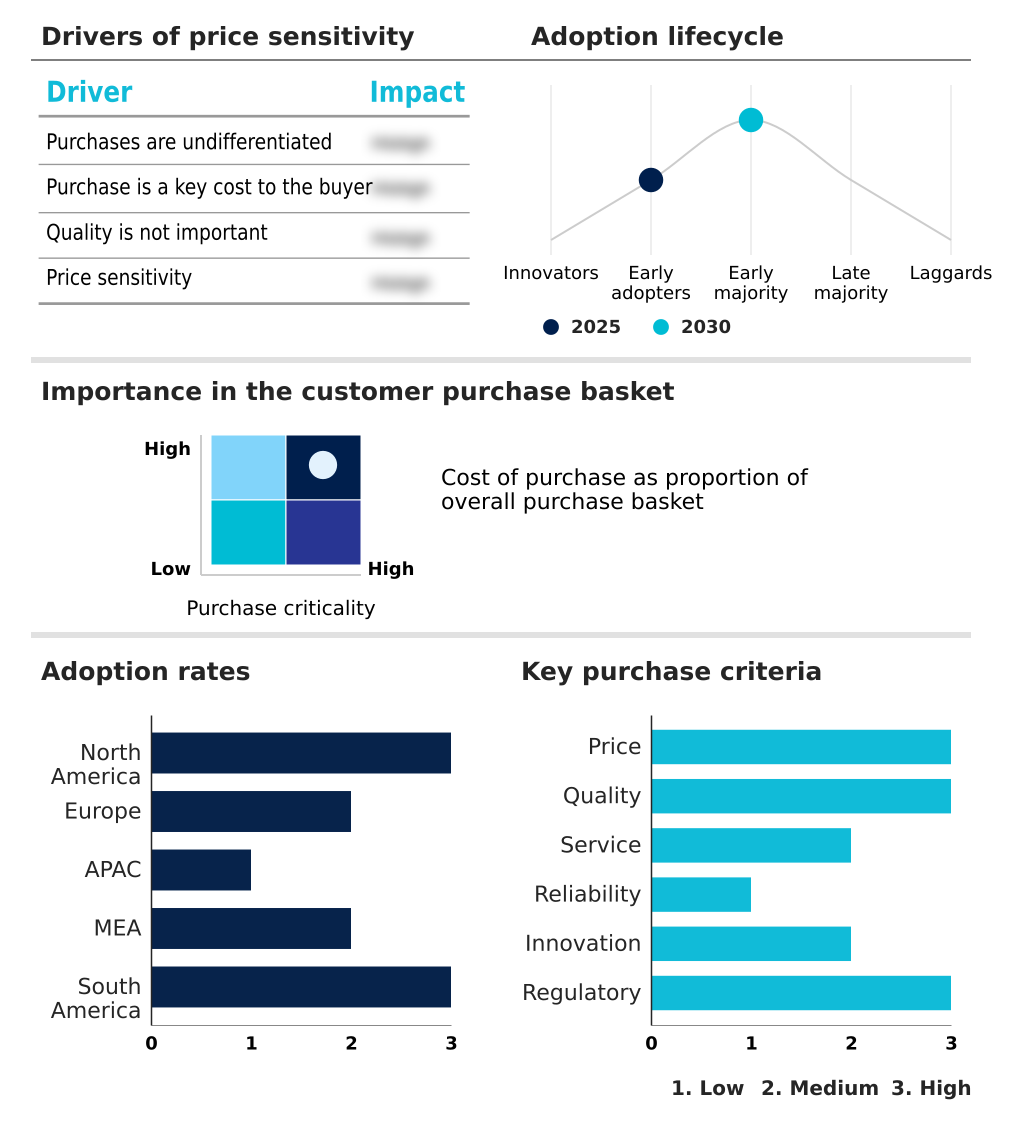
Customer Landscape of Ai Servers In Financial Services Industry

Competitive Landscape

Companies are implementing various strategies, such as strategic alliances, ai servers in financial services market forecast, partnerships, mergers and acquisitions, geographical expansion, and product/service launches, to enhance their presence in the industry.

Advantech Co. Ltd. - The enterprise provides high-performance computing infrastructure and scalable accelerated processing platforms tailored specifically to support complex predictive analytics, automated risk modeling, and advanced algorithmic execution.

The industry research and growth report includes detailed analyses of the competitive landscape of the market and information about key companies, including:

  • Advantech Co. Ltd.
  • Amazon Web Services Inc.
  • ASRock Rack Inc.
  • ASUSTeK Computer Inc.
  • Atos SE
  • Cisco Systems Inc.
  • Dell Technologies Inc.
  • Fujitsu Ltd.
  • Giga Computing Technology Co.
  • Hewlett Packard Enterprise Co.
  • IBM Corp.
  • Lanner Electronics Inc.
  • Lenovo Group Ltd.
  • Micro Star International Co. Ltd.
  • MiTAC Computing Technology Corp.
  • NVIDIA Corp.
  • Oracle Corp.
  • Pegatron Corp.
  • Super Micro Computer Inc.
  • VULTR
  • xFusion Digital Technologies Co.

Qualitative and quantitative analysis of companies has been conducted to help clients understand the wider business environment as well as the strengths and weaknesses of key industry players. Data is qualitatively analyzed to categorize companies as pure play, category-focused, industry-focused, and diversified; it is quantitatively analyzed to categorize companies as dominant, leading, strong, tentative, and weak.

Recent Development and News in Ai servers in financial services market

  • In the Diversified Support Services industry, the transition toward stringent data privacy regulations fundamentally altered outsourced infrastructure management, directly impacting AI Servers In Financial Services demand by necessitating localized, highly secure data processing nodes.
  • The integration of advanced automated regulatory compliance reporting frameworks across global business process outsourcing operations forced enterprise facilities to adopt robust computing architectures, driving hardware procurement for localized AI Servers In Financial Services.
  • Widespread implementation of sustainable enterprise thermal management standards in commercial data centers mandated the modernization of existing cooling networks, accelerating the replacement of traditional hardware with energy-efficient AI Servers In Financial Services.
  • The rapid shift toward workflow interoperability standards in commercial supply chain management required service providers to analyze massive unstructured datasets locally, spurring increased adoption of high-performance analytics hardware and impacting AI Servers In Financial Services.

Dive into Technavio’s robust research methodology, blending expert interviews, extensive data synthesis, and validated models for unparalleled Ai Servers In Financial Services Market insights. See full methodology.

Market Scope
Page number 307
Base year 2025
Historic period 2020-2024
Forecast period 2026-2030
Growth momentum & CAGR Accelerate at a CAGR of 40.2%
Market growth 2026-2030 USD 50662.8 million
Market structure Fragmented
YoY growth 2025-2026(%) 32.5%
Key countries US, Canada, Mexico, UK, Germany, France, The Netherlands, Italy, Spain, China, India, Singapore, South Korea, Japan, Australia, Saudi Arabia, UAE, South Africa, Israel, Egypt, Brazil, Argentina and Chile
Competitive landscape Leading Companies, Market Positioning of Companies, Competitive Strategies, and Industry Risks

Request Free Sample

Research Analyst Overview

  • Executive boards across the financial sector are fundamentally restructuring their IT procurement strategies to prioritize advanced parallel processing capabilities. The AI Servers In Financial Services Market reflects a critical pivot from traditional backend storage to proactive, intelligence-driven operations. By integrating high-bandwidth memory channels and sophisticated mixture of experts architectures, financial organizations drastically enhance their algorithmic execution speeds.
  • This technological transition directly influences compliance budgeting, as risk officers leverage natural language processing engines to parse dense regulatory frameworks automatically. Implementing these advanced systems has enabled tier-one institutions to realize a 45% reduction in manual compliance auditing time.
  • Furthermore, to support highly demanding natural language tasks, enterprises are shifting toward rack-scale integrated systems and retrieval-augmented generation architectures that ensure immediate data synthesis. Operating these dense configurations securely necessitates the adoption of air-gapped localized server environments and stringent zero-trust network isolation protocols.
  • Ultimately, this hardware modernization enables banking leadership to transform massive streams of unstructured data into actionable financial intelligence, fortifying their operational resilience against increasingly sophisticated cyber threats.

What are the Key Data Covered in this Ai Servers In Financial Services Market Research and Growth Report?

  • What is the expected growth of the Ai Servers In Financial Services Market between 2026 and 2030?

    • USD 50.66 billion, at a CAGR of 40.2%

  • What segmentation does the market report cover?

    • The report is segmented by Application (Fraud detection, Risk management, Forecasting and reporting, Credit scoring, and Others), Component (Hardware, Services, and Software), Deployment (Cloud-based, and On-premises) and Geography (North America, Europe, APAC, Middle East and Africa, South America)

  • Which regions are analyzed in the report?

    • North America, Europe, APAC, Middle East and Africa and South America

  • What are the key growth drivers and market challenges?

    • Advanced fraud detection and proactive cybersecurity measures, Stringent data privacy regulations and security governance

  • Who are the major players in the Ai Servers In Financial Services Market?

    • Advantech Co. Ltd., Amazon Web Services Inc., ASRock Rack Inc., ASUSTeK Computer Inc., Atos SE, Cisco Systems Inc., Dell Technologies Inc., Fujitsu Ltd., Giga Computing Technology Co., Hewlett Packard Enterprise Co., IBM Corp., Lanner Electronics Inc., Lenovo Group Ltd., Micro Star International Co. Ltd., MiTAC Computing Technology Corp., NVIDIA Corp., Oracle Corp., Pegatron Corp., Super Micro Computer Inc., VULTR and xFusion Digital Technologies Co.

Market Research Insights

  • The AI Servers In Financial Services Market demonstrates robust structural evolution as institutions modernize their analytical backbones. By integrating automated regulatory compliance reporting, organizations have reduced manual auditing errors by nearly 35%, significantly aligning operations with sovereign data privacy frameworks.
  • Furthermore, the deployment of secure transactional telemetry processing nodes enables retail banks to process real-time anomaly identification workloads with a 20% improvement in threat interception rates. This transition also facilitates seamless legacy mainframe workload migration, ultimately lowering long-term operational maintenance costs by approximately 15%.
  • Such measurable efficiency gains ensure that enterprise infrastructure investments translate directly into heightened operational resilience, allowing financial entities to securely manage massive data streams while optimizing their core computational expenditures.

We can help! Our analysts can customize this ai servers in financial services market research report to meet your requirements.

Get in touch

1. Executive Summary

1.1 Market overview

Executive Summary - Chart on Market Overview
Executive Summary - Data Table on Market Overview
Executive Summary - Chart on Global Market Characteristics
Executive Summary - Chart on Market by Geography
Executive Summary - Chart on Market Segmentation by Application
Executive Summary - Chart on Market Segmentation by Component
Executive Summary - Chart on Market Segmentation by Deployment
Executive Summary - Chart on Incremental Growth
Executive Summary - Data Table on Incremental Growth
Executive Summary - Chart on Company Market Positioning

2. Technavio Analysis

2.1 Analysis of price sensitivity, lifecycle, customer purchase basket, adoption rates, and purchase criteria

2.2 Criticality of inputs and Factors of differentiation

Chart on Overview on criticality of inputs and factors of differentiation

2.3 Factors of disruption

Chart on Overview on factors of disruption

2.4 Impact of drivers and challenges

Chart on Impact of drivers and challenges in 2025 and 2030

3. Market Landscape

3.1 Market ecosystem

Chart on Parent Market
Data Table on - Parent Market

3.2 Market characteristics

Chart on Market characteristics analysis

3.3 Value chain analysis

Chart on Value chain analysis

4. Market Sizing

4.1 Market definition

Data Table on Offerings of companies included in the market definition

4.2 Market segment analysis

Market segments

4.3 Market size 2025

4.4 Market outlook: Forecast for 2025-2030

Chart on Global - Market size and forecast 2025-2030 ($ million)
Data Table on Global - Market size and forecast 2025-2030 ($ million)
Chart on Global Market: Year-over-year growth 2025-2030 (%)
Data Table on Global Market: Year-over-year growth 2025-2030 (%)

5. Historic Market Size

5.1 Global AI Servers In Financial Services Market 2020 - 2024

Historic Market Size - Data Table on Global AI Servers In Financial Services Market 2020 - 2024 ($ million)

5.2 Application segment analysis 2020 - 2024

Historic Market Size - Application Segment 2020 - 2024 ($ million)

5.3 Component segment analysis 2020 - 2024

Historic Market Size - Component Segment 2020 - 2024 ($ million)

5.4 Deployment segment analysis 2020 - 2024

Historic Market Size - Deployment Segment 2020 - 2024 ($ million)

5.5 Geography segment analysis 2020 - 2024

Historic Market Size - Geography Segment 2020 - 2024 ($ million)

5.6 Country segment analysis 2020 - 2024

Historic Market Size - Country Segment 2020 - 2024 ($ million)

6. Qualitative Analysis

6.1 Impact of AI on Global AI Servers in Financial Services Market

6.2 Impact of Geopolitical Conflicts on Global AI Servers in Financial Services Market

7. Five Forces Analysis

7.1 Five forces summary

Five forces analysis - Comparison between 2025 and 2030

7.2 Bargaining power of buyers

Bargaining power of buyers - Impact of key factors 2025 and 2030

7.3 Bargaining power of suppliers

Bargaining power of suppliers - Impact of key factors in 2025 and 2030

7.4 Threat of new entrants

Threat of new entrants - Impact of key factors in 2025 and 2030

7.5 Threat of substitutes

Threat of substitutes - Impact of key factors in 2025 and 2030

7.6 Threat of rivalry

Threat of rivalry - Impact of key factors in 2025 and 2030

7.7 Market condition

Chart on Market condition - Five forces 2025 and 2030

8. Market Segmentation by Application

8.1 Market segments

Chart on Application - Market share 2025-2030 (%)
Data Table on Application - Market share 2025-2030 (%)

8.2 Comparison by Application

Chart on Comparison by Application
Data Table on Comparison by Application

8.3 Fraud detection - Market size and forecast 2025-2030

Chart on Fraud detection - Market size and forecast 2025-2030 ($ million)
Data Table on Fraud detection - Market size and forecast 2025-2030 ($ million)
Chart on Fraud detection - Year-over-year growth 2025-2030 (%)
Data Table on Fraud detection - Year-over-year growth 2025-2030 (%)

8.4 Risk management - Market size and forecast 2025-2030

Chart on Risk management - Market size and forecast 2025-2030 ($ million)
Data Table on Risk management - Market size and forecast 2025-2030 ($ million)
Chart on Risk management - Year-over-year growth 2025-2030 (%)
Data Table on Risk management - Year-over-year growth 2025-2030 (%)

8.5 Forecasting and reporting - Market size and forecast 2025-2030

Chart on Forecasting and reporting - Market size and forecast 2025-2030 ($ million)
Data Table on Forecasting and reporting - Market size and forecast 2025-2030 ($ million)
Chart on Forecasting and reporting - Year-over-year growth 2025-2030 (%)
Data Table on Forecasting and reporting - Year-over-year growth 2025-2030 (%)

8.6 Credit scoring - Market size and forecast 2025-2030

Chart on Credit scoring - Market size and forecast 2025-2030 ($ million)
Data Table on Credit scoring - Market size and forecast 2025-2030 ($ million)
Chart on Credit scoring - Year-over-year growth 2025-2030 (%)
Data Table on Credit scoring - Year-over-year growth 2025-2030 (%)

8.7 Others - Market size and forecast 2025-2030

Chart on Others - Market size and forecast 2025-2030 ($ million)
Data Table on Others - Market size and forecast 2025-2030 ($ million)
Chart on Others - Year-over-year growth 2025-2030 (%)
Data Table on Others - Year-over-year growth 2025-2030 (%)

8.8 Market opportunity by Application

Market opportunity by Application ($ million)
Data Table on Market opportunity by Application ($ million)

9. Market Segmentation by Component

9.1 Market segments

Chart on Component - Market share 2025-2030 (%)
Data Table on Component - Market share 2025-2030 (%)

9.2 Comparison by Component

Chart on Comparison by Component
Data Table on Comparison by Component

9.3 Hardware - Market size and forecast 2025-2030

Chart on Hardware - Market size and forecast 2025-2030 ($ million)
Data Table on Hardware - Market size and forecast 2025-2030 ($ million)
Chart on Hardware - Year-over-year growth 2025-2030 (%)
Data Table on Hardware - Year-over-year growth 2025-2030 (%)

9.4 Services - Market size and forecast 2025-2030

Chart on Services - Market size and forecast 2025-2030 ($ million)
Data Table on Services - Market size and forecast 2025-2030 ($ million)
Chart on Services - Year-over-year growth 2025-2030 (%)
Data Table on Services - Year-over-year growth 2025-2030 (%)

9.5 Software - Market size and forecast 2025-2030

Chart on Software - Market size and forecast 2025-2030 ($ million)
Data Table on Software - Market size and forecast 2025-2030 ($ million)
Chart on Software - Year-over-year growth 2025-2030 (%)
Data Table on Software - Year-over-year growth 2025-2030 (%)

9.6 Market opportunity by Component

Market opportunity by Component ($ million)
Data Table on Market opportunity by Component ($ million)

10. Market Segmentation by Deployment

10.1 Market segments

Chart on Deployment - Market share 2025-2030 (%)
Data Table on Deployment - Market share 2025-2030 (%)

10.2 Comparison by Deployment

Chart on Comparison by Deployment
Data Table on Comparison by Deployment

10.3 Cloud-based - Market size and forecast 2025-2030

Chart on Cloud-based - Market size and forecast 2025-2030 ($ million)
Data Table on Cloud-based - Market size and forecast 2025-2030 ($ million)
Chart on Cloud-based - Year-over-year growth 2025-2030 (%)
Data Table on Cloud-based - Year-over-year growth 2025-2030 (%)

10.4 On-premises - Market size and forecast 2025-2030

Chart on On-premises - Market size and forecast 2025-2030 ($ million)
Data Table on On-premises - Market size and forecast 2025-2030 ($ million)
Chart on On-premises - Year-over-year growth 2025-2030 (%)
Data Table on On-premises - Year-over-year growth 2025-2030 (%)

10.5 Market opportunity by Deployment

Market opportunity by Deployment ($ million)
Data Table on Market opportunity by Deployment ($ million)

11. Customer Landscape

11.1 Customer landscape overview

Analysis of price sensitivity, lifecycle, customer purchase basket, adoption rates, and purchase criteria

12. Geographic Landscape

12.1 Geographic segmentation

Chart on Market share by geography 2025-2030 (%)
Data Table on Market share by geography 2025-2030 (%)

12.2 Geographic comparison

Chart on Geographic comparison
Data Table on Geographic comparison

12.3 North America - Market size and forecast 2025-2030

Chart on North America - Market size and forecast 2025-2030 ($ million)
Data Table on North America - Market size and forecast 2025-2030 ($ million)
Chart on North America - Year-over-year growth 2025-2030 (%)
Data Table on North America - Year-over-year growth 2025-2030 (%)
Chart on Regional Comparison - North America
Data Table on Regional Comparison - North America

12.3.1 US - Market size and forecast 2025-2030

Chart on US - Market size and forecast 2025-2030 ($ million)
Data Table on US - Market size and forecast 2025-2030 ($ million)
Chart on US - Year-over-year growth 2025-2030 (%)
Data Table on US - Year-over-year growth 2025-2030 (%)

12.3.2 Canada - Market size and forecast 2025-2030

Chart on Canada - Market size and forecast 2025-2030 ($ million)
Data Table on Canada - Market size and forecast 2025-2030 ($ million)
Chart on Canada - Year-over-year growth 2025-2030 (%)
Data Table on Canada - Year-over-year growth 2025-2030 (%)

12.3.3 Mexico - Market size and forecast 2025-2030

Chart on Mexico - Market size and forecast 2025-2030 ($ million)
Data Table on Mexico - Market size and forecast 2025-2030 ($ million)
Chart on Mexico - Year-over-year growth 2025-2030 (%)
Data Table on Mexico - Year-over-year growth 2025-2030 (%)

12.4 Europe - Market size and forecast 2025-2030

Chart on Europe - Market size and forecast 2025-2030 ($ million)
Data Table on Europe - Market size and forecast 2025-2030 ($ million)
Chart on Europe - Year-over-year growth 2025-2030 (%)
Data Table on Europe - Year-over-year growth 2025-2030 (%)
Chart on Regional Comparison - Europe
Data Table on Regional Comparison - Europe

12.4.1 UK - Market size and forecast 2025-2030

Chart on UK - Market size and forecast 2025-2030 ($ million)
Data Table on UK - Market size and forecast 2025-2030 ($ million)
Chart on UK - Year-over-year growth 2025-2030 (%)
Data Table on UK - Year-over-year growth 2025-2030 (%)

12.4.2 Germany - Market size and forecast 2025-2030

Chart on Germany - Market size and forecast 2025-2030 ($ million)
Data Table on Germany - Market size and forecast 2025-2030 ($ million)
Chart on Germany - Year-over-year growth 2025-2030 (%)
Data Table on Germany - Year-over-year growth 2025-2030 (%)

12.4.3 France - Market size and forecast 2025-2030

Chart on France - Market size and forecast 2025-2030 ($ million)
Data Table on France - Market size and forecast 2025-2030 ($ million)
Chart on France - Year-over-year growth 2025-2030 (%)
Data Table on France - Year-over-year growth 2025-2030 (%)

12.4.4 The Netherlands - Market size and forecast 2025-2030

Chart on The Netherlands - Market size and forecast 2025-2030 ($ million)
Data Table on The Netherlands - Market size and forecast 2025-2030 ($ million)
Chart on The Netherlands - Year-over-year growth 2025-2030 (%)
Data Table on The Netherlands - Year-over-year growth 2025-2030 (%)

12.4.5 Italy - Market size and forecast 2025-2030

Chart on Italy - Market size and forecast 2025-2030 ($ million)
Data Table on Italy - Market size and forecast 2025-2030 ($ million)
Chart on Italy - Year-over-year growth 2025-2030 (%)
Data Table on Italy - Year-over-year growth 2025-2030 (%)

12.4.6 Spain - Market size and forecast 2025-2030

Chart on Spain - Market size and forecast 2025-2030 ($ million)
Data Table on Spain - Market size and forecast 2025-2030 ($ million)
Chart on Spain - Year-over-year growth 2025-2030 (%)
Data Table on Spain - Year-over-year growth 2025-2030 (%)

12.5 APAC - Market size and forecast 2025-2030

Chart on APAC - Market size and forecast 2025-2030 ($ million)
Data Table on APAC - Market size and forecast 2025-2030 ($ million)
Chart on APAC - Year-over-year growth 2025-2030 (%)
Data Table on APAC - Year-over-year growth 2025-2030 (%)
Chart on Regional Comparison - APAC
Data Table on Regional Comparison - APAC

12.5.1 China - Market size and forecast 2025-2030

Chart on China - Market size and forecast 2025-2030 ($ million)
Data Table on China - Market size and forecast 2025-2030 ($ million)
Chart on China - Year-over-year growth 2025-2030 (%)
Data Table on China - Year-over-year growth 2025-2030 (%)

12.5.2 India - Market size and forecast 2025-2030

Chart on India - Market size and forecast 2025-2030 ($ million)
Data Table on India - Market size and forecast 2025-2030 ($ million)
Chart on India - Year-over-year growth 2025-2030 (%)
Data Table on India - Year-over-year growth 2025-2030 (%)

12.5.3 Singapore - Market size and forecast 2025-2030

Chart on Singapore - Market size and forecast 2025-2030 ($ million)
Data Table on Singapore - Market size and forecast 2025-2030 ($ million)
Chart on Singapore - Year-over-year growth 2025-2030 (%)
Data Table on Singapore - Year-over-year growth 2025-2030 (%)

12.5.4 South Korea - Market size and forecast 2025-2030

Chart on South Korea - Market size and forecast 2025-2030 ($ million)
Data Table on South Korea - Market size and forecast 2025-2030 ($ million)
Chart on South Korea - Year-over-year growth 2025-2030 (%)
Data Table on South Korea - Year-over-year growth 2025-2030 (%)

12.5.5 Japan - Market size and forecast 2025-2030

Chart on Japan - Market size and forecast 2025-2030 ($ million)
Data Table on Japan - Market size and forecast 2025-2030 ($ million)
Chart on Japan - Year-over-year growth 2025-2030 (%)
Data Table on Japan - Year-over-year growth 2025-2030 (%)

12.5.6 Australia - Market size and forecast 2025-2030

Chart on Australia - Market size and forecast 2025-2030 ($ million)
Data Table on Australia - Market size and forecast 2025-2030 ($ million)
Chart on Australia - Year-over-year growth 2025-2030 (%)
Data Table on Australia - Year-over-year growth 2025-2030 (%)

12.6 Middle East and Africa - Market size and forecast 2025-2030

Chart on Middle East and Africa - Market size and forecast 2025-2030 ($ million)
Data Table on Middle East and Africa - Market size and forecast 2025-2030 ($ million)
Chart on Middle East and Africa - Year-over-year growth 2025-2030 (%)
Data Table on Middle East and Africa - Year-over-year growth 2025-2030 (%)
Chart on Regional Comparison - Middle East and Africa
Data Table on Regional Comparison - Middle East and Africa

12.6.1 Saudi Arabia - Market size and forecast 2025-2030

Chart on Saudi Arabia - Market size and forecast 2025-2030 ($ million)
Data Table on Saudi Arabia - Market size and forecast 2025-2030 ($ million)
Chart on Saudi Arabia - Year-over-year growth 2025-2030 (%)
Data Table on Saudi Arabia - Year-over-year growth 2025-2030 (%)

12.6.2 UAE - Market size and forecast 2025-2030

Chart on UAE - Market size and forecast 2025-2030 ($ million)
Data Table on UAE - Market size and forecast 2025-2030 ($ million)
Chart on UAE - Year-over-year growth 2025-2030 (%)
Data Table on UAE - Year-over-year growth 2025-2030 (%)

12.6.3 South Africa - Market size and forecast 2025-2030

Chart on South Africa - Market size and forecast 2025-2030 ($ million)
Data Table on South Africa - Market size and forecast 2025-2030 ($ million)
Chart on South Africa - Year-over-year growth 2025-2030 (%)
Data Table on South Africa - Year-over-year growth 2025-2030 (%)

12.6.4 Israel - Market size and forecast 2025-2030

Chart on Israel - Market size and forecast 2025-2030 ($ million)
Data Table on Israel - Market size and forecast 2025-2030 ($ million)
Chart on Israel - Year-over-year growth 2025-2030 (%)
Data Table on Israel - Year-over-year growth 2025-2030 (%)

12.6.5 Egypt - Market size and forecast 2025-2030

Chart on Egypt - Market size and forecast 2025-2030 ($ million)
Data Table on Egypt - Market size and forecast 2025-2030 ($ million)
Chart on Egypt - Year-over-year growth 2025-2030 (%)
Data Table on Egypt - Year-over-year growth 2025-2030 (%)

12.7 South America - Market size and forecast 2025-2030

Chart on South America - Market size and forecast 2025-2030 ($ million)
Data Table on South America - Market size and forecast 2025-2030 ($ million)
Chart on South America - Year-over-year growth 2025-2030 (%)
Data Table on South America - Year-over-year growth 2025-2030 (%)
Chart on Regional Comparison - South America
Data Table on Regional Comparison - South America

12.7.1 Brazil - Market size and forecast 2025-2030

Chart on Brazil - Market size and forecast 2025-2030 ($ million)
Data Table on Brazil - Market size and forecast 2025-2030 ($ million)
Chart on Brazil - Year-over-year growth 2025-2030 (%)
Data Table on Brazil - Year-over-year growth 2025-2030 (%)

12.7.2 Argentina - Market size and forecast 2025-2030

Chart on Argentina - Market size and forecast 2025-2030 ($ million)
Data Table on Argentina - Market size and forecast 2025-2030 ($ million)
Chart on Argentina - Year-over-year growth 2025-2030 (%)
Data Table on Argentina - Year-over-year growth 2025-2030 (%)

12.7.3 Chile - Market size and forecast 2025-2030

Chart on Chile - Market size and forecast 2025-2030 ($ million)
Data Table on Chile - Market size and forecast 2025-2030 ($ million)
Chart on Chile - Year-over-year growth 2025-2030 (%)
Data Table on Chile - Year-over-year growth 2025-2030 (%)

12.8 Market opportunity by geography

Market opportunity by geography ($ million)
Data Tables on Market opportunity by geography ($ million)

13. Drivers, Challenges, and Opportunity

13.1 Market drivers

Advanced fraud detection and proactive cybersecurity measures
Impact of generative AI on algorithmic trading
Hyper-personalization and automated customer experience

13.2 Market challenges

Stringent data privacy regulations and security governance
Exorbitant capital expenditure and intense energy consumption
Complex integration barriers with legacy financial architectures

13.3 Impact of drivers and challenges

Impact of drivers and challenges in 2025 and 2030

13.4 Market opportunities

Proliferation of autonomous digital agents in retail banking
High-density liquid cooling for financial simulation data centers
Compute infrastructure for compliance and knowledge management

14. Competitive Landscape

14.1 Overview

14.2

Overview on criticality of inputs and factors of differentiation

14.3 Landscape disruption

Overview on factors of disruption

14.4 Industry risks

Impact of key risks on business

15. Competitive Analysis

15.1 Companies profiled

Companies covered

15.2 Company ranking index

15.3 Market positioning of companies

Matrix on companies position and classification

15.4 Amazon Web Services Inc.

Amazon Web Services Inc. - Overview
Amazon Web Services Inc. - Product / Service
Amazon Web Services Inc. - Key offerings
SWOT

15.5 ASUSTeK Computer Inc.

ASUSTeK Computer Inc. - Overview
ASUSTeK Computer Inc. - Business segments
ASUSTeK Computer Inc. - Key offerings
ASUSTeK Computer Inc. - Segment focus
SWOT

15.6 Atos SE

Atos SE - Overview
Atos SE - Business segments
Atos SE - Key news
Atos SE - Key offerings
Atos SE - Segment focus
SWOT

15.7 Cisco Systems Inc.

Cisco Systems Inc. - Overview
Cisco Systems Inc. - Business segments
Cisco Systems Inc. - Key news
Cisco Systems Inc. - Key offerings
Cisco Systems Inc. - Segment focus
SWOT

15.8 Dell Technologies Inc.

Dell Technologies Inc. - Overview
Dell Technologies Inc. - Business segments
Dell Technologies Inc. - Key news
Dell Technologies Inc. - Key offerings
Dell Technologies Inc. - Segment focus
SWOT

15.9 Fujitsu Ltd.

Fujitsu Ltd. - Overview
Fujitsu Ltd. - Product / Service
Fujitsu Ltd. - Key offerings
SWOT

15.10 Hewlett Packard Enterprise Co.

Hewlett Packard Enterprise Co. - Overview
Hewlett Packard Enterprise Co. - Business segments
Hewlett Packard Enterprise Co. - Key news
Hewlett Packard Enterprise Co. - Key offerings
Hewlett Packard Enterprise Co. - Segment focus
SWOT

15.11 IBM Corp.

IBM Corp. - Overview
IBM Corp. - Business segments
IBM Corp. - Key news
IBM Corp. - Key offerings
IBM Corp. - Segment focus
SWOT

15.12 Lenovo Group Ltd.

Lenovo Group Ltd. - Overview
Lenovo Group Ltd. - Business segments
Lenovo Group Ltd. - Key news
Lenovo Group Ltd. - Key offerings
Lenovo Group Ltd. - Segment focus
SWOT

15.13 Micro Star International Co. Ltd.

Micro Star International Co. Ltd. - Overview
Micro Star International Co. Ltd. - Product / Service
Micro Star International Co. Ltd. - Key offerings
SWOT

15.14 MiTAC Computing Technology Corp.

MiTAC Computing Technology Corp. - Overview
MiTAC Computing Technology Corp. - Product / Service
MiTAC Computing Technology Corp. - Key offerings
SWOT

15.15 NVIDIA Corp.

NVIDIA Corp. - Overview
NVIDIA Corp. - Business segments
NVIDIA Corp. - Key news
NVIDIA Corp. - Key offerings
NVIDIA Corp. - Segment focus
SWOT

15.16 Oracle Corp.

Oracle Corp. - Overview
Oracle Corp. - Business segments
Oracle Corp. - Key news
Oracle Corp. - Key offerings
Oracle Corp. - Segment focus
SWOT

15.17 Pegatron Corp.

Pegatron Corp. - Overview
Pegatron Corp. - Business segments
Pegatron Corp. - Key offerings
Pegatron Corp. - Segment focus
SWOT

15.18 Super Micro Computer Inc.

Super Micro Computer Inc. - Overview
Super Micro Computer Inc. - Business segments
Super Micro Computer Inc. - Key offerings
Super Micro Computer Inc. - Segment focus
SWOT

16. Appendix

16.1 Scope of the report

Market definition
Objectives
Notes and caveats

16.2 Inclusions and exclusions checklist

Inclusions checklist
Exclusions checklist

16.3 Currency conversion rates for US$

16.4 Research methodology

16.5 Data procurement

Information sources

16.6 Data validation

16.7 Validation techniques employed for market sizing

16.8 Data synthesis

16.9 360 degree market analysis

16.10 List of abbreviations

Research Methodology

Technavio presents a detailed picture of the market by way of study, synthesis, and summation of data from multiple sources. The analysts have presented the various facets of the market with a particular focus on identifying the key industry influencers. The data thus presented is comprehensive, reliable, and the result of extensive research, both primary and secondary.

INFORMATION SOURCES

Primary sources

  • Manufacturers and suppliers
  • Channel partners
  • Industry experts
  • Strategic decision makers

Secondary sources

  • Industry journals and periodicals
  • Government data
  • Financial reports of key industry players
  • Historical data
  • Press releases

DATA ANALYSIS

Data Synthesis

  • Collation of data
  • Estimation of key figures
  • Analysis of derived insights

Data Validation

  • Triangulation with data models
  • Reference against proprietary databases
  • Corroboration with industry experts

REPORT WRITING

Qualitative

  • Market drivers
  • Market challenges
  • Market trends
  • Five forces analysis

Quantitative

  • Market size and forecast
  • Market segmentation
  • Geographical insights
  • Competitive landscape

Interested in this report?

Get your sample now to see our research methodology and insights!

Download Now

Frequently Asked Questions

Ai Servers In Financial Services market growth will increase by USD 50662.8 million during 2026-2030.

The Ai Servers In Financial Services market is expected to grow at a CAGR of 40.2% during 2026-2030.

Ai Servers In Financial Services market is segmented by Application (Fraud detection, Risk management, Forecasting and reporting, Credit scoring, Others) Component (Hardware, Services, Software) Deployment (Cloud-based, On-premises)

Advantech Co. Ltd., Amazon Web Services Inc., ASRock Rack Inc., ASUSTeK Computer Inc., Atos SE, Cisco Systems Inc., Dell Technologies Inc., Fujitsu Ltd., Giga Computing Technology Co., Hewlett Packard Enterprise Co., IBM Corp., Lanner Electronics Inc., Lenovo Group Ltd., Micro Star International Co. Ltd., MiTAC Computing Technology Corp., NVIDIA Corp., Oracle Corp., Pegatron Corp., Super Micro Computer Inc., VULTR, xFusion Digital Technologies Co. are a few of the key vendors in the Ai Servers In Financial Services market.

North America will register the highest growth rate of 33.8% among the other regions. Therefore, the Ai Servers In Financial Services market in North America is expected to garner significant business opportunities for the vendors during the forecast period.

US, Canada, Mexico, UK, Germany, France, The Netherlands, Italy, Spain, China, India, Singapore, South Korea, Japan, Australia, Saudi Arabia, UAE, South Africa, Israel, Egypt, Brazil, Argentina, Chile

  • Advanced fraud detection and proactive cybersecurity measures is the driving factor this market.

The Ai Servers In Financial Services market vendors should focus on grabbing business opportunities from the Application segment as it accounted for the largest market share in the base year.
RIA - Research AI Assistant
Ask RIA
