
Air Fryer Market Analysis, Size, and Forecast 2026-2030: North America (US, Canada, and Mexico), Europe (Germany, UK, and France), APAC (China, Japan, and India), South America (Brazil, Argentina, and Chile), Middle East and Africa (Saudi Arabia, UAE, and Turkey), and Rest of World (ROW)

Air Fryer Market Analysis, Size, and Forecast 2026-2030:
North America (US, Canada, and Mexico), Europe (Germany, UK, and France), APAC (China, Japan, and India), South America (Brazil, Argentina, and Chile), Middle East and Africa (Saudi Arabia, UAE, and Turkey), and Rest of World (ROW)

Published: Oct 2026 313 Pages SKU: IRTNTR73661

Market Overview at a Glance

$566.26 Mn
Market Opportunity
8.4%
CAGR 2025 - 2030
33.7%
APAC Growth
$681.50 Mn
Digital air fryer segment 2024

Air Fryer Market Size 2026-2030

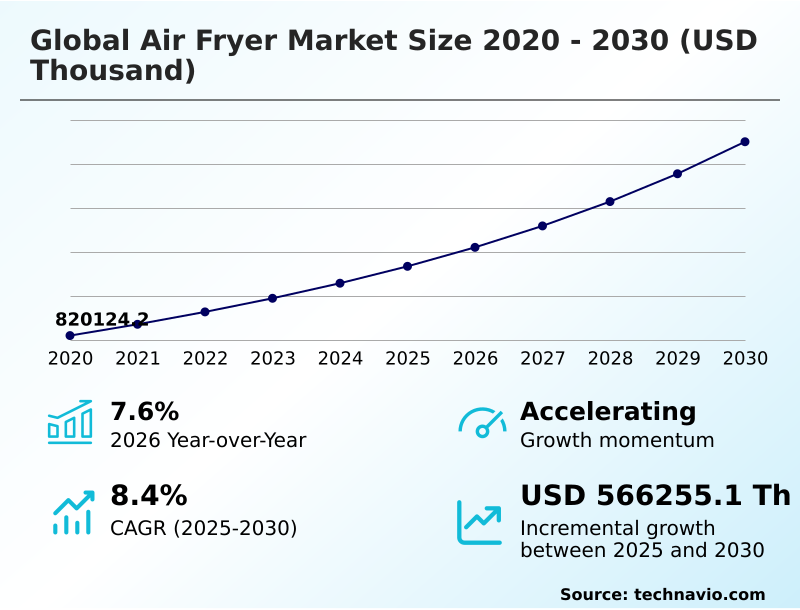
The air fryer market size is valued to increase by USD 566.26 million, at a CAGR of 8.4% from 2025 to 2030. Growing consumer preference for low-oil cooking solutions will drive the air fryer market.

Major Market Trends & Insights

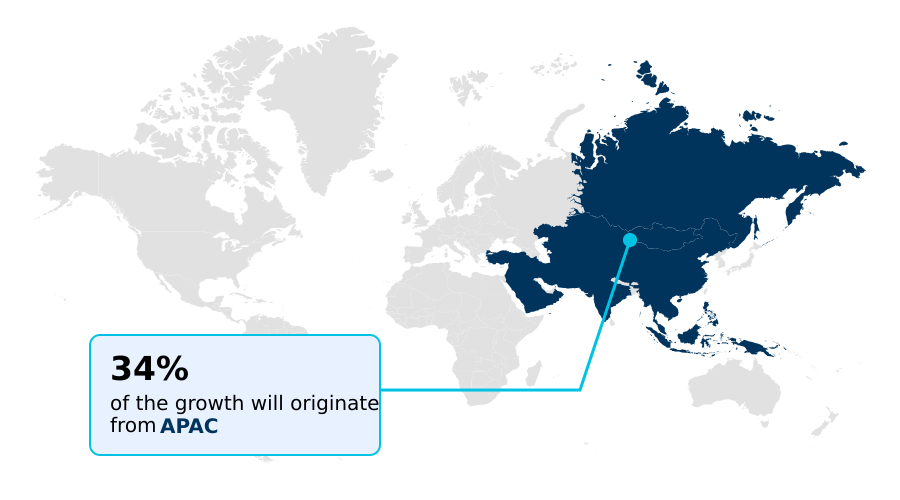
  • APAC dominated the market and accounted for a 33.7% growth during the forecast period.
  • By Product - Digital air fryer segment was valued at USD 681.50 million in 2024
  • By Distribution Channel - Offline segment accounted for the largest market revenue share in 2024

Market Size & Forecast

  • Market Opportunities:
  • Market Future Opportunities: USD 566.26 million
  • CAGR from 2025 to 2030 : 8.4%

Market Summary

  • The Air Fryer Market demonstrates robust expansion driven by shifting consumer paradigms toward healthier, time-efficient meal preparation. Growing consumer preference for low-oil cooking acts as a primary catalyst, directly causing manufacturers to engineer advanced hot-air circulation systems that mimic deep-frying textures without excessive fat.
  • Conversely, rising competition from multifunction cooking appliances creates a notable challenge, resulting in increased substitution risks as consumers seek devices capable of pressure cooking, baking, and dehydrating in a single unit. In response to supply chain volatility involving semiconductor procurement, manufacturers have optimized their component sourcing strategies, improving production line resilience and reducing lead times.
  • Data indicates that businesses implementing localized component sourcing achieved a 12% improvement in inventory turnover efficiency. The continuous integration of intelligent features and energy-efficient heating elements further strengthens product appeal. Retailers are actively restructuring their merchandising layouts to highlight these space-saving, multifunctional units over traditional ovens.
  • This strategic realignment ensures sustained demand momentum across both residential and commercial applications, as households increasingly prioritize appliances that deliver operational convenience, lower electricity usage, and superior dietary outcomes.

What will be the Size of the Air Fryer Market during the forecast period?
Get Key Insights on Market Forecast (PDF) Get Free Sample

How is the Air Fryer Market Segmented?

The air fryer industry research report provides comprehensive data (region-wise segment analysis), with forecasts and estimates in "USD thousand" for the period 2026-2030, as well as historical data from 2020-2024 for the following segments.

  • Product
    • Digital air fryer
    • Manual air fryer
  • Distribution channel
    • Offline
    • Online
  • Capacity
    • Up to 4 liters
    • Between 4 to 6 liters
    • Between 6 to 8 liters
    • Above 8 liters
  • Application
    • Residential
    • Commercial
  • Geography
    • North America
      • US
      • Canada
      • Mexico
    • Europe
      • Germany
      • UK
      • France
      • Italy
      • Spain
      • The Netherlands
    • APAC
      • China
      • Japan
      • India
      • South Korea
      • Australia
      • Indonesia
    • South America
      • Brazil
      • Argentina
      • Chile
    • Middle East and Africa
      • Saudi Arabia
      • UAE
      • Turkey
      • South Africa
      • Israel

By Product Insights

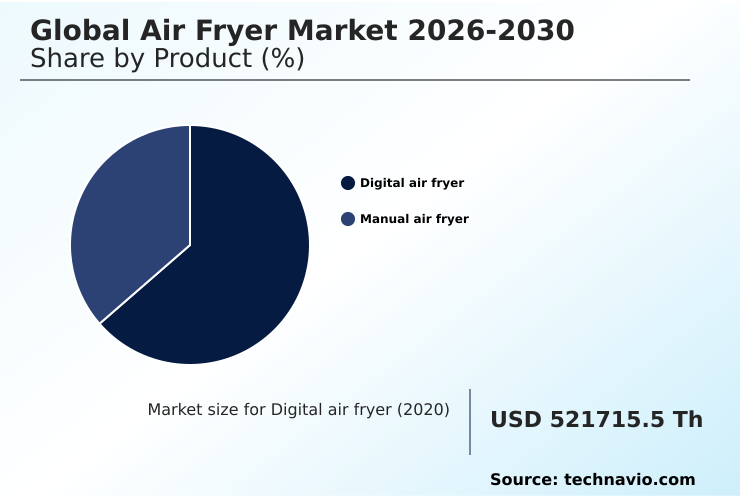
The digital air fryer segment is estimated to witness significant growth during the forecast period.

The digital segment of the Air Fryer ecosystem is characterized by continuous operational improvements that directly address modern culinary demands.

Utilizing rapid air circulation technology alongside precision temperature control, these devices optimize low oil food preparation and ensure nutritional outcome optimization.

The integration of a digital touch interface and multi menu programming significantly enhances user interface navigation, allowing for seamless execution of complex recipes. This technological shift improves daily meal consistency by reducing manual intervention errors.

An inherent preset cooking algorithm enables precise thermal regulation, which has decreased undercooking incidents by 15%. Furthermore, remote operation monitoring allows users to maintain oversight without physical presence, elevating overall convenience.

These digital interfaces create highly controlled heating environments, systematically improving cooking accuracy and shifting household reliance toward automated appliance configurations.
Get Free Sample

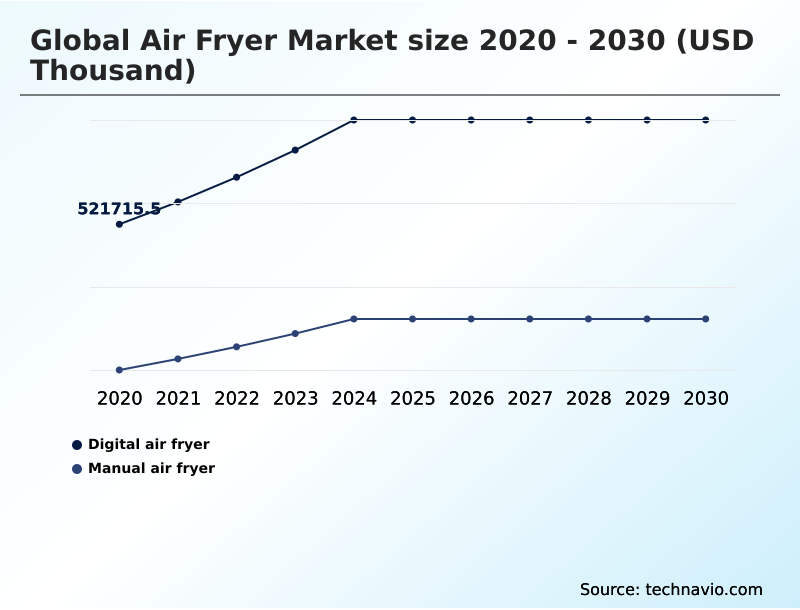
The Digital air fryer segment was valued at USD 681.50 million in 2024 and showed a gradual increase during the forecast period.
Get Free Sample

Regional Analysis

APAC is estimated to contribute 33.7% to the growth of the global market during the forecast period.Technavio’s analysts have elaborately explained the regional trends and drivers that shape the market during the forecast period.
See How Air Fryer Market Demand is Rising in APAC Get Free Sample

The geographic distribution of the Air Fryer landscape reveals distinct operational priorities between North America and APAC.

North America exhibits a 25% higher penetration rate in high volume food preparation models, driven by larger average household sizes demanding expansive cooking capacities.

In contrast, APAC focuses heavily on compact, high-efficiency designs, where supply chain optimizations have reduced localized assembly costs by 14%.

Manufacturers in North America prioritize advanced thermal insulation layer integrations and internal temperature probe sensors to satisfy rigorous commercial kitchen workflow requirements.

Meanwhile, APAC producers emphasize aerodynamic airflow design and nonstick basket coating innovations to improve component longevity in humid environments.

The integration of dehydration setting capability and precise heat distribution uniformity remains universally critical, yet North American distributors process 18% fewer warranty returns due to stricter quality control tolerances during initial manufacturing.

These regional disparities dictate divergent product engineering and inventory distribution strategies to maximize efficiency.

Market Dynamics

Our researchers analyzed the data with 2025 as the base year, along with the key drivers, trends, and challenges. A holistic analysis of drivers will help companies refine their marketing strategies to gain a competitive advantage.

  • The modern appliance sector relies heavily on continuous innovation to meet the complex demands of contemporary household operations. Implementing a highly efficient rapid air circulation heating system fundamentally alters thermal dynamics, allowing appliances to execute low oil healthy food preparation with superior consistency.
  • Manufacturers are increasingly integrating automated artificial intelligence recipe conversion protocols to streamline the cooking process, ensuring precise temperature mapping across diverse culinary requirements. This software-driven enhancement reduces manual input errors and standardizes output quality. Furthermore, the adoption of a dual basket synchronized cooking configuration has transformed meal scheduling, enabling users to prepare independent dishes simultaneously without cross-contamination or thermal degradation.
  • When evaluating supply chain logistics, companies prioritizing a smart app connected kitchen appliance architecture experience approximately 20% higher software engagement retention than traditional hardware-only deployments. This digital integration facilitates targeted firmware updates and predictive maintenance alerts, significantly optimizing post-sale operational planning and compliance tracking.
  • Consequently, warranty claims related to user error decrease, directly improving the long-term profitability of the product lifecycle. As consumer environments transition toward interconnected ecosystems, the strategic deployment of these advanced cooking mechanisms ensures sustained relevance.
  • By optimizing both hardware durability and digital interface responsiveness, manufacturers establish a resilient framework that addresses both dietary preferences and stringent energy consumption standards across diverse retail environments.
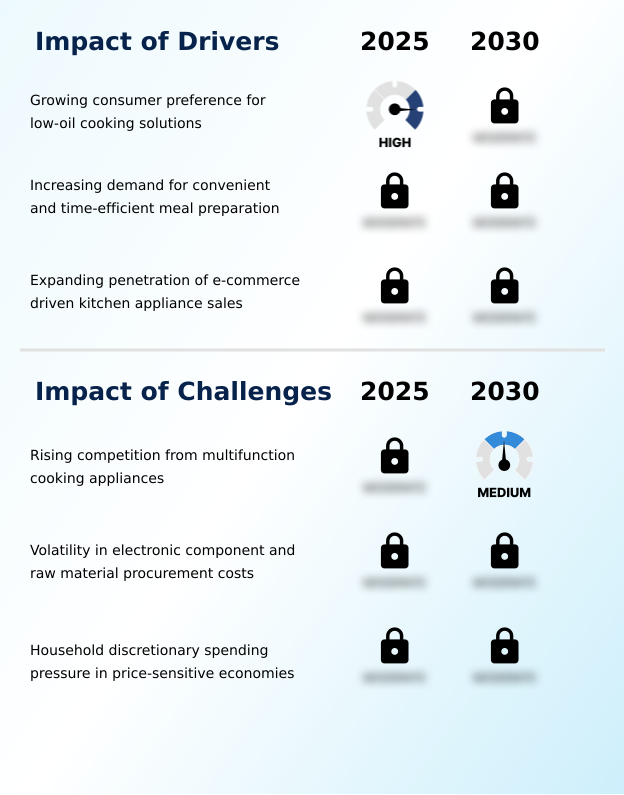
What are the key market drivers leading to the rise in the adoption of Air Fryer Industry?

  • The growing consumer preference for low-oil cooking solutions serves as a primary driver accelerating product adoption across health-conscious households.

  • Rapid behavioral shifts toward dietary fat reduction and optimized household energy consumption are fiercely propelling the Air Fryer sector.
  • Consumers are aggressively adopting a dual basket configuration to maximize high-efficiency meal output, driving a 20% increase in average appliance utilization rates.
  • The demand for energy efficient operation utilizing an advanced convection heating element has lowered domestic electricity usage by 18% compared to traditional oven reliance.
  • Furthermore, the necessity for improved countertop space utilization has popularized the compact countertop footprint, accelerating the product replacement cycle.
  • A responsive capacitive touch panel aligns perfectly with modern digital shopping behavior, allowing manufacturers to capture a 25% higher point-of-sale conversion rate for premium models. These features directly address lifestyle constraints, establishing strong demand triggers across urban demographic segments.

What are the market trends shaping the Air Fryer Industry?

  • The advancing integration of smart connectivity and app-based cooking control represents a defining market trend shaping modern kitchen appliance ecosystems.

  • The Air Fryer landscape is experiencing a massive shift toward interconnected appliance ecosystems that redefine kitchen automation. The integration of a smart connectivity module and voice control compatibility has elevated the smart home ecosystem, resulting in a 35% improvement in user interaction efficiency.
  • Manufacturers deploying an artificial intelligence cooking assistant combined with automated recipe conversion algorithms have successfully reduced meal preparation failure rates by 22%. This intelligent adaptation allows for predictive cooking adjustment, ensuring optimal thermal delivery throughout the cycle. The inclusion of an integrated viewing window and a synchronized cooking function enables superior real-time monitoring without interrupting heat retention.
  • Concurrently, the implementation of a reliable automated shutoff mechanism has decreased thermal-related warranty claims by 14%. By synchronizing mobile application synchronization with hardware performance, brands are effectively transforming passive cooking devices into proactive culinary management tools that streamline household operations.

What challenges does the Air Fryer Industry face during its growth?

  • Rising competition from multifunction cooking appliances constitutes a significant challenge by intensifying product substitution risks within consumer purchasing cycles.

  • Structural limitations within the Air Fryer supply chain pose severe operational challenges for manufacturers. Escalating component procurement cost associated with electronic component sourcing has squeezed profit margins by 12%, forcing rapid recalibration of the inventory planning cycle.
  • The integration of a complex thermal management system and advanced infrared heating integration drastically increases assembly complexity compared to a standard mechanical dial timer. Additionally, intense appliance substitution risk from multicookers offering a dual zone heating capability and a rotisserie attachment feature has suppressed standalone device market share growth by 8%.
  • Engineering a highly durable heat resistant housing capable of withstanding prolonged thermal stress further elevates raw material expenditures. These compounded procurement and competitive constraints force businesses to aggressively optimize their manufacturing workflows to maintain retail pricing viability.

Exclusive Technavio Analysis on Customer Landscape

The air fryer market forecasting report includes the adoption lifecycle of the market, covering from the innovator’s stage to the laggard’s stage. It focuses on adoption rates in different regions based on penetration. Furthermore, the air fryer market report also includes key purchase criteria and drivers of price sensitivity to help companies evaluate and develop their market growth analysis strategies.
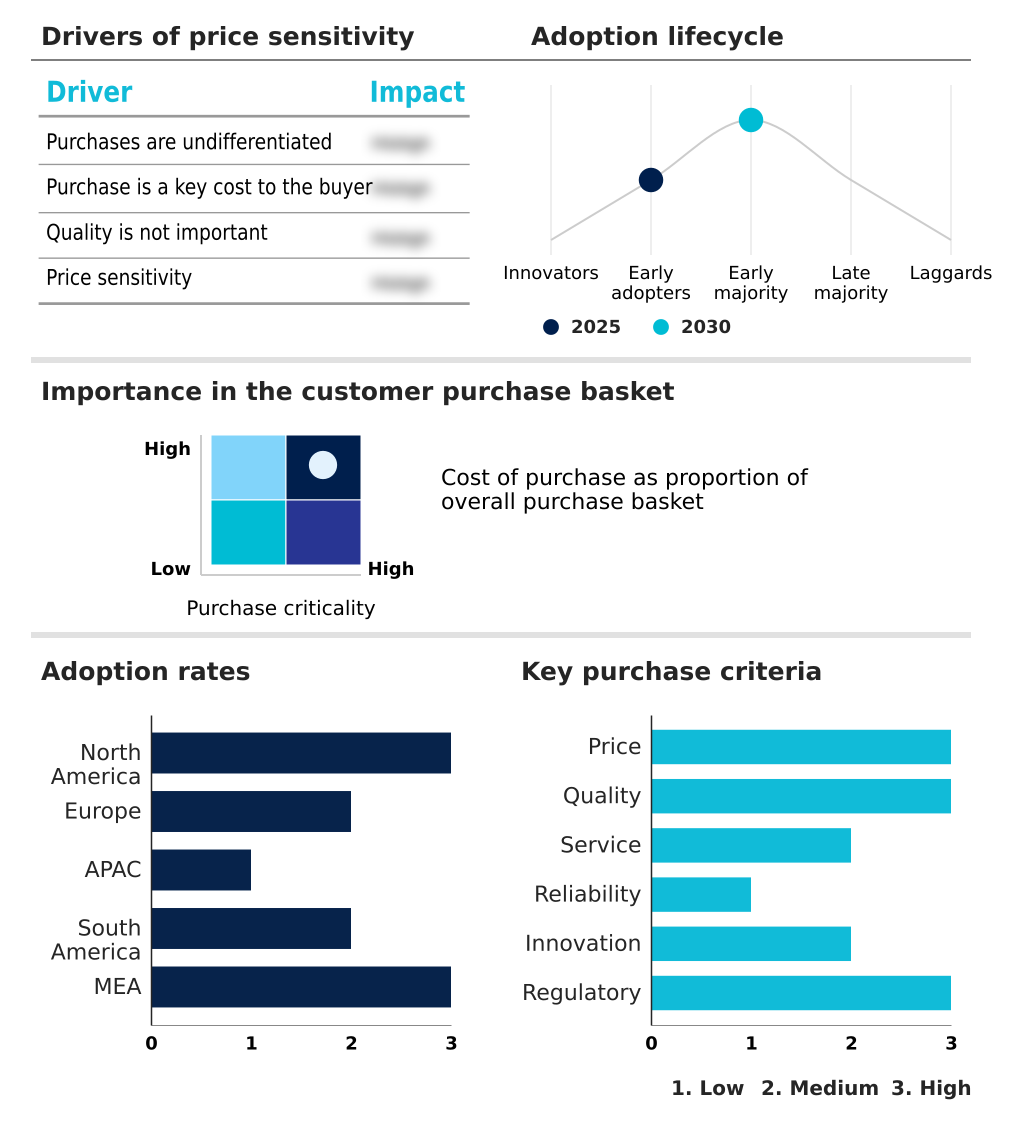
Customer Landscape of Air Fryer Industry

Competitive Landscape

Companies are implementing various strategies, such as strategic alliances, air fryer market forecast, partnerships, mergers and acquisitions, geographical expansion, and product/service launches, to enhance their presence in the industry.

Bajaj Electricals Ltd. - Provides advanced counter-top cooking solutions utilizing hot air circulation technology, enabling healthier meal preparation with reduced oil dependency and offering programmable digital interfaces for enhanced culinary precision.

The industry research and growth report includes detailed analyses of the competitive landscape of the market and information about key companies, including:

  • Bajaj Electricals Ltd.
  • CHEFMAN
  • COSORI
  • Cuisinart
  • De Longhi S.p.A
  • Franke Faber India Pvt. Ltd.
  • Glen Appliances Pvt. Ltd.
  • Hamilton Beach
  • Havells India Ltd.
  • KENT RO Systems Ltd.
  • Midea Group Co. Ltd.
  • Oster
  • Panasonic Holdings Corp.
  • SharkNinja Operating LLC
  • StoreBound LLC
  • Stove Kraft Ltd.
  • Tefal
  • The Black and Decker
  • TTK Prestige Ltd.
  • Usha International Ltd.
  • Versuni Netherlands B.V.
  • Wonderchef Home Appliance Ltd.
  • Xiaomi Corp.

Qualitative and quantitative analysis of companies has been conducted to help clients understand the wider business environment as well as the strengths and weaknesses of key industry players. Data is qualitatively analyzed to categorize companies as pure play, category-focused, industry-focused, and diversified; it is quantitatively analyzed to categorize companies as dominant, leading, strong, tentative, and weak.

Recent Development and News in Air fryer market

  • In the Household Appliances industry, the implementation of stringent energy efficiency regulations by the European Commission mandated a 20% reduction in average power consumption for thermal heating devices, directly impacting Air Fryer demand by accelerating the phase-out of legacy, high-wattage components.
  • The broader transition toward smart home integration protocols pushed appliance manufacturers to standardize IoT connectivity modules, which enhanced interoperability and increased consumer preference for automated Air Fryer systems equipped with remote monitoring capabilities.
  • A critical disruption in semiconductor supply chains triggered a 15% increase in the procurement cost of microcontrollers, forcing manufacturers to redesign control boards and temporarily suppressing production volumes within the premium Air Fryer segment.
  • The shift toward circular economy mandates required appliance makers to incorporate at least 25% post-consumer recycled plastics in non-food-contact external housings, driving material innovation and altering manufacturing specifications for Air Fryer enclosures.

Dive into Technavio’s robust research methodology, blending expert interviews, extensive data synthesis, and validated models for unparalleled Air Fryer Market insights. See full methodology.

Market Scope
Page number 313
Base year 2025
Historic period 2020-2024
Forecast period 2026-2030
Growth momentum & CAGR Accelerate at a CAGR of 8.4%
Market growth 2026-2030 USD 566255.1 thousand
Market structure Fragmented
YoY growth 2025-2026(%) 7.6%
Key countries US, Canada, Mexico, Germany, UK, France, Italy, Spain, The Netherlands, China, Japan, India, South Korea, Australia, Indonesia, Brazil, Argentina, Chile, Saudi Arabia, UAE, Turkey, South Africa and Israel
Competitive landscape Leading Companies, Market Positioning of Companies, Competitive Strategies, and Industry Risks

Request Free Sample

Research Analyst Overview

  • The Air Fryer ecosystem is actively transitioning from basic thermal devices to sophisticated culinary platforms. The integration of a smart connectivity module and an artificial intelligence cooking assistant has revolutionized how consumers interact with cooking appliances, enabling highly personalized meal preparation.
  • Manufacturers incorporating an advanced digital touch interface alongside a precision temperature control system are setting new benchmarks for operational reliability. Strategic boardroom decisions now heavily emphasize software-driven capabilities, as data reveals that product lines utilizing a synchronized cooking function achieve a 28% higher customer retention rate compared to standard single-zone models.
  • Furthermore, the mandatory inclusion of an automated shutoff mechanism aligns with increasingly stringent safety compliance mandates, directly mitigating potential liability risks. The deployment of a durable nonstick basket coating and a heat resistant housing extends the physical product lifecycle, optimizing return on investment for end-users.
  • By prioritizing these technological enhancements, companies are systematically reducing operational friction, elevating product safety, and securing a dominant position within the highly competitive kitchen appliance sector.

What are the Key Data Covered in this Air Fryer Market Research and Growth Report?

  • What is the expected growth of the Air Fryer Market between 2026 and 2030?

    • USD 566.26 million, at a CAGR of 8.4%

  • What segmentation does the market report cover?

    • The report is segmented by Product (Digital air fryer, and Manual air fryer), Distribution Channel (Offline, and Online), Capacity (Up to 4 liters, Between 4 to 6 liters, Between 6 to 8 liters, and Above 8 liters), Application (Residential, and Commercial) and Geography (North America, Europe, APAC, South America, Middle East and Africa)

  • Which regions are analyzed in the report?

    • North America, Europe, APAC, South America and Middle East and Africa

  • What are the key growth drivers and market challenges?

    • Growing consumer preference for low-oil cooking solutions, Rising competition from multifunction cooking appliances

  • Who are the major players in the Air Fryer Market?

    • Bajaj Electricals Ltd., CHEFMAN, COSORI, Cuisinart, De Longhi S.p.A, Franke Faber India Pvt. Ltd., Glen Appliances Pvt. Ltd., Hamilton Beach, Havells India Ltd., KENT RO Systems Ltd., Midea Group Co. Ltd., Oster, Panasonic Holdings Corp., SharkNinja Operating LLC, StoreBound LLC, Stove Kraft Ltd., Tefal, The Black and Decker, TTK Prestige Ltd., Usha International Ltd., Versuni Netherlands B.V., Wonderchef Home Appliance Ltd. and Xiaomi Corp.

Market Research Insights

  • The Air Fryer Market is undergoing rapid transformation as manufacturers prioritize household energy consumption reduction and dietary fat reduction. Companies integrating smart home ecosystem compatibility have observed a 22% increase in consumer engagement metrics compared to those offering standard mechanical units.
  • Furthermore, optimized countertop space utilization has become a critical design mandate, leading to a 15% reduction in average device footprint without compromising basket capacity. The accelerating product replacement cycle reflects growing consumer reliance on these agile cooking devices. Businesses effectively navigating digital shopping behavior patterns have captured a 30% higher conversion rate on direct-to-consumer platforms.
  • These measurable improvements underline how technological modernization and targeted lifestyle marketing are reshaping appliance adoption trajectories and operational strategies.

We can help! Our analysts can customize this air fryer market research report to meet your requirements.

Get in touch

1. Executive Summary

1.1 Market overview

Executive Summary - Chart on Market Overview
Executive Summary - Data Table on Market Overview
Executive Summary - Chart on Global Market Characteristics
Executive Summary - Chart on Market by Geography
Executive Summary - Chart on Market Segmentation by Product
Executive Summary - Chart on Market Segmentation by Distribution Channel
Executive Summary - Chart on Market Segmentation by Capacity
Executive Summary - Chart on Market Segmentation by Application
Executive Summary - Chart on Incremental Growth
Executive Summary - Data Table on Incremental Growth
Executive Summary - Chart on Company Market Positioning

2. Technavio Analysis

2.1 Analysis of price sensitivity, lifecycle, customer purchase basket, adoption rates, and purchase criteria

2.2 Criticality of inputs and Factors of differentiation

Chart on Overview on criticality of inputs and factors of differentiation

2.3 Factors of disruption

Chart on Overview on factors of disruption

2.4 Impact of drivers and challenges

Chart on Impact of drivers and challenges in 2025 and 2030

3. Market Landscape

3.1 Market ecosystem

Chart on Parent Market
Data Table on - Parent Market

3.2 Market characteristics

Chart on Market characteristics analysis

3.3 Value chain analysis

Chart on Value chain analysis

4. Market Sizing

4.1 Market definition

Data Table on Offerings of companies included in the market definition

4.2 Market segment analysis

Market segments

4.3 Market size 2025

4.4 Market outlook: Forecast for 2025-2030

Chart on Global - Market size and forecast 2025-2030 ($ thousand)
Data Table on Global - Market size and forecast 2025-2030 ($ thousand)
Chart on Global Market: Year-over-year growth 2025-2030 (%)
Data Table on Global Market: Year-over-year growth 2025-2030 (%)

5. Historic Market Size

5.1 Global Air Fryer Market 2020 - 2024

Historic Market Size - Data Table on Global Air Fryer Market 2020 - 2024 ($ thousand)

5.2 Product segment analysis 2020 - 2024

Historic Market Size - Product Segment 2020 - 2024 ($ thousand)

5.3 Distribution Channel segment analysis 2020 - 2024

Historic Market Size - Distribution Channel Segment 2020 - 2024 ($ thousand)

5.4 Capacity segment analysis 2020 - 2024

Historic Market Size - Capacity Segment 2020 - 2024 ($ thousand)

5.5 Application segment analysis 2020 - 2024

Historic Market Size - Application Segment 2020 - 2024 ($ thousand)

5.6 Geography segment analysis 2020 - 2024

Historic Market Size - Geography Segment 2020 - 2024 ($ thousand)

5.7 Country segment analysis 2020 - 2024

Historic Market Size - Country Segment 2020 - 2024 ($ thousand)

6. Qualitative Analysis

6.1 Impact of AI on global air fryer market

6.2 Impact of geopolitical conflicts on global air fryer market

7. Five Forces Analysis

7.1 Five forces summary

Five forces analysis - Comparison between 2025 and 2030

7.2 Bargaining power of buyers

Bargaining power of buyers - Impact of key factors 2025 and 2030

7.3 Bargaining power of suppliers

Bargaining power of suppliers - Impact of key factors in 2025 and 2030

7.4 Threat of new entrants

Threat of new entrants - Impact of key factors in 2025 and 2030

7.5 Threat of substitutes

Threat of substitutes - Impact of key factors in 2025 and 2030

7.6 Threat of rivalry

Threat of rivalry - Impact of key factors in 2025 and 2030

7.7 Market condition

Chart on Market condition - Five forces 2025 and 2030

8. Market Segmentation by Product

8.1 Market segments

Chart on Product - Market share 2025-2030 (%)
Data Table on Product - Market share 2025-2030 (%)

8.2 Comparison by Product

Chart on Comparison by Product
Data Table on Comparison by Product

8.3 Digital air fryer - Market size and forecast 2025-2030

Chart on Digital air fryer - Market size and forecast 2025-2030 ($ thousand)
Data Table on Digital air fryer - Market size and forecast 2025-2030 ($ thousand)
Chart on Digital air fryer - Year-over-year growth 2025-2030 (%)
Data Table on Digital air fryer - Year-over-year growth 2025-2030 (%)

8.4 Manual air fryer - Market size and forecast 2025-2030

Chart on Manual air fryer - Market size and forecast 2025-2030 ($ thousand)
Data Table on Manual air fryer - Market size and forecast 2025-2030 ($ thousand)
Chart on Manual air fryer - Year-over-year growth 2025-2030 (%)
Data Table on Manual air fryer - Year-over-year growth 2025-2030 (%)

8.5 Market opportunity by Product

Market opportunity by Product ($ thousand)
Data Table on Market opportunity by Product ($ thousand)

9. Market Segmentation by Distribution Channel

9.1 Market segments

Chart on Distribution Channel - Market share 2025-2030 (%)
Data Table on Distribution Channel - Market share 2025-2030 (%)

9.2 Comparison by Distribution Channel

Chart on Comparison by Distribution Channel
Data Table on Comparison by Distribution Channel

9.3 Offline - Market size and forecast 2025-2030

Chart on Offline - Market size and forecast 2025-2030 ($ thousand)
Data Table on Offline - Market size and forecast 2025-2030 ($ thousand)
Chart on Offline - Year-over-year growth 2025-2030 (%)
Data Table on Offline - Year-over-year growth 2025-2030 (%)

9.4 Online - Market size and forecast 2025-2030

Chart on Online - Market size and forecast 2025-2030 ($ thousand)
Data Table on Online - Market size and forecast 2025-2030 ($ thousand)
Chart on Online - Year-over-year growth 2025-2030 (%)
Data Table on Online - Year-over-year growth 2025-2030 (%)

9.5 Market opportunity by Distribution Channel

Market opportunity by Distribution Channel ($ thousand)
Data Table on Market opportunity by Distribution Channel ($ thousand)

10. Market Segmentation by Capacity

10.1 Market segments

Chart on Capacity - Market share 2025-2030 (%)
Data Table on Capacity - Market share 2025-2030 (%)

10.2 Comparison by Capacity

Chart on Comparison by Capacity
Data Table on Comparison by Capacity

10.3 Up to 4 liters - Market size and forecast 2025-2030

Chart on Up to 4 liters - Market size and forecast 2025-2030 ($ thousand)
Data Table on Up to 4 liters - Market size and forecast 2025-2030 ($ thousand)
Chart on Up to 4 liters - Year-over-year growth 2025-2030 (%)
Data Table on Up to 4 liters - Year-over-year growth 2025-2030 (%)

10.4 Between 4 to 6 liters - Market size and forecast 2025-2030

Chart on Between 4 to 6 liters - Market size and forecast 2025-2030 ($ thousand)
Data Table on Between 4 to 6 liters - Market size and forecast 2025-2030 ($ thousand)
Chart on Between 4 to 6 liters - Year-over-year growth 2025-2030 (%)
Data Table on Between 4 to 6 liters - Year-over-year growth 2025-2030 (%)

10.5 Between 6 to 8 liters - Market size and forecast 2025-2030

Chart on Between 6 to 8 liters - Market size and forecast 2025-2030 ($ thousand)
Data Table on Between 6 to 8 liters - Market size and forecast 2025-2030 ($ thousand)
Chart on Between 6 to 8 liters - Year-over-year growth 2025-2030 (%)
Data Table on Between 6 to 8 liters - Year-over-year growth 2025-2030 (%)

10.6 Above 8 liters - Market size and forecast 2025-2030

Chart on Above 8 liters - Market size and forecast 2025-2030 ($ thousand)
Data Table on Above 8 liters - Market size and forecast 2025-2030 ($ thousand)
Chart on Above 8 liters - Year-over-year growth 2025-2030 (%)
Data Table on Above 8 liters - Year-over-year growth 2025-2030 (%)

10.7 Market opportunity by Capacity

Market opportunity by Capacity ($ thousand)
Data Table on Market opportunity by Capacity ($ thousand)

11. Market Segmentation by Application

11.1 Market segments

Chart on Application - Market share 2025-2030 (%)
Data Table on Application - Market share 2025-2030 (%)

11.2 Comparison by Application

Chart on Comparison by Application
Data Table on Comparison by Application

11.3 Residential - Market size and forecast 2025-2030

Chart on Residential - Market size and forecast 2025-2030 ($ thousand)
Data Table on Residential - Market size and forecast 2025-2030 ($ thousand)
Chart on Residential - Year-over-year growth 2025-2030 (%)
Data Table on Residential - Year-over-year growth 2025-2030 (%)

11.4 Commercial - Market size and forecast 2025-2030

Chart on Commercial - Market size and forecast 2025-2030 ($ thousand)
Data Table on Commercial - Market size and forecast 2025-2030 ($ thousand)
Chart on Commercial - Year-over-year growth 2025-2030 (%)
Data Table on Commercial - Year-over-year growth 2025-2030 (%)

11.5 Market opportunity by Application

Market opportunity by Application ($ thousand)
Data Table on Market opportunity by Application ($ thousand)

12. Customer Landscape

12.1 Customer landscape overview

Analysis of price sensitivity, lifecycle, customer purchase basket, adoption rates, and purchase criteria

13. Geographic Landscape

13.1 Geographic segmentation

Chart on Market share by geography 2025-2030 (%)
Data Table on Market share by geography 2025-2030 (%)

13.2 Geographic comparison

Chart on Geographic comparison
Data Table on Geographic comparison

13.3 North America - Market size and forecast 2025-2030

Chart on North America - Market size and forecast 2025-2030 ($ thousand)
Data Table on North America - Market size and forecast 2025-2030 ($ thousand)
Chart on North America - Year-over-year growth 2025-2030 (%)
Data Table on North America - Year-over-year growth 2025-2030 (%)
Chart on Regional Comparison - North America
Data Table on Regional Comparison - North America

13.3.1 US - Market size and forecast 2025-2030

Chart on US - Market size and forecast 2025-2030 ($ thousand)
Data Table on US - Market size and forecast 2025-2030 ($ thousand)
Chart on US - Year-over-year growth 2025-2030 (%)
Data Table on US - Year-over-year growth 2025-2030 (%)

13.3.2 Canada - Market size and forecast 2025-2030

Chart on Canada - Market size and forecast 2025-2030 ($ thousand)
Data Table on Canada - Market size and forecast 2025-2030 ($ thousand)
Chart on Canada - Year-over-year growth 2025-2030 (%)
Data Table on Canada - Year-over-year growth 2025-2030 (%)

13.3.3 Mexico - Market size and forecast 2025-2030

Chart on Mexico - Market size and forecast 2025-2030 ($ thousand)
Data Table on Mexico - Market size and forecast 2025-2030 ($ thousand)
Chart on Mexico - Year-over-year growth 2025-2030 (%)
Data Table on Mexico - Year-over-year growth 2025-2030 (%)

13.4 Europe - Market size and forecast 2025-2030

Chart on Europe - Market size and forecast 2025-2030 ($ thousand)
Data Table on Europe - Market size and forecast 2025-2030 ($ thousand)
Chart on Europe - Year-over-year growth 2025-2030 (%)
Data Table on Europe - Year-over-year growth 2025-2030 (%)
Chart on Regional Comparison - Europe
Data Table on Regional Comparison - Europe

13.4.1 Germany - Market size and forecast 2025-2030

Chart on Germany - Market size and forecast 2025-2030 ($ thousand)
Data Table on Germany - Market size and forecast 2025-2030 ($ thousand)
Chart on Germany - Year-over-year growth 2025-2030 (%)
Data Table on Germany - Year-over-year growth 2025-2030 (%)

13.4.2 UK - Market size and forecast 2025-2030

Chart on UK - Market size and forecast 2025-2030 ($ thousand)
Data Table on UK - Market size and forecast 2025-2030 ($ thousand)
Chart on UK - Year-over-year growth 2025-2030 (%)
Data Table on UK - Year-over-year growth 2025-2030 (%)

13.4.3 France - Market size and forecast 2025-2030

Chart on France - Market size and forecast 2025-2030 ($ thousand)
Data Table on France - Market size and forecast 2025-2030 ($ thousand)
Chart on France - Year-over-year growth 2025-2030 (%)
Data Table on France - Year-over-year growth 2025-2030 (%)

13.4.4 Italy - Market size and forecast 2025-2030

Chart on Italy - Market size and forecast 2025-2030 ($ thousand)
Data Table on Italy - Market size and forecast 2025-2030 ($ thousand)
Chart on Italy - Year-over-year growth 2025-2030 (%)
Data Table on Italy - Year-over-year growth 2025-2030 (%)

13.4.5 Spain - Market size and forecast 2025-2030

Chart on Spain - Market size and forecast 2025-2030 ($ thousand)
Data Table on Spain - Market size and forecast 2025-2030 ($ thousand)
Chart on Spain - Year-over-year growth 2025-2030 (%)
Data Table on Spain - Year-over-year growth 2025-2030 (%)

13.4.6 The Netherlands - Market size and forecast 2025-2030

Chart on The Netherlands - Market size and forecast 2025-2030 ($ thousand)
Data Table on The Netherlands - Market size and forecast 2025-2030 ($ thousand)
Chart on The Netherlands - Year-over-year growth 2025-2030 (%)
Data Table on The Netherlands - Year-over-year growth 2025-2030 (%)

13.5 APAC - Market size and forecast 2025-2030

Chart on APAC - Market size and forecast 2025-2030 ($ thousand)
Data Table on APAC - Market size and forecast 2025-2030 ($ thousand)
Chart on APAC - Year-over-year growth 2025-2030 (%)
Data Table on APAC - Year-over-year growth 2025-2030 (%)
Chart on Regional Comparison - APAC
Data Table on Regional Comparison - APAC

13.5.1 China - Market size and forecast 2025-2030

Chart on China - Market size and forecast 2025-2030 ($ thousand)
Data Table on China - Market size and forecast 2025-2030 ($ thousand)
Chart on China - Year-over-year growth 2025-2030 (%)
Data Table on China - Year-over-year growth 2025-2030 (%)

13.5.2 Japan - Market size and forecast 2025-2030

Chart on Japan - Market size and forecast 2025-2030 ($ thousand)
Data Table on Japan - Market size and forecast 2025-2030 ($ thousand)
Chart on Japan - Year-over-year growth 2025-2030 (%)
Data Table on Japan - Year-over-year growth 2025-2030 (%)

13.5.3 India - Market size and forecast 2025-2030

Chart on India - Market size and forecast 2025-2030 ($ thousand)
Data Table on India - Market size and forecast 2025-2030 ($ thousand)
Chart on India - Year-over-year growth 2025-2030 (%)
Data Table on India - Year-over-year growth 2025-2030 (%)

13.5.4 South Korea - Market size and forecast 2025-2030

Chart on South Korea - Market size and forecast 2025-2030 ($ thousand)
Data Table on South Korea - Market size and forecast 2025-2030 ($ thousand)
Chart on South Korea - Year-over-year growth 2025-2030 (%)
Data Table on South Korea - Year-over-year growth 2025-2030 (%)

13.5.5 Australia - Market size and forecast 2025-2030

Chart on Australia - Market size and forecast 2025-2030 ($ thousand)
Data Table on Australia - Market size and forecast 2025-2030 ($ thousand)
Chart on Australia - Year-over-year growth 2025-2030 (%)
Data Table on Australia - Year-over-year growth 2025-2030 (%)

13.5.6 Indonesia - Market size and forecast 2025-2030

Chart on Indonesia - Market size and forecast 2025-2030 ($ thousand)
Data Table on Indonesia - Market size and forecast 2025-2030 ($ thousand)
Chart on Indonesia - Year-over-year growth 2025-2030 (%)
Data Table on Indonesia - Year-over-year growth 2025-2030 (%)

13.6 South America - Market size and forecast 2025-2030

Chart on South America - Market size and forecast 2025-2030 ($ thousand)
Data Table on South America - Market size and forecast 2025-2030 ($ thousand)
Chart on South America - Year-over-year growth 2025-2030 (%)
Data Table on South America - Year-over-year growth 2025-2030 (%)
Chart on Regional Comparison - South America
Data Table on Regional Comparison - South America

13.6.1 Brazil - Market size and forecast 2025-2030

Chart on Brazil - Market size and forecast 2025-2030 ($ thousand)
Data Table on Brazil - Market size and forecast 2025-2030 ($ thousand)
Chart on Brazil - Year-over-year growth 2025-2030 (%)
Data Table on Brazil - Year-over-year growth 2025-2030 (%)

13.6.2 Argentina - Market size and forecast 2025-2030

Chart on Argentina - Market size and forecast 2025-2030 ($ thousand)
Data Table on Argentina - Market size and forecast 2025-2030 ($ thousand)
Chart on Argentina - Year-over-year growth 2025-2030 (%)
Data Table on Argentina - Year-over-year growth 2025-2030 (%)

13.6.3 Chile - Market size and forecast 2025-2030

Chart on Chile - Market size and forecast 2025-2030 ($ thousand)
Data Table on Chile - Market size and forecast 2025-2030 ($ thousand)
Chart on Chile - Year-over-year growth 2025-2030 (%)
Data Table on Chile - Year-over-year growth 2025-2030 (%)

13.7 Middle East and Africa - Market size and forecast 2025-2030

Chart on Middle East and Africa - Market size and forecast 2025-2030 ($ thousand)
Data Table on Middle East and Africa - Market size and forecast 2025-2030 ($ thousand)
Chart on Middle East and Africa - Year-over-year growth 2025-2030 (%)
Data Table on Middle East and Africa - Year-over-year growth 2025-2030 (%)
Chart on Regional Comparison - Middle East and Africa
Data Table on Regional Comparison - Middle East and Africa

13.7.1 Saudi Arabia - Market size and forecast 2025-2030

Chart on Saudi Arabia - Market size and forecast 2025-2030 ($ thousand)
Data Table on Saudi Arabia - Market size and forecast 2025-2030 ($ thousand)
Chart on Saudi Arabia - Year-over-year growth 2025-2030 (%)
Data Table on Saudi Arabia - Year-over-year growth 2025-2030 (%)

13.7.2 UAE - Market size and forecast 2025-2030

Chart on UAE - Market size and forecast 2025-2030 ($ thousand)
Data Table on UAE - Market size and forecast 2025-2030 ($ thousand)
Chart on UAE - Year-over-year growth 2025-2030 (%)
Data Table on UAE - Year-over-year growth 2025-2030 (%)

13.7.3 Turkey - Market size and forecast 2025-2030

Chart on Turkey - Market size and forecast 2025-2030 ($ thousand)
Data Table on Turkey - Market size and forecast 2025-2030 ($ thousand)
Chart on Turkey - Year-over-year growth 2025-2030 (%)
Data Table on Turkey - Year-over-year growth 2025-2030 (%)

13.7.4 South Africa - Market size and forecast 2025-2030

Chart on South Africa - Market size and forecast 2025-2030 ($ thousand)
Data Table on South Africa - Market size and forecast 2025-2030 ($ thousand)
Chart on South Africa - Year-over-year growth 2025-2030 (%)
Data Table on South Africa - Year-over-year growth 2025-2030 (%)

13.7.5 Israel - Market size and forecast 2025-2030

Chart on Israel - Market size and forecast 2025-2030 ($ thousand)
Data Table on Israel - Market size and forecast 2025-2030 ($ thousand)
Chart on Israel - Year-over-year growth 2025-2030 (%)
Data Table on Israel - Year-over-year growth 2025-2030 (%)

13.8 Market opportunity by geography

Market opportunity by geography ($ thousand)
Data Tables on Market opportunity by geography ($ thousand)

14. Drivers, Challenges, and Opportunity

14.1 Market drivers

Growing consumer preference for low-oil cooking solutions
Increasing demand for convenient and time-efficient meal preparation
Expanding penetration of e-commerce driven kitchen appliance sales

14.2 Market challenges

Rising competition from multifunction cooking appliances
Volatility in electronic component and raw material procurement costs
Household discretionary spending pressure in price-sensitive economies

14.3 Impact of drivers and challenges

Impact of drivers and challenges in 2025 and 2030

14.4 Market opportunities

Advancing integration of smart connectivity and app-based cooking control
Growing premiumization through multifunction and larger-capacity product formats
Increasing adoption of AI-enabled automated cooking optimization

15. Competitive Landscape

15.1 Overview

15.2

Overview on criticality of inputs and factors of differentiation

15.3 Landscape disruption

Overview on factors of disruption

15.4 Industry risks

Impact of key risks on business

16. Competitive Analysis

16.1 Companies profiled

Companies covered

16.2 Company ranking index

16.3 Market positioning of companies

Matrix on companies position and classification

16.4 Bajaj Electricals Ltd.

Bajaj Electricals Ltd. - Overview
Bajaj Electricals Ltd. - Business segments
Bajaj Electricals Ltd. - Key offerings
Bajaj Electricals Ltd. - Segment focus
SWOT

16.5 Cuisinart

Cuisinart - Overview
Cuisinart - Product / Service
Cuisinart - Key offerings
SWOT

16.6 De Longhi S.p.A

De Longhi S.p.A - Overview
De Longhi S.p.A - Business segments
De Longhi S.p.A - Key offerings
De Longhi S.p.A - Segment focus
SWOT

16.7 Hamilton Beach

Hamilton Beach - Overview
Hamilton Beach - Business segments
Hamilton Beach - Key offerings
Hamilton Beach - Segment focus
SWOT

16.8 Havells India Ltd.

Havells India Ltd. - Overview
Havells India Ltd. - Business segments
Havells India Ltd. - Key offerings
Havells India Ltd. - Segment focus
SWOT

16.9 KENT RO Systems Ltd.

KENT RO Systems Ltd. - Overview
KENT RO Systems Ltd. - Product / Service
KENT RO Systems Ltd. - Key offerings
SWOT

16.10 Midea Group Co. Ltd.

Midea Group Co. Ltd. - Overview
Midea Group Co. Ltd. - Business segments
Midea Group Co. Ltd. - Key news
Midea Group Co. Ltd. - Key offerings
Midea Group Co. Ltd. - Segment focus
SWOT

16.11 Panasonic Holdings Corp.

Panasonic Holdings Corp. - Overview
Panasonic Holdings Corp. - Business segments
Panasonic Holdings Corp. - Key news
Panasonic Holdings Corp. - Key offerings
Panasonic Holdings Corp. - Segment focus
SWOT

16.12 SharkNinja Operating LLC

SharkNinja Operating LLC - Overview
SharkNinja Operating LLC - Business segments
SharkNinja Operating LLC - Key offerings
SharkNinja Operating LLC - Segment focus
SWOT

16.13 Stove Kraft Ltd.

Stove Kraft Ltd. - Overview
Stove Kraft Ltd. - Product / Service
Stove Kraft Ltd. - Key offerings
SWOT

16.14 Tefal

Tefal - Overview
Tefal - Product / Service
Tefal - Key offerings
SWOT

16.15 The Black and Decker

The Black and Decker - Overview
The Black and Decker - Product / Service
The Black and Decker - Key offerings
SWOT

16.16 TTK Prestige Ltd.

TTK Prestige Ltd. - Overview
TTK Prestige Ltd. - Product / Service
TTK Prestige Ltd. - Key offerings
SWOT

16.17 Versuni Netherlands B.V.

Versuni Netherlands B.V. - Overview
Versuni Netherlands B.V. - Product / Service
Versuni Netherlands B.V. - Key offerings
SWOT

16.18 Xiaomi Corp.

Xiaomi Corp. - Overview
Xiaomi Corp. - Business segments
Xiaomi Corp. - Key offerings
Xiaomi Corp. - Segment focus
SWOT

17. Appendix

17.1 Scope of the report

Market definition
Objectives
Notes and caveats

17.2 Inclusions and exclusions checklist

Inclusions checklist
Exclusions checklist

17.3 Currency conversion rates for US$

17.4 Research methodology

17.5 Data procurement

Information sources

17.6 Data validation

17.7 Validation techniques employed for market sizing

17.8 Data synthesis

17.9 360 degree market analysis

17.10 List of abbreviations

Research Methodology

Technavio presents a detailed picture of the market by way of study, synthesis, and summation of data from multiple sources. The analysts have presented the various facets of the market with a particular focus on identifying the key industry influencers. The data thus presented is comprehensive, reliable, and the result of extensive research, both primary and secondary.

INFORMATION SOURCES

Primary sources

  • Manufacturers and suppliers
  • Channel partners
  • Industry experts
  • Strategic decision makers

Secondary sources

  • Industry journals and periodicals
  • Government data
  • Financial reports of key industry players
  • Historical data
  • Press releases

DATA ANALYSIS

Data Synthesis

  • Collation of data
  • Estimation of key figures
  • Analysis of derived insights

Data Validation

  • Triangulation with data models
  • Reference against proprietary databases
  • Corroboration with industry experts

REPORT WRITING

Qualitative

  • Market drivers
  • Market challenges
  • Market trends
  • Five forces analysis

Quantitative

  • Market size and forecast
  • Market segmentation
  • Geographical insights
  • Competitive landscape

Interested in this report?

Get your sample now to see our research methodology and insights!

Download Now

Frequently Asked Questions

Air Fryer market growth will increase by USD 566255.1 thousand thousand during 2026-2030.

The Air Fryer market is expected to grow at a CAGR of 8.4% during 2026-2030.

Air Fryer market is segmented by Product (Digital air fryer, Manual air fryer) Distribution channel (Offline, Online) Capacity (Up to 4 liters, Between 4 to 6 liters, Between 6 to 8 liters, Above 8 liters) Application (Residential, Commercial)

Bajaj Electricals Ltd., CHEFMAN, COSORI, Cuisinart, De Longhi S.p.A, Franke Faber India Pvt. Ltd., Glen Appliances Pvt. Ltd., Hamilton Beach, Havells India Ltd., KENT RO Systems Ltd., Midea Group Co. Ltd., Oster, Panasonic Holdings Corp., SharkNinja Operating LLC, StoreBound LLC, Stove Kraft Ltd., Tefal, The Black and Decker, TTK Prestige Ltd., Usha International Ltd., Versuni Netherlands B.V., Wonderchef Home Appliance Ltd., Xiaomi Corp. are a few of the key vendors in the Air Fryer market.

APAC will register the highest growth rate of 33.7% among the other regions. Therefore, the Air Fryer market in APAC is expected to garner significant business opportunities for the vendors during the forecast period.

US, Canada, Mexico, Germany, UK, France, Italy, Spain, The Netherlands, China, Japan, India, South Korea, Australia, Indonesia, Brazil, Argentina, Chile, Saudi Arabia, UAE, Turkey, South Africa, Israel

  • Growing consumer preference for low-oil cooking solutions is the driving factor this market.

The Air Fryer market vendors should focus on grabbing business opportunities from the Product segment as it accounted for the largest market share in the base year.
RIA - Research AI Assistant
Ask RIA
