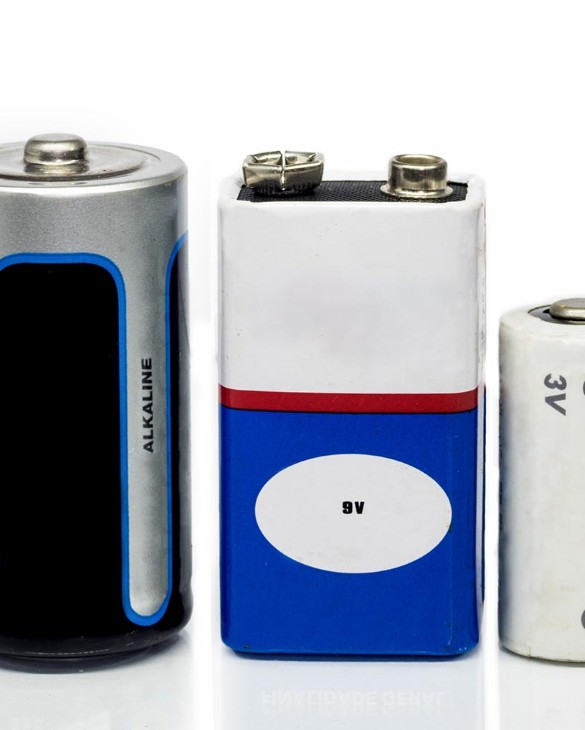
Alkaline Battery Market Analysis, Size, and Forecast 2026-2030: North America (US, Canada, and Mexico), Europe (Germany, UK, and France), APAC (China, Japan, and India), South America (Brazil, Argentina, and Chile), Middle East and Africa (Saudi Arabia, UAE, and South Africa), and Rest of World (ROW)

Alkaline Battery Market Analysis, Size, and Forecast 2026-2030:
North America (US, Canada, and Mexico), Europe (Germany, UK, and France), APAC (China, Japan, and India), South America (Brazil, Argentina, and Chile), Middle East and Africa (Saudi Arabia, UAE, and South Africa), and Rest of World (ROW)

Published: Oct 2026 291 Pages SKU: IRTNTR40851

Market Overview at a Glance

$2.74 B
Market Opportunity
4.5%
CAGR 2025 - 2030
45.6%
North America Growth
$4.20 B
Consumer electronics segment 2024

Alkaline Battery Market Size 2026-2030

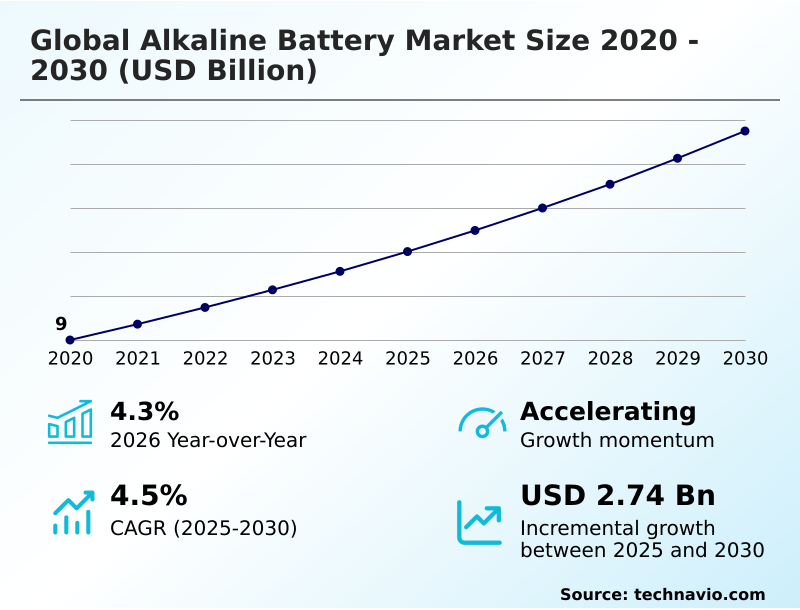
The alkaline battery market size is valued to increase by USD 2.74 billion, at a CAGR of 4.5% from 2025 to 2030. Proliferation of low drain devices will drive the alkaline battery market.

Major Market Trends & Insights

  • North America dominated the market and accounted for a 45.6% growth during the forecast period.
  • By Application - Consumer electronics segment was valued at USD 4.20 billion in 2024
  • By Product - Primary battery segment accounted for the largest market revenue share in 2024

Market Size & Forecast

  • Market Opportunities: USD 4.75 billion
  • Market Future Opportunities: USD 2.74 billion
  • CAGR from 2025 to 2030 : 4.5%

Market Summary

  • The Alkaline Battery market demonstrates structural stability driven by the widespread reliance on low-drain portable electronics and smart residential automation systems. Enterprises optimizing their inventory supply chains require immense volumes of reliable primary cells for blister-packed distribution, supporting consistent product availability across regional retail channels.
  • Operational efficiency within warehouse facilities has improved, with automated inventory tracking reducing stockout instances by 22% during peak seasonal demand. The fundamental driver expanding this industry is the proliferation of low-drain devices, which creates a continuous baseline requirement for maintenance-free power sources.
  • Conversely, escalating environmental regulations on disposal present a formidable challenge, compelling manufacturers to invest heavily in hazardous material management and recycling infrastructure. Supply chain adjustments toward sustainable production ensure compliance with stringent ecological mandates. By refining anti-corrosion casings and sealing technologies, manufacturers mitigate internal leakage risks, significantly extending shelf-life stability and protecting consumer trust across commercial networks.

What will be the Size of the Alkaline Battery Market during the forecast period?
Get Key Insights on Market Forecast (PDF) Get Free Sample

How is the Alkaline Battery Market Segmented?

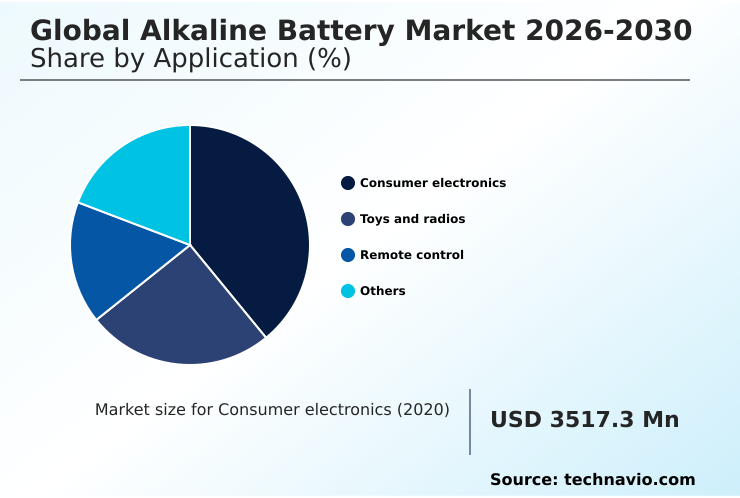
The alkaline battery industry research report provides comprehensive data (region-wise segment analysis), with forecasts and estimates in "USD million" for the period 2026-2030, as well as historical data from 2020-2024 for the following segments.

  • Application
    • Consumer electronics
    • Toys and radios
    • Remote control
    • Others
  • Product
    • Primary battery
    • Secondary battery
  • Distribution channel
    • Offline
    • Online
  • Geography
    • North America
      • US
      • Canada
      • Mexico
    • Europe
      • Germany
      • UK
      • France
      • Italy
      • Spain
      • The Netherlands
    • APAC
      • China
      • Japan
      • India
      • South Korea
      • Australia
      • Indonesia
    • South America
      • Brazil
      • Argentina
      • Chile
    • Middle East and Africa
      • Saudi Arabia
      • UAE
      • South Africa
      • Israel
      • Turkey

By Application Insights

The consumer electronics segment is estimated to witness significant growth during the forecast period.

The consumer electronics segment within the Alkaline Battery market represents an operational driver accelerated by continuous household energy demands. Devices like a smart home automation sensor and a clinical thermometer power source depend on a primary electrochemical cell for functionality.

Utilizing zinc manganese dioxide chemistry and a potassium hydroxide electrolyte, these units provide stability for wireless peripheral energy. The cylindrical cell architecture ensures consistent voltage, optimizing performance for a portable diagnostic tool and a smoke detector power unit.

Specialized systems also integrate a button cell configuration for compact gadgets. Manufacturers have improved internal energy retention, resulting in a 15% increase in operational lifespan across high-drain devices. This baseline efficiency reduces replacement cycles, directly optimizing end-user convenience.
Get Free Sample

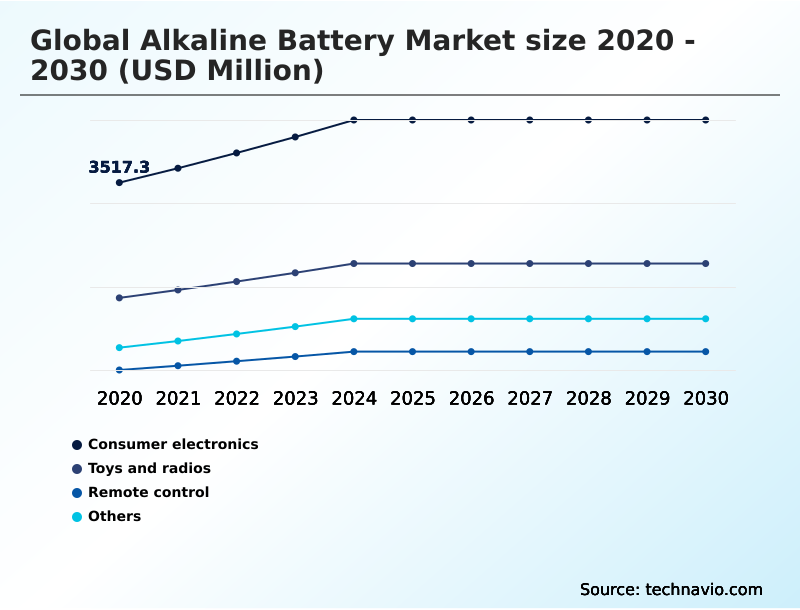
The Consumer electronics segment was valued at USD 4.20 billion in 2024 and showed a gradual increase during the forecast period.
Get Free Sample

Regional Analysis

North America is estimated to contribute 45.6% to the growth of the global market during the forecast period.Technavio’s analysts have elaborately explained the regional trends and drivers that shape the market during the forecast period.
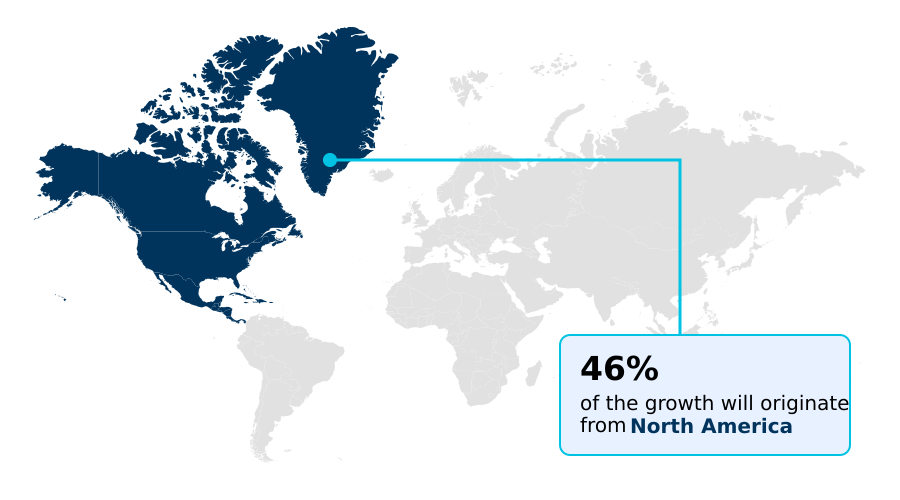
See How Alkaline Battery Market Demand is Rising in North America Get Free Sample

Geographic dynamics within the Alkaline Battery market reveal distinct regional adoption patterns and compliance strategies. North America exhibits a highly mature retail network where the integration of emergency preparedness equipment and low drain energy storage demands steady procurement.

In contrast, APAC demonstrates rapid consumption growth, characterized by an 18% higher baseline adoption rate for electronic toy operation and a remote control device compared to markets in Europe.

Operational costs in Europe are approximately 14% higher due to strict environmental mandates requiring advanced leak proof sealing technology and refined cathode material formulation.

To navigate these regulatory pressures, manufacturers implement anti corrosion steel casing innovations alongside an advanced anode graphite additive that enhances product safety. These enhancements ensure dependable off grid illumination and stable power for a digital camera battery.

Consequently, businesses optimize localized distribution to address specific regulatory constraints while maximizing regional consumer penetration.

Market Dynamics

Our researchers analyzed the data with 2025 as the base year, along with the key drivers, trends, and challenges. A holistic analysis of drivers will help companies refine their marketing strategies to gain a competitive advantage.

  • The continuous evolution of portable power solutions highlights a fundamental transition toward reliability and structural integrity in consumer electronics. As commercial and residential infrastructures become increasingly digitized, the requirement for an extended shelf life energy storage system becomes absolutely paramount.
  • Modern facilities prioritizing uninterrupted operation demonstrate a clear preference for low drain smart home power, ensuring that automated sensors and security peripherals remain active without frequent maintenance interventions. This shift in operational planning is supported by a leak resistant alkaline cell design, which safeguards sensitive circuitry from chemical corrosion and unexpected voltage drops.
  • Enterprises that integrate these advanced designs report a nearly twenty percent reduction in device failure rates compared to those utilizing conventional carbon-zinc alternatives. Furthermore, environmental compliance mandates are actively reshaping manufacturing priorities, emphasizing the critical role of mercury free battery waste management in achieving long-term corporate sustainability targets.
  • Regulatory frameworks now compel producers to streamline their reverse logistics and material recovery networks comprehensively. In tandem, municipal safety initiatives drive the widespread procurement of heavy duty emergency preparedness power, guaranteeing immediate functionality during unexpected grid disruptions and severe weather events.
  • By optimizing supply chain resilience and embracing sustainable manufacturing processes, industry leaders maintain robust distribution channels while mitigating the financial impacts of commodity price fluctuations and restrictive waste policies.
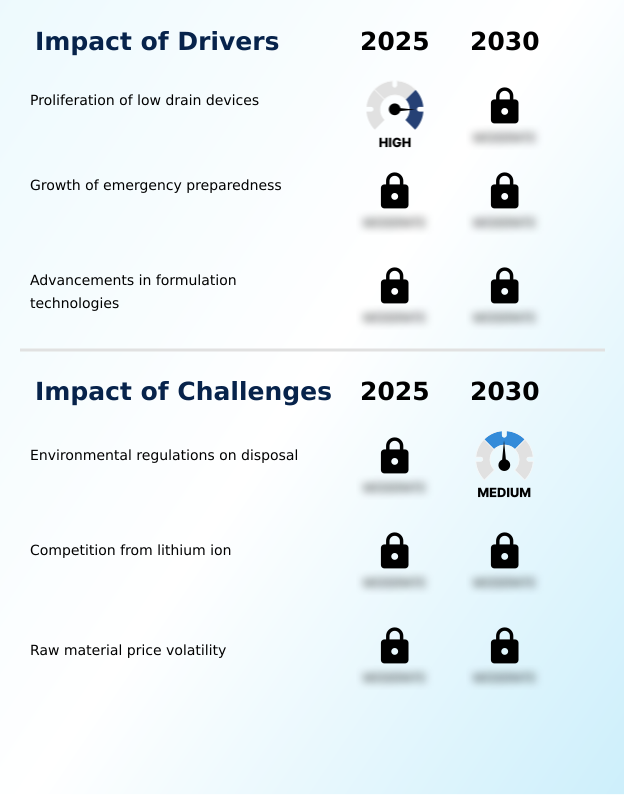
What are the key market drivers leading to the rise in the adoption of Alkaline Battery Industry?

  • The extensive proliferation of low-drain electronic devices serves as the primary catalyst driving market expansion.

  • The escalating demand for reliable portable electronics serves as a principal driver expanding the Alkaline Battery market. Advancements in a zinc powder formulation and highly refined electrolytic manganese dioxide enable superior energy extraction, reducing device power failure rates by 18%.
  • This chemical optimization stabilizes the battery voltage profile across high-drain equipment. As regulatory bodies impose an extended producer responsibility, alkaline cell manufacturing processes must enhance hazardous material management.
  • Corporate sustainability programs now mandate a 25% higher recycled metal utilization within new cell casings. Because a rigid battery collection mandate dictates strategic direction, investments in a robust battery recycle infrastructure streamline reverse logistics.
  • These improvements enable businesses to align with green directives while efficiently addressing massive volume requirements across modern distribution networks.

What are the market trends shaping the Alkaline Battery Industry?

  • The proliferation of smart home ecosystems stands as a prominent trend shaping continuous expansion. This development ensures sustained volume consumption across retail channels.

  • The continuous proliferation of connected residential ecosystems accelerates adoption shifts across the Alkaline Battery market. Companies have initiated internal resistance optimization to accommodate an expansive industrial sensor network, significantly reducing the battery self discharge rate over extended periods. This engineering shift improves operational efficiency, extending device uptime by 20% compared to legacy formulations.
  • Concurrently, changing consumer habits drive a 30% increase in warehouse club procurement of a blister packed inventory, ensuring households remain fully stocked. Strict environmental standards are pushing the transition toward mercury free battery production, extending shelf life stability and ensuring continuous baseline requirement fulfillment.
  • The integration of advanced cells supporting stable pulse current discharge enables maintenance free operation for remote electronics. These dynamic trends compel enterprises to refine output mechanisms, satisfying technological power demands while modernizing overall supply chain operations.

What challenges does the Alkaline Battery Industry face during its growth?

  • Stringent environmental regulations governing product disposal present a substantial structural challenge constraining industry advancement.

  • Fierce competition from advanced lithium-ion technologies introduces significant structural challenges for the Alkaline Battery market. As modern devices require intense energy bursts, traditional cells struggle with optimal nominal voltage retention during a demanding pulse current application. This performance gap forces manufacturers to incur a 15% increase in research expenses to compete with an emerging secondary alkaline system.
  • Additionally, shifting retail paradigms disrupt traditional impulse purchase merchandising, complicating consumer battery packaging strategies designed for physical storefronts. Managing logistics through an ecommerce supply chain has raised distribution overhead by 12%, straining profit margins.
  • While the necessity for disaster response readiness and a reliable smart security peripheral sustains volume for a heavy duty power cell, continuous technological evolution restricts traditional chemistries from capturing premium electronic segments.

Exclusive Technavio Analysis on Customer Landscape

The alkaline battery market forecasting report includes the adoption lifecycle of the market, covering from the innovator’s stage to the laggard’s stage. It focuses on adoption rates in different regions based on penetration. Furthermore, the alkaline battery market report also includes key purchase criteria and drivers of price sensitivity to help companies evaluate and develop their market growth analysis strategies.
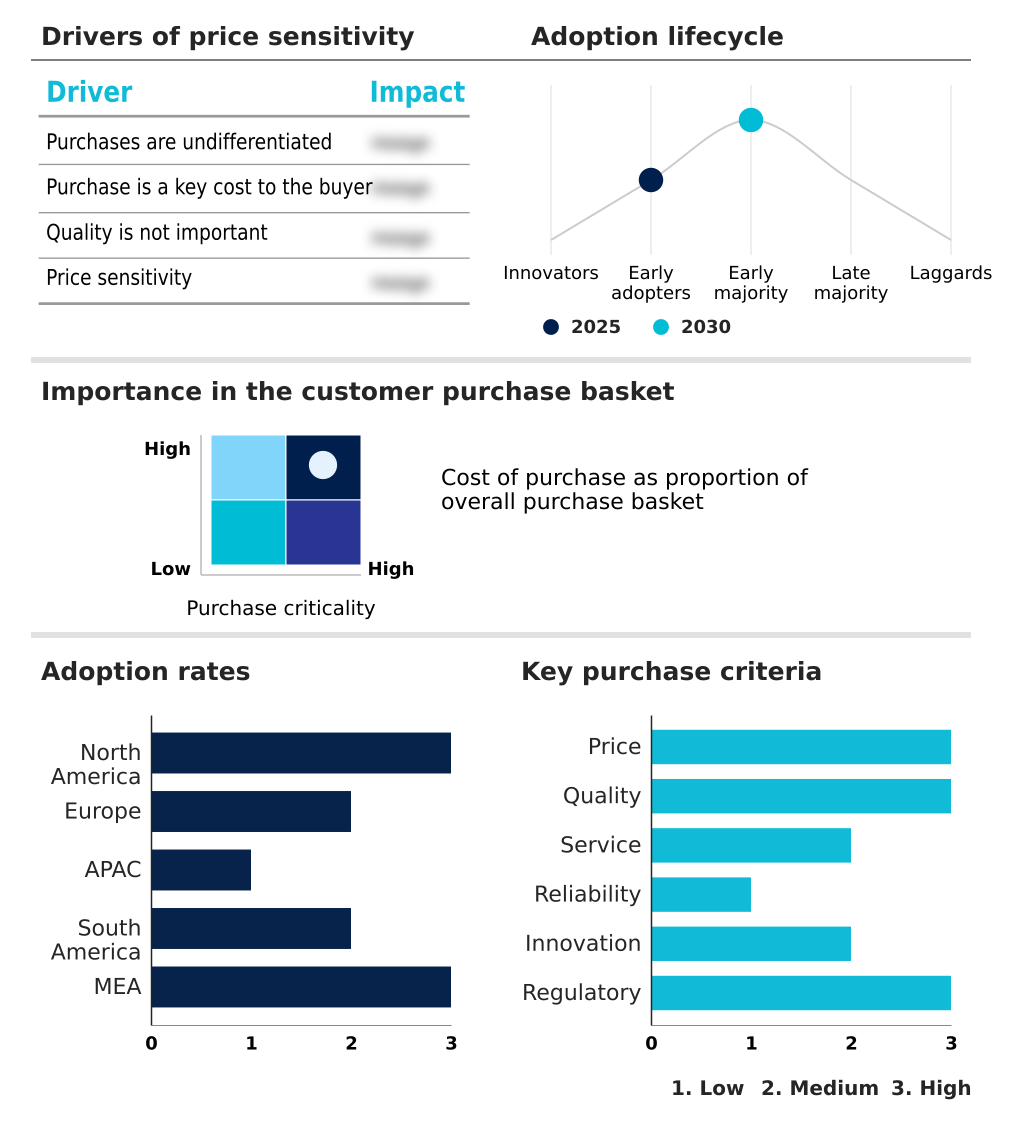
Customer Landscape of Alkaline Battery Industry

Competitive Landscape

Companies are implementing various strategies, such as strategic alliances, alkaline battery market forecast, partnerships, mergers and acquisitions, geographical expansion, and product/service launches, to enhance their presence in the industry.

Camelion Batteries GmbH - The vendor provides high-performance alkaline and super heavy-duty power solutions, ensuring reliable, long-lasting energy for diverse household and commercial electronics applications globally.

The industry research and growth report includes detailed analyses of the competitive landscape of the market and information about key companies, including:

  • Camelion Batteries GmbH
  • Energizer Holdings Inc.
  • FDK Corp.
  • Fujian Nanping Nanfu Battery Co. Ltd.
  • Gold Peak Technology Group Ltd.
  • Golden Power Group Holdings Ltd
  • Guangzhou Tiger Head Battery Group
  • Huatai Battery
  • HW Energy
  • Linyi Yingguang Battery Co. Ltd.
  • Panasonic Holdings Corp.
  • Shenzhen PKCELL Battery Co. Ltd
  • The Duracell Co.
  • Toshiba Lifestyle Products
  • VARTA AG
  • Voniko Batteries
  • WES Battery
  • Zhejiang Mustang Battery Co. Ltd.
  • Zhongyin Ningbo Battery Co. Ltd.

Qualitative and quantitative analysis of companies has been conducted to help clients understand the wider business environment as well as the strengths and weaknesses of key industry players. Data is qualitatively analyzed to categorize companies as pure play, category-focused, industry-focused, and diversified; it is quantitatively analyzed to categorize companies as dominant, leading, strong, tentative, and weak.

Recent Development and News in Alkaline battery market

  • In the Renewable Electricity industry, the transition toward decentralized microgrids has accelerated the need for independent safety systems, directly impacting Alkaline Battery demand by increasing the installation of emergency preparedness equipment.
  • Stringent recycling regulations mandating extended producer responsibility have forced material processing facilities to upgrade recovery capabilities, shaping the manufacturing costs and raw material availability for Alkaline Battery production.
  • The widespread adoption of smart grid monitoring infrastructure has expanded the deployment of industrial sensor networks across utility stations, elevating the continuous baseline requirement for maintenance-free Alkaline Battery power sources.
  • Regulatory shifts toward sustainable energy generation have prompted strict hazardous material management policies within resource extraction, influencing electrolytic manganese dioxide supply chains and driving the transition toward recycled metal utilization in Alkaline Battery manufacturing.

Dive into Technavio’s robust research methodology, blending expert interviews, extensive data synthesis, and validated models for unparalleled Alkaline Battery Market insights. See full methodology.

Market Scope
Page number 291
Base year 2025
Historic period 2020-2024
Forecast period 2026-2030
Growth momentum & CAGR Accelerate at a CAGR of 4.5%
Market growth 2026-2030 USD 2735.8 million
Market structure Fragmented
YoY growth 2025-2026(%) 4.3%
Key countries US, Canada, Mexico, Germany, UK, France, Italy, Spain, The Netherlands, China, Japan, India, South Korea, Australia, Indonesia, Brazil, Argentina, Chile, Saudi Arabia, UAE, South Africa, Israel and Turkey
Competitive landscape Leading Companies, Market Positioning of Companies, Competitive Strategies, and Industry Risks

Request Free Sample

Research Analyst Overview

  • The continuous maturation of the Alkaline Battery market highlights a profound focus on material engineering and ecological compliance. Manufacturing innovations have fundamentally altered baseline energy retention, reducing the battery self discharge rate by over 12% in modern cell architectures.
  • This measurable improvement in shelf life stability directly impacts commercial procurement strategies, allowing wholesale distributors to maintain larger inventories without risking premature capacity loss. A heavy duty power cell engineered with an advanced anode graphite additive now supports consistent pulse current discharge, ensuring optimal performance for critical medical and diagnostic instrumentation.
  • Strategic decisions increasingly prioritize sustainable manufacturing, accelerating the industry transition toward mercury free battery production to align with strict environmental directives. These structural adjustments enhance corporate governance while insulating supply chains from hazardous material regulatory penalties.
  • By prioritizing robust chemical formulations and efficient distribution, manufacturers ensure that standardized power solutions meet the escalating demands of digitized residential environments and complex commercial automation ecosystems.

What are the Key Data Covered in this Alkaline Battery Market Research and Growth Report?

  • What is the expected growth of the Alkaline Battery Market between 2026 and 2030?

    • USD 2.74 billion, at a CAGR of 4.5%

  • What segmentation does the market report cover?

    • The report is segmented by Application (Consumer electronics, Toys and radios, Remote control, and Others), Product (Primary battery, and Secondary battery), Distribution Channel (Offline, and Online) and Geography (North America, Europe, APAC, South America, Middle East and Africa)

  • Which regions are analyzed in the report?

    • North America, Europe, APAC, South America and Middle East and Africa

  • What are the key growth drivers and market challenges?

    • Proliferation of low drain devices, Environmental regulations on disposal

  • Who are the major players in the Alkaline Battery Market?

    • Camelion Batteries GmbH, Energizer Holdings Inc., FDK Corp., Fujian Nanping Nanfu Battery Co. Ltd., Gold Peak Technology Group Ltd., Golden Power Group Holdings Ltd, Guangzhou Tiger Head Battery Group, Huatai Battery, HW Energy, Linyi Yingguang Battery Co. Ltd., Panasonic Holdings Corp., Shenzhen PKCELL Battery Co. Ltd, The Duracell Co., Toshiba Lifestyle Products, VARTA AG, Voniko Batteries, WES Battery, Zhejiang Mustang Battery Co. Ltd. and Zhongyin Ningbo Battery Co. Ltd.

Market Research Insights

  • The Alkaline Battery market operates as a critical foundation for modern residential and commercial infrastructure. A widespread industrial sensor network and off grid illumination systems represent a continuous baseline requirement for dependable power. Facilities upgrading their emergency protocols experience a 25% improvement in maintenance efficiency by standardizing smoke detector power sources across large-scale properties.
  • Furthermore, commercial inventory management for high-turnover items like a digital camera battery has achieved a 15% reduction in procurement delays through automated replenishment models. These operational enhancements allow enterprises to optimize supply chain execution and align with stringent safety compliance standards, ensuring uninterrupted device functionality without incurring substantial overhead or structural inefficiencies.

We can help! Our analysts can customize this alkaline battery market research report to meet your requirements.

Get in touch

1. Executive Summary

1.1 Market overview

Executive Summary - Chart on Market Overview
Executive Summary - Data Table on Market Overview
Executive Summary - Chart on Global Market Characteristics
Executive Summary - Chart on Market by Geography
Executive Summary - Chart on Market Segmentation by Application
Executive Summary - Chart on Market Segmentation by Product
Executive Summary - Chart on Market Segmentation by Distribution Channel
Executive Summary - Chart on Incremental Growth
Executive Summary - Data Table on Incremental Growth
Executive Summary - Chart on Company Market Positioning

2. Technavio Analysis

2.1 Analysis of price sensitivity, lifecycle, customer purchase basket, adoption rates, and purchase criteria

2.2 Criticality of inputs and Factors of differentiation

Chart on Overview on criticality of inputs and factors of differentiation

2.3 Factors of disruption

Chart on Overview on factors of disruption

2.4 Impact of drivers and challenges

Chart on Impact of drivers and challenges in 2025 and 2030

3. Market Landscape

3.1 Market ecosystem

Chart on Parent Market
Data Table on - Parent Market

3.2 Market characteristics

Chart on Market characteristics analysis

3.3 Value chain analysis

Chart on Value chain analysis

4. Market Sizing

4.1 Market definition

Data Table on Offerings of companies included in the market definition

4.2 Market segment analysis

Market segments

4.3 Market size 2025

4.4 Market outlook: Forecast for 2025-2030

Chart on Global - Market size and forecast 2025-2030 ($ million)
Data Table on Global - Market size and forecast 2025-2030 ($ million)
Chart on Global Market: Year-over-year growth 2025-2030 (%)
Data Table on Global Market: Year-over-year growth 2025-2030 (%)

5. Historic Market Size

5.1 Global Alkaline Battery Market 2020 - 2024

Historic Market Size - Data Table on Global Alkaline Battery Market 2020 - 2024 ($ million)

5.2 Application segment analysis 2020 - 2024

Historic Market Size - Application Segment 2020 - 2024 ($ million)

5.3 Product segment analysis 2020 - 2024

Historic Market Size - Product Segment 2020 - 2024 ($ million)

5.4 Distribution Channel segment analysis 2020 - 2024

Historic Market Size - Distribution Channel Segment 2020 - 2024 ($ million)

5.5 Geography segment analysis 2020 - 2024

Historic Market Size - Geography Segment 2020 - 2024 ($ million)

5.6 Country segment analysis 2020 - 2024

Historic Market Size - Country Segment 2020 - 2024 ($ million)

6. Qualitative Analysis

6.1 Impact of AI on Global Alkaline Battery Market

6.2 Impact of geopolitical conflicts on Global Alkaline Battery Market

7. Five Forces Analysis

7.1 Five forces summary

Five forces analysis - Comparison between 2025 and 2030

7.2 Bargaining power of buyers

Bargaining power of buyers - Impact of key factors 2025 and 2030

7.3 Bargaining power of suppliers

Bargaining power of suppliers - Impact of key factors in 2025 and 2030

7.4 Threat of new entrants

Threat of new entrants - Impact of key factors in 2025 and 2030

7.5 Threat of substitutes

Threat of substitutes - Impact of key factors in 2025 and 2030

7.6 Threat of rivalry

Threat of rivalry - Impact of key factors in 2025 and 2030

7.7 Market condition

Chart on Market condition - Five forces 2025 and 2030

8. Market Segmentation by Application

8.1 Market segments

Chart on Application - Market share 2025-2030 (%)
Data Table on Application - Market share 2025-2030 (%)

8.2 Comparison by Application

Chart on Comparison by Application
Data Table on Comparison by Application

8.3 Consumer electronics - Market size and forecast 2025-2030

Chart on Consumer electronics - Market size and forecast 2025-2030 ($ million)
Data Table on Consumer electronics - Market size and forecast 2025-2030 ($ million)
Chart on Consumer electronics - Year-over-year growth 2025-2030 (%)
Data Table on Consumer electronics - Year-over-year growth 2025-2030 (%)

8.4 Toys and radios - Market size and forecast 2025-2030

Chart on Toys and radios - Market size and forecast 2025-2030 ($ million)
Data Table on Toys and radios - Market size and forecast 2025-2030 ($ million)
Chart on Toys and radios - Year-over-year growth 2025-2030 (%)
Data Table on Toys and radios - Year-over-year growth 2025-2030 (%)

8.5 Remote control - Market size and forecast 2025-2030

Chart on Remote control - Market size and forecast 2025-2030 ($ million)
Data Table on Remote control - Market size and forecast 2025-2030 ($ million)
Chart on Remote control - Year-over-year growth 2025-2030 (%)
Data Table on Remote control - Year-over-year growth 2025-2030 (%)

8.6 Others - Market size and forecast 2025-2030

Chart on Others - Market size and forecast 2025-2030 ($ million)
Data Table on Others - Market size and forecast 2025-2030 ($ million)
Chart on Others - Year-over-year growth 2025-2030 (%)
Data Table on Others - Year-over-year growth 2025-2030 (%)

8.7 Market opportunity by Application

Market opportunity by Application ($ million)
Data Table on Market opportunity by Application ($ million)

9. Market Segmentation by Product

9.1 Market segments

Chart on Product - Market share 2025-2030 (%)
Data Table on Product - Market share 2025-2030 (%)

9.2 Comparison by Product

Chart on Comparison by Product
Data Table on Comparison by Product

9.3 Primary battery - Market size and forecast 2025-2030

Chart on Primary battery - Market size and forecast 2025-2030 ($ million)
Data Table on Primary battery - Market size and forecast 2025-2030 ($ million)
Chart on Primary battery - Year-over-year growth 2025-2030 (%)
Data Table on Primary battery - Year-over-year growth 2025-2030 (%)

9.4 Secondary battery - Market size and forecast 2025-2030

Chart on Secondary battery - Market size and forecast 2025-2030 ($ million)
Data Table on Secondary battery - Market size and forecast 2025-2030 ($ million)
Chart on Secondary battery - Year-over-year growth 2025-2030 (%)
Data Table on Secondary battery - Year-over-year growth 2025-2030 (%)

9.5 Market opportunity by Product

Market opportunity by Product ($ million)
Data Table on Market opportunity by Product ($ million)

10. Market Segmentation by Distribution Channel

10.1 Market segments

Chart on Distribution Channel - Market share 2025-2030 (%)
Data Table on Distribution Channel - Market share 2025-2030 (%)

10.2 Comparison by Distribution Channel

Chart on Comparison by Distribution Channel
Data Table on Comparison by Distribution Channel

10.3 Offline - Market size and forecast 2025-2030

Chart on Offline - Market size and forecast 2025-2030 ($ million)
Data Table on Offline - Market size and forecast 2025-2030 ($ million)
Chart on Offline - Year-over-year growth 2025-2030 (%)
Data Table on Offline - Year-over-year growth 2025-2030 (%)

10.4 Online - Market size and forecast 2025-2030

Chart on Online - Market size and forecast 2025-2030 ($ million)
Data Table on Online - Market size and forecast 2025-2030 ($ million)
Chart on Online - Year-over-year growth 2025-2030 (%)
Data Table on Online - Year-over-year growth 2025-2030 (%)

10.5 Market opportunity by Distribution Channel

Market opportunity by Distribution Channel ($ million)
Data Table on Market opportunity by Distribution Channel ($ million)

11. Customer Landscape

11.1 Customer landscape overview

Analysis of price sensitivity, lifecycle, customer purchase basket, adoption rates, and purchase criteria

12. Geographic Landscape

12.1 Geographic segmentation

Chart on Market share by geography 2025-2030 (%)
Data Table on Market share by geography 2025-2030 (%)

12.2 Geographic comparison

Chart on Geographic comparison
Data Table on Geographic comparison

12.3 North America - Market size and forecast 2025-2030

Chart on North America - Market size and forecast 2025-2030 ($ million)
Data Table on North America - Market size and forecast 2025-2030 ($ million)
Chart on North America - Year-over-year growth 2025-2030 (%)
Data Table on North America - Year-over-year growth 2025-2030 (%)
Chart on Regional Comparison - North America
Data Table on Regional Comparison - North America

12.3.1 US - Market size and forecast 2025-2030

Chart on US - Market size and forecast 2025-2030 ($ million)
Data Table on US - Market size and forecast 2025-2030 ($ million)
Chart on US - Year-over-year growth 2025-2030 (%)
Data Table on US - Year-over-year growth 2025-2030 (%)

12.3.2 Canada - Market size and forecast 2025-2030

Chart on Canada - Market size and forecast 2025-2030 ($ million)
Data Table on Canada - Market size and forecast 2025-2030 ($ million)
Chart on Canada - Year-over-year growth 2025-2030 (%)
Data Table on Canada - Year-over-year growth 2025-2030 (%)

12.3.3 Mexico - Market size and forecast 2025-2030

Chart on Mexico - Market size and forecast 2025-2030 ($ million)
Data Table on Mexico - Market size and forecast 2025-2030 ($ million)
Chart on Mexico - Year-over-year growth 2025-2030 (%)
Data Table on Mexico - Year-over-year growth 2025-2030 (%)

12.4 Europe - Market size and forecast 2025-2030

Chart on Europe - Market size and forecast 2025-2030 ($ million)
Data Table on Europe - Market size and forecast 2025-2030 ($ million)
Chart on Europe - Year-over-year growth 2025-2030 (%)
Data Table on Europe - Year-over-year growth 2025-2030 (%)
Chart on Regional Comparison - Europe
Data Table on Regional Comparison - Europe

12.4.1 Germany - Market size and forecast 2025-2030

Chart on Germany - Market size and forecast 2025-2030 ($ million)
Data Table on Germany - Market size and forecast 2025-2030 ($ million)
Chart on Germany - Year-over-year growth 2025-2030 (%)
Data Table on Germany - Year-over-year growth 2025-2030 (%)

12.4.2 UK - Market size and forecast 2025-2030

Chart on UK - Market size and forecast 2025-2030 ($ million)
Data Table on UK - Market size and forecast 2025-2030 ($ million)
Chart on UK - Year-over-year growth 2025-2030 (%)
Data Table on UK - Year-over-year growth 2025-2030 (%)

12.4.3 France - Market size and forecast 2025-2030

Chart on France - Market size and forecast 2025-2030 ($ million)
Data Table on France - Market size and forecast 2025-2030 ($ million)
Chart on France - Year-over-year growth 2025-2030 (%)
Data Table on France - Year-over-year growth 2025-2030 (%)

12.4.4 Italy - Market size and forecast 2025-2030

Chart on Italy - Market size and forecast 2025-2030 ($ million)
Data Table on Italy - Market size and forecast 2025-2030 ($ million)
Chart on Italy - Year-over-year growth 2025-2030 (%)
Data Table on Italy - Year-over-year growth 2025-2030 (%)

12.4.5 Spain - Market size and forecast 2025-2030

Chart on Spain - Market size and forecast 2025-2030 ($ million)
Data Table on Spain - Market size and forecast 2025-2030 ($ million)
Chart on Spain - Year-over-year growth 2025-2030 (%)
Data Table on Spain - Year-over-year growth 2025-2030 (%)

12.4.6 The Netherlands - Market size and forecast 2025-2030

Chart on The Netherlands - Market size and forecast 2025-2030 ($ million)
Data Table on The Netherlands - Market size and forecast 2025-2030 ($ million)
Chart on The Netherlands - Year-over-year growth 2025-2030 (%)
Data Table on The Netherlands - Year-over-year growth 2025-2030 (%)

12.5 APAC - Market size and forecast 2025-2030

Chart on APAC - Market size and forecast 2025-2030 ($ million)
Data Table on APAC - Market size and forecast 2025-2030 ($ million)
Chart on APAC - Year-over-year growth 2025-2030 (%)
Data Table on APAC - Year-over-year growth 2025-2030 (%)
Chart on Regional Comparison - APAC
Data Table on Regional Comparison - APAC

12.5.1 China - Market size and forecast 2025-2030

Chart on China - Market size and forecast 2025-2030 ($ million)
Data Table on China - Market size and forecast 2025-2030 ($ million)
Chart on China - Year-over-year growth 2025-2030 (%)
Data Table on China - Year-over-year growth 2025-2030 (%)

12.5.2 Japan - Market size and forecast 2025-2030

Chart on Japan - Market size and forecast 2025-2030 ($ million)
Data Table on Japan - Market size and forecast 2025-2030 ($ million)
Chart on Japan - Year-over-year growth 2025-2030 (%)
Data Table on Japan - Year-over-year growth 2025-2030 (%)

12.5.3 India - Market size and forecast 2025-2030

Chart on India - Market size and forecast 2025-2030 ($ million)
Data Table on India - Market size and forecast 2025-2030 ($ million)
Chart on India - Year-over-year growth 2025-2030 (%)
Data Table on India - Year-over-year growth 2025-2030 (%)

12.5.4 South Korea - Market size and forecast 2025-2030

Chart on South Korea - Market size and forecast 2025-2030 ($ million)
Data Table on South Korea - Market size and forecast 2025-2030 ($ million)
Chart on South Korea - Year-over-year growth 2025-2030 (%)
Data Table on South Korea - Year-over-year growth 2025-2030 (%)

12.5.5 Australia - Market size and forecast 2025-2030

Chart on Australia - Market size and forecast 2025-2030 ($ million)
Data Table on Australia - Market size and forecast 2025-2030 ($ million)
Chart on Australia - Year-over-year growth 2025-2030 (%)
Data Table on Australia - Year-over-year growth 2025-2030 (%)

12.5.6 Indonesia - Market size and forecast 2025-2030

Chart on Indonesia - Market size and forecast 2025-2030 ($ million)
Data Table on Indonesia - Market size and forecast 2025-2030 ($ million)
Chart on Indonesia - Year-over-year growth 2025-2030 (%)
Data Table on Indonesia - Year-over-year growth 2025-2030 (%)

12.6 South America - Market size and forecast 2025-2030

Chart on South America - Market size and forecast 2025-2030 ($ million)
Data Table on South America - Market size and forecast 2025-2030 ($ million)
Chart on South America - Year-over-year growth 2025-2030 (%)
Data Table on South America - Year-over-year growth 2025-2030 (%)
Chart on Regional Comparison - South America
Data Table on Regional Comparison - South America

12.6.1 Brazil - Market size and forecast 2025-2030

Chart on Brazil - Market size and forecast 2025-2030 ($ million)
Data Table on Brazil - Market size and forecast 2025-2030 ($ million)
Chart on Brazil - Year-over-year growth 2025-2030 (%)
Data Table on Brazil - Year-over-year growth 2025-2030 (%)

12.6.2 Argentina - Market size and forecast 2025-2030

Chart on Argentina - Market size and forecast 2025-2030 ($ million)
Data Table on Argentina - Market size and forecast 2025-2030 ($ million)
Chart on Argentina - Year-over-year growth 2025-2030 (%)
Data Table on Argentina - Year-over-year growth 2025-2030 (%)

12.6.3 Chile - Market size and forecast 2025-2030

Chart on Chile - Market size and forecast 2025-2030 ($ million)
Data Table on Chile - Market size and forecast 2025-2030 ($ million)
Chart on Chile - Year-over-year growth 2025-2030 (%)
Data Table on Chile - Year-over-year growth 2025-2030 (%)

12.7 Middle East and Africa - Market size and forecast 2025-2030

Chart on Middle East and Africa - Market size and forecast 2025-2030 ($ million)
Data Table on Middle East and Africa - Market size and forecast 2025-2030 ($ million)
Chart on Middle East and Africa - Year-over-year growth 2025-2030 (%)
Data Table on Middle East and Africa - Year-over-year growth 2025-2030 (%)
Chart on Regional Comparison - Middle East and Africa
Data Table on Regional Comparison - Middle East and Africa

12.7.1 Saudi Arabia - Market size and forecast 2025-2030

Chart on Saudi Arabia - Market size and forecast 2025-2030 ($ million)
Data Table on Saudi Arabia - Market size and forecast 2025-2030 ($ million)
Chart on Saudi Arabia - Year-over-year growth 2025-2030 (%)
Data Table on Saudi Arabia - Year-over-year growth 2025-2030 (%)

12.7.2 UAE - Market size and forecast 2025-2030

Chart on UAE - Market size and forecast 2025-2030 ($ million)
Data Table on UAE - Market size and forecast 2025-2030 ($ million)
Chart on UAE - Year-over-year growth 2025-2030 (%)
Data Table on UAE - Year-over-year growth 2025-2030 (%)

12.7.3 South Africa - Market size and forecast 2025-2030

Chart on South Africa - Market size and forecast 2025-2030 ($ million)
Data Table on South Africa - Market size and forecast 2025-2030 ($ million)
Chart on South Africa - Year-over-year growth 2025-2030 (%)
Data Table on South Africa - Year-over-year growth 2025-2030 (%)

12.7.4 Israel - Market size and forecast 2025-2030

Chart on Israel - Market size and forecast 2025-2030 ($ million)
Data Table on Israel - Market size and forecast 2025-2030 ($ million)
Chart on Israel - Year-over-year growth 2025-2030 (%)
Data Table on Israel - Year-over-year growth 2025-2030 (%)

12.7.5 Turkey - Market size and forecast 2025-2030

Chart on Turkey - Market size and forecast 2025-2030 ($ million)
Data Table on Turkey - Market size and forecast 2025-2030 ($ million)
Chart on Turkey - Year-over-year growth 2025-2030 (%)
Data Table on Turkey - Year-over-year growth 2025-2030 (%)

12.8 Market opportunity by geography

Market opportunity by geography ($ million)
Data Tables on Market opportunity by geography ($ million)

13. Drivers, Challenges, and Opportunity

13.1 Market drivers

Proliferation of low drain devices
Growth of emergency preparedness
Advancements in formulation technologies

13.2 Market challenges

Environmental regulations on disposal
Competition from lithium ion
Raw material price volatility

13.3 Impact of drivers and challenges

Impact of drivers and challenges in 2025 and 2030

13.4 Market opportunities

Proliferation of smart home ecosystems
Increasing demand for medical devices
Expansion of retail distribution channels

14. Competitive Landscape

14.1 Overview

14.2

Overview on criticality of inputs and factors of differentiation

14.3 Landscape disruption

Overview on factors of disruption

14.4 Industry risks

Impact of key risks on business

15. Competitive Analysis

15.1 Companies profiled

Companies covered

15.2 Company ranking index

15.3 Market positioning of companies

Matrix on companies position and classification

15.4 Camelion Batteries GmbH

Camelion Batteries GmbH - Overview
Camelion Batteries GmbH - Product / Service
Camelion Batteries GmbH - Key offerings
SWOT

15.5 Energizer Holdings Inc.

Energizer Holdings Inc. - Overview
Energizer Holdings Inc. - Product / Service
Energizer Holdings Inc. - Key offerings
SWOT

15.6 FDK Corp.

FDK Corp. - Overview
FDK Corp. - Product / Service
FDK Corp. - Key offerings
SWOT

15.7 Fujian Nanping Nanfu Battery Co. Ltd.

Fujian Nanping Nanfu Battery Co. Ltd. - Overview
Fujian Nanping Nanfu Battery Co. Ltd. - Product / Service
Fujian Nanping Nanfu Battery Co. Ltd. - Key offerings
SWOT

15.8 Gold Peak Technology Group Ltd.

Gold Peak Technology Group Ltd. - Overview
Gold Peak Technology Group Ltd. - Product / Service
Gold Peak Technology Group Ltd. - Key offerings
SWOT

15.9 Golden Power Group Holdings Ltd

Golden Power Group Holdings Ltd - Overview
Golden Power Group Holdings Ltd - Business segments
Golden Power Group Holdings Ltd - Key offerings
Golden Power Group Holdings Ltd - Segment focus
SWOT

15.10 Guangzhou Tiger Head Battery Group

Guangzhou Tiger Head Battery Group - Overview
Guangzhou Tiger Head Battery Group - Product / Service
Guangzhou Tiger Head Battery Group - Key offerings
SWOT

15.11 HW Energy

HW Energy - Overview
HW Energy - Product / Service
HW Energy - Key offerings
SWOT

15.12 Linyi Yingguang Battery Co. Ltd.

Linyi Yingguang Battery Co. Ltd. - Overview
Linyi Yingguang Battery Co. Ltd. - Product / Service
Linyi Yingguang Battery Co. Ltd. - Key offerings
SWOT

15.13 Panasonic Holdings Corp.

Panasonic Holdings Corp. - Overview
Panasonic Holdings Corp. - Business segments
Panasonic Holdings Corp. - Key news
Panasonic Holdings Corp. - Key offerings
Panasonic Holdings Corp. - Segment focus
SWOT

15.14 Shenzhen PKCELL Battery Co. Ltd

Shenzhen PKCELL Battery Co. Ltd - Overview
Shenzhen PKCELL Battery Co. Ltd - Product / Service
Shenzhen PKCELL Battery Co. Ltd - Key offerings
SWOT

15.15 The Duracell Co.

The Duracell Co. - Overview
The Duracell Co. - Product / Service
The Duracell Co. - Key offerings
SWOT

15.16 Toshiba Lifestyle Products

Toshiba Lifestyle Products - Overview
Toshiba Lifestyle Products - Product / Service
Toshiba Lifestyle Products - Key offerings
SWOT

15.17 VARTA AG

VARTA AG - Overview
VARTA AG - Business segments
VARTA AG - Key news
VARTA AG - Key offerings
VARTA AG - Segment focus
SWOT

15.18 Zhongyin Ningbo Battery Co. Ltd.

Zhongyin Ningbo Battery Co. Ltd. - Overview
Zhongyin Ningbo Battery Co. Ltd. - Product / Service
Zhongyin Ningbo Battery Co. Ltd. - Key offerings
SWOT

16. Appendix

16.1 Scope of the report

Market definition
Objectives
Notes and caveats

16.2 Inclusions and exclusions checklist

Inclusions checklist
Exclusions checklist

16.3 Currency conversion rates for US$

16.4 Research methodology

16.5 Data procurement

Information sources

16.6 Data validation

16.7 Validation techniques employed for market sizing

16.8 Data synthesis

16.9 360 degree market analysis

16.10 List of abbreviations

Research Methodology

Technavio presents a detailed picture of the market by way of study, synthesis, and summation of data from multiple sources. The analysts have presented the various facets of the market with a particular focus on identifying the key industry influencers. The data thus presented is comprehensive, reliable, and the result of extensive research, both primary and secondary.

INFORMATION SOURCES

Primary sources

  • Manufacturers and suppliers
  • Channel partners
  • Industry experts
  • Strategic decision makers

Secondary sources

  • Industry journals and periodicals
  • Government data
  • Financial reports of key industry players
  • Historical data
  • Press releases

DATA ANALYSIS

Data Synthesis

  • Collation of data
  • Estimation of key figures
  • Analysis of derived insights

Data Validation

  • Triangulation with data models
  • Reference against proprietary databases
  • Corroboration with industry experts

REPORT WRITING

Qualitative

  • Market drivers
  • Market challenges
  • Market trends
  • Five forces analysis

Quantitative

  • Market size and forecast
  • Market segmentation
  • Geographical insights
  • Competitive landscape

Interested in this report?

Get your sample now to see our research methodology and insights!

Download Now

Frequently Asked Questions

Alkaline Battery market growth will increase by USD 2735.8 million during 2026-2030.

The Alkaline Battery market is expected to grow at a CAGR of 4.5% during 2026-2030.

Alkaline Battery market is segmented by Application (Consumer electronics, Toys and radios, Remote control, Others) Product (Primary battery, Secondary battery) Distribution channel (Offline, Online)

Camelion Batteries GmbH, Energizer Holdings Inc., FDK Corp., Fujian Nanping Nanfu Battery Co. Ltd., Gold Peak Technology Group Ltd., Golden Power Group Holdings Ltd, Guangzhou Tiger Head Battery Group, Huatai Battery, HW Energy, Linyi Yingguang Battery Co. Ltd., Panasonic Holdings Corp., Shenzhen PKCELL Battery Co. Ltd, The Duracell Co., Toshiba Lifestyle Products, VARTA AG, Voniko Batteries, WES Battery, Zhejiang Mustang Battery Co. Ltd., Zhongyin Ningbo Battery Co. Ltd. are a few of the key vendors in the Alkaline Battery market.

North America will register the highest growth rate of 45.6% among the other regions. Therefore, the Alkaline Battery market in North America is expected to garner significant business opportunities for the vendors during the forecast period.

US, Canada, Mexico, Germany, UK, France, Italy, Spain, The Netherlands, China, Japan, India, South Korea, Australia, Indonesia, Brazil, Argentina, Chile, Saudi Arabia, UAE, South Africa, Israel, Turkey

  • Proliferation of low drain devices is the driving factor this market.

The Alkaline Battery market vendors should focus on grabbing business opportunities from the Application segment as it accounted for the largest market share in the base year.
RIA - Research AI Assistant
Ask RIA
