Alternative Credentials For Higher Education Market Analysis, Size, and Forecast 2026-2030: North America (US, Canada, and Mexico), Europe (UK, Germany, and France), APAC (China, India, and Japan), South America (Brazil and Argentina), Middle East and Africa (South Africa, UAE, and Saudi Arabia), and Rest of World (ROW)

Alternative Credentials For Higher Education Market Analysis, Size, and Forecast 2026-2030:
North America (US, Canada, and Mexico), Europe (UK, Germany, and France), APAC (China, India, and Japan), South America (Brazil and Argentina), Middle East and Africa (South Africa, UAE, and Saudi Arabia), and Rest of World (ROW)

Published: May 2026 307 Pages SKU: IRTNTR43906

Market Overview at a Glance

$2.62 B
Market Opportunity
18.2%
CAGR 2025 - 2030
51.8%
North America Growth
$641.9 Mn
Non-credit training courses segment 2024

Alternative Credentials For Higher Education Market Size 2026-2030

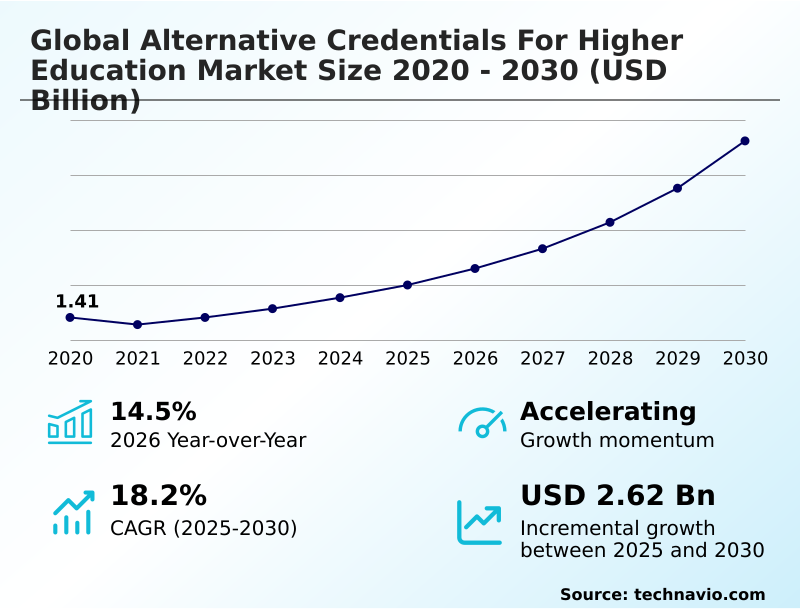
The alternative credentials for higher education market size is valued to increase by USD 2.62 billion, at a CAGR of 18.2% from 2025 to 2030. Rising global skills gap and transition toward skill-based recruitment will drive the alternative credentials for higher education market.

Major Market Trends & Insights

  • North America dominated the market and accounted for a 51.8% growth during the forecast period.
  • By Product - Non-credit training courses segment was valued at USD 641.9 million in 2024
  • By Type - Online segment accounted for the largest market revenue share in 2024

Market Size & Forecast

  • Market Opportunities: USD 3.21 billion
  • Market Future Opportunities: USD 2.62 billion
  • CAGR from 2025 to 2030 : 18.2%

Market Summary

  • The alternative credentials for higher education market is undergoing a profound transformation, shifting focus from traditional multi-year degrees to a more agile, skill-centric model. This evolution is driven by the urgent need for upskilling and reskilling in a workforce disrupted by rapid technological advancements.
  • Learners and employers alike are embracing modular education, including micro-credentials and digital badges, as a means to validate specific competencies. The integration of technologies like blockchain verification provides a secure and portable method for individuals to showcase their achievements in a digital portfolio, enhancing trust and transparency.
  • For instance, a multinational logistics company can implement a custom upskilling program using stackable credentials to train its workforce on new supply chain automation software, ensuring its team has industry-recognized credentials without the downtime of traditional courses. However, the market grapples with challenges such as the fragmentation of quality assurance frameworks and the risk of credential inflation.
  • Addressing these issues through standardized credit transfer frameworks and a commitment to lifelong learning pathways will be critical for sustained adoption and ensuring these credentials hold long-term value in the global labor market, supported by robust learning management system.

What will be the Size of the Alternative Credentials For Higher Education Market during the forecast period?

Get Key Insights on Market Forecast (PDF) Request Free Sample

How is the Alternative Credentials For Higher Education Market Segmented?

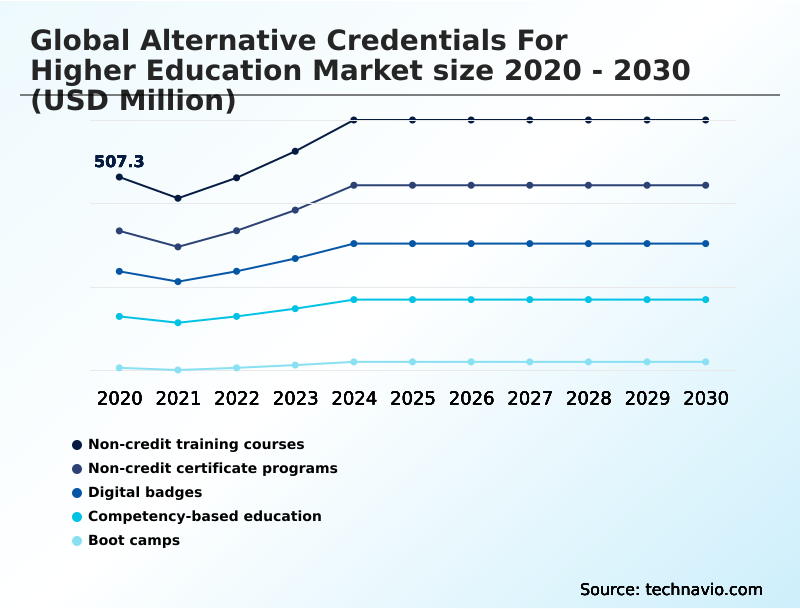
The alternative credentials for higher education industry research report provides comprehensive data (region-wise segment analysis), with forecasts and estimates in "USD million" for the period 2026-2030, as well as historical data from 2020-2024 for the following segments.

  • Product
    • Non-credit training courses
    • Non-credit certificate programs
    • Digital badges
    • Competency-based education
    • Boot camps
  • Type
    • Online
    • Blended
    • Face to face
  • End-user
    • Working professionals
    • Students
    • Lifelong learners
    • Government and institutional
  • Geography
    • North America
      • US
      • Canada
      • Mexico
    • Europe
      • UK
      • Germany
      • France
    • APAC
      • China
      • India
      • Japan
    • South America
      • Brazil
      • Argentina
    • Middle East and Africa
      • South Africa
      • UAE
      • Saudi Arabia
    • Rest of World (ROW)

By Product Insights

The non-credit training courses segment is estimated to witness significant growth during the forecast period.

The non-credit training courses segment is a vital component of the modern educational ecosystem, offering rapid, focused learning opportunities that do not lead to traditional degrees.

These courses cater to professionals seeking to update specific skill sets through competency-based education, a key part of workforce development. The demand is driven by rapid technological change, necessitating continuous upskilling and reskilling to maintain professional relevance.

Institutions and e-learning platforms offer these courses to bridge the gap between formal education and immediate labor market needs, with learners reporting a 25% faster skill acquisition rate.

This flexibility in vocational training, supported by alternative credentialing platforms and robust learning management system integrations, is enhanced by online proctoring and certification preparation services.

Request Free Sample

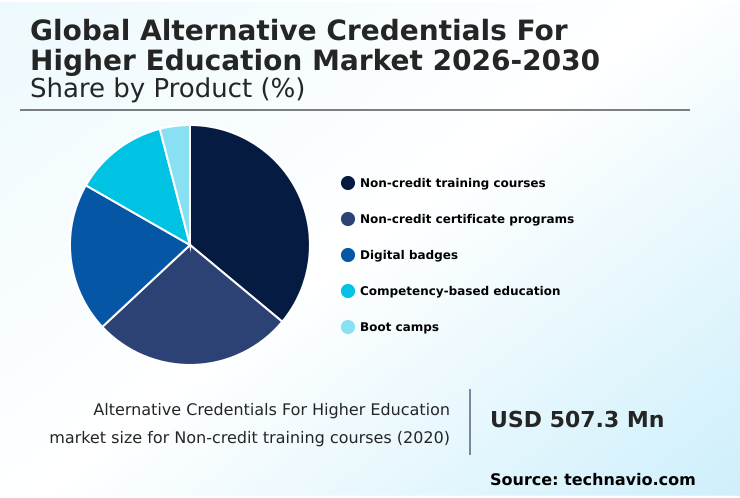
The Non-credit training courses segment was valued at USD 641.9 million in 2024 and showed a gradual increase during the forecast period.

Request Free Sample

Regional Analysis

North America is estimated to contribute 51.8% to the growth of the global market during the forecast period.Technavio’s analysts have elaborately explained the regional trends and drivers that shape the market during the forecast period.

See How Alternative Credentials For Higher Education Market Demand is Rising in North America Request Free Sample

Geographically, North America dominates the market, accounting for 51.8% of the growth opportunity, driven by a mature corporate ecosystem and high institutional innovation.

Europe is distinguished by its strong emphasis on regulatory standards and cross-border portability, with a projected CAGR of 19.6%. The region's focus on quality assurance frameworks and institutional effectiveness supports the value of online degree programs.

The APAC region is characterized by rapid digital transformation and a demographic push toward skill-based employment, with governments integrating non-traditional education into national policies.

This focus on career-focused learning and educational technology helps address massive skills gaps, while South America and the Middle East and Africa are also embracing these models for economic empowerment and diversification.

Market Dynamics

Our researchers analyzed the data with 2025 as the base year, along with the key drivers, trends, and challenges. A holistic analysis of drivers will help companies refine their marketing strategies to gain a competitive advantage.

  • The future of alternative credentials in corporate training hinges on resolving complex issues around their practical implementation and perceived value. Assessing the ROI of non-degree certifications is a critical exercise for organizations, as the impact of micro-credentials on employability becomes a key metric for both learners and hiring managers.
  • This is driving the integration of professional certifications into university curricula, creating hybrid models where academic theory meets practical skill. The role of AI in personalized learning pathways is transformative, tailoring education to individual needs, yet it raises questions about quality assurance in online certification programs.
  • Concurrently, blockchain in higher education credentialing offers a technical solution to trust and verification, helping individuals learn how to build a verifiable digital portfolio. However, challenges in cross-border recognition of micro-credentials persist. The success of stackable credentials for career advancement depends on government frameworks for digital identity in education, which can standardize recognition.
  • Ultimately, the debate over competency-based education versus traditional degrees is being reshaped by effective blended learning models for professional development, which are showing over 20% higher completion rates than purely online formats by combining flexibility with structured, hands-on engagement, thus addressing the core need for alternative credentials for workforce reskilling.

What are the key market drivers leading to the rise in the adoption of Alternative Credentials For Higher Education Industry?

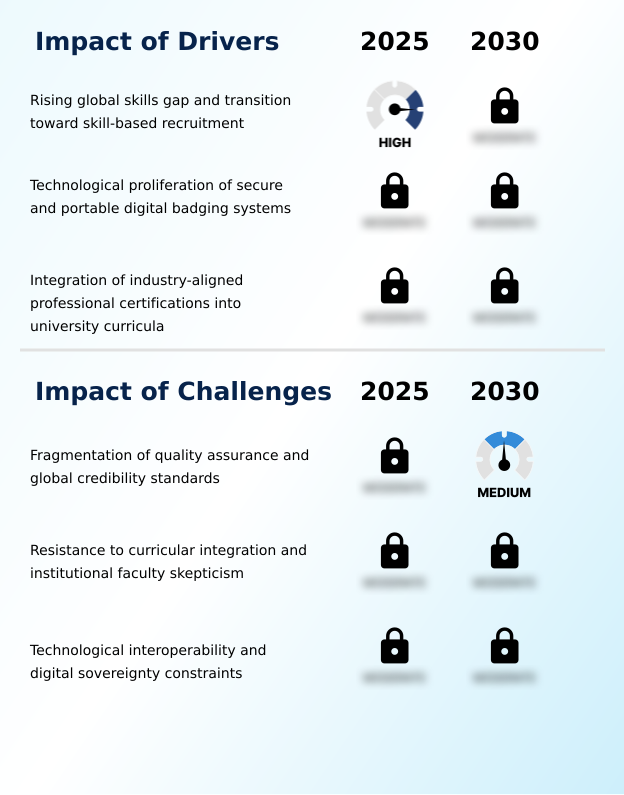
  • The market's growth is primarily driven by the rising global skills gap and the corresponding transition toward skill-based recruitment practices.

  • The primary driver is the widening disconnect between traditional academic output and modern labor force requirements, fueling a shift toward skill-based hiring. Alternative credentials, including professional certifications, offer a rapid solution to talent shortages.
  • Secure digital badging systems, leveraging the open badges standard and blockchain, ensure the security and portability of educational achievements, increasing trust by 40% among recruiters. This allows learners to build a verifiable digital credentials portfolio.
  • Furthermore, the integration of industry-aligned professional certifications into university curricula through blended learning models enhances student employability. These corporate training solutions ensure graduates possess the precise skills required, promoting lifelong learning pathways.

What are the market trends shaping the Alternative Credentials For Higher Education Industry?

  • A key market trend is the integration of generative AI to create hyper-personalized credentialing pathways. This enables adaptive learning experiences tailored to individual skill levels and career goals.

  • A pivotal trend is the use of generative AI for hyper-personalized credentialing pathways, creating bespoke learning experiences. This personalized learning approach moves beyond static curricula, with platforms curating module sequences based on existing knowledge, boosting learning efficiency by up to 30%.
  • The rise of stackable credentials and credit transfer frameworks allows small, discrete certifications to be accumulated for formal academic credit. This modular education approach, supported by government-led national frameworks and digital sovereignty registries using blockchain verification, enhances the value of nanodegree programs.
  • This institutionalization of skill-based learning and theoretical education, supported by digital learning courses, is making alternative credentials a dynamic tool for career management and talent development.

What challenges does the Alternative Credentials For Higher Education Industry face during its growth?

  • A key challenge impeding market growth is the fragmentation of quality assurance and the absence of unified global credibility standards for credentials.

  • A primary challenge is the absence of unified quality assurance frameworks, leading to confusion and the risk of credential inflation. This fragmentation makes it difficult for institutions to assess the rigor of certifications and for learners to navigate a saturated market. Institutional resistance and faculty skepticism slow the integration of micro-credentials into academic curricula.
  • From a corporate perspective, many applicant tracking systems are still programmed to prioritize traditional degrees, creating a disconnect that hinders skill validation. This requires an overhaul of hiring protocols, where some firms have seen a 15% improvement in hiring diversity by adjusting filters.
  • Finally, technological fragmentation and a lack of interoperability between continuing education units and student information systems create data silos, impeding the portability of a learner's complete academic transcripts.

Exclusive Technavio Analysis on Customer Landscape

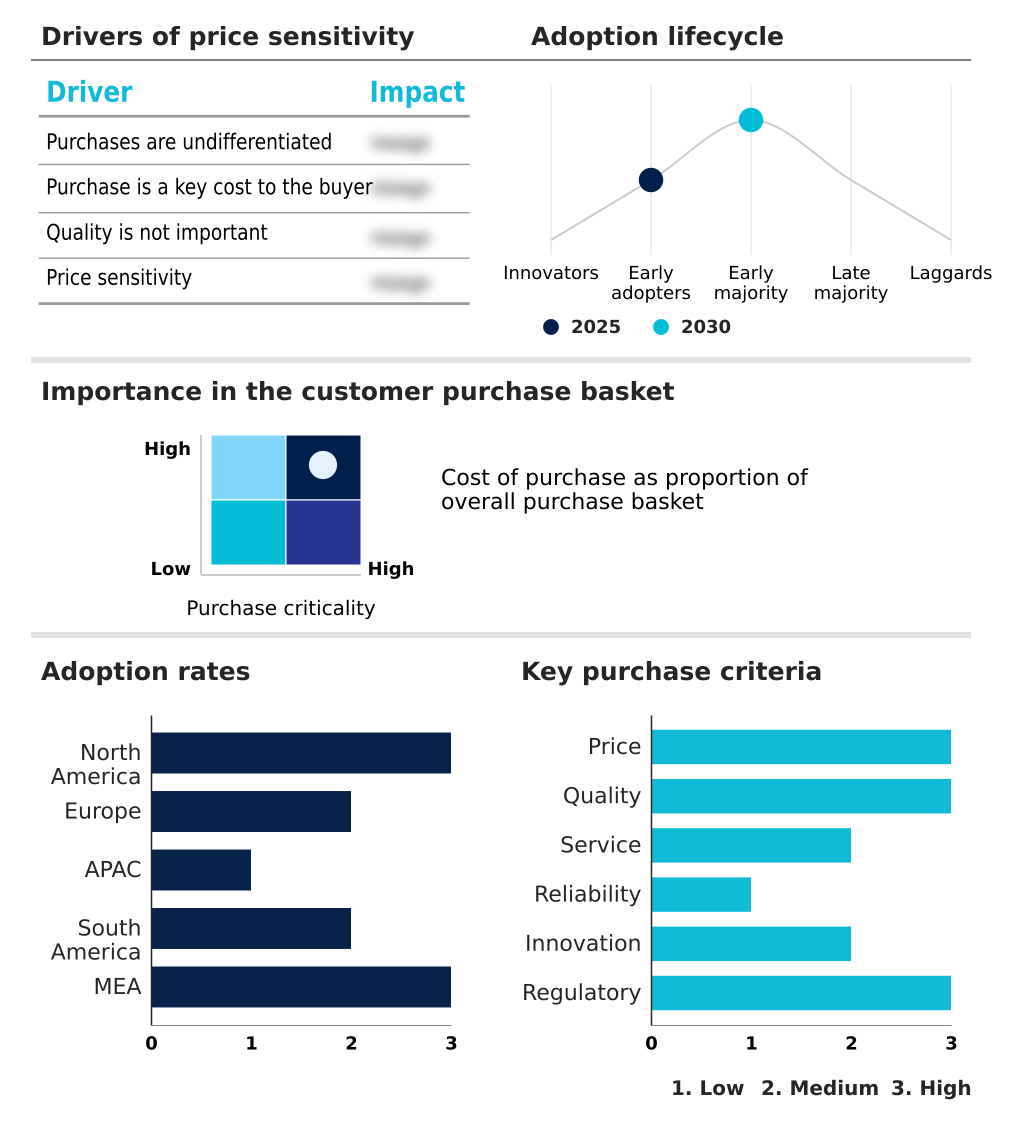
The alternative credentials for higher education market forecasting report includes the adoption lifecycle of the market, covering from the innovator’s stage to the laggard’s stage. It focuses on adoption rates in different regions based on penetration. Furthermore, the alternative credentials for higher education market report also includes key purchase criteria and drivers of price sensitivity to help companies evaluate and develop their market growth analysis strategies.

Customer Landscape of Alternative Credentials For Higher Education Industry

Competitive Landscape

Companies are implementing various strategies, such as strategic alliances, alternative credentials for higher education market forecast, partnerships, mergers and acquisitions, geographical expansion, and product/service launches, to enhance their presence in the industry.

2U Inc. - Vendors provide diverse online degrees, professional certificates, and micro-credentials, meeting demands for lifelong learning and targeted workforce upskilling.

The industry research and growth report includes detailed analyses of the competitive landscape of the market and information about key companies, including:

  • 2U Inc.
  • Accredible
  • Anthology Inc.
  • Coursera Inc.
  • D2L Corp.
  • Degreed Inc.
  • Emeritus
  • FutureLearn Ltd.
  • Guild Education Inc.
  • HolonIQ
  • Instructure Holdings Inc.
  • OpenClassrooms SAS
  • Parchment Inc.
  • Pearson Plc
  • Pluralsight LLC
  • Simplilearn Solutions Pvt. Ltd
  • Skillsoft Corp.
  • Udacity Inc.
  • Udemy Inc.
  • University of Michigan

Qualitative and quantitative analysis of companies has been conducted to help clients understand the wider business environment as well as the strengths and weaknesses of key industry players. Data is qualitatively analyzed to categorize companies as pure play, category-focused, industry-focused, and diversified; it is quantitatively analyzed to categorize companies as dominant, leading, strong, tentative, and weak.

Recent Development and News in Alternative credentials for higher education market

  • In February 2025, Microsoft Corporation launched a major initiative in North America that integrated its proprietary AI skill certifications directly into the hiring pipeline for its global partner network.
  • In April 2025, Coursera, a major provider based in North America, introduced an advanced AI-powered Career Navigator tool.
  • In March 2025, Coursera collaborated with the University of Melbourne to introduce a suite of stackable micro-credentials focused on climate resilience and sustainable infrastructure.
  • In May 2025, 2U Inc. announced a new blended learning initiative in partnership with the University of North Carolina at Chapel Hill that combines online data science modules with mandatory monthly in-person laboratory sessions.

Dive into Technavio’s robust research methodology, blending expert interviews, extensive data synthesis, and validated models for unparalleled Alternative Credentials For Higher Education Market insights. See full methodology.

Market Scope
Page number 307
Base year 2025
Historic period 2020-2024
Forecast period 2026-2030
Growth momentum & CAGR Accelerate at a CAGR of 18.2%
Market growth 2026-2030 USD 2616.6 million
Market structure Fragmented
YoY growth 2025-2026(%) 14.5%
Key countries US, Canada, Mexico, UK, Germany, France, Italy, Spain, The Netherlands, China, India, Japan, South Korea, Australia, Indonesia, Brazil, Argentina, Chile, South Africa, UAE, Saudi Arabia, Egypt and Turkey
Competitive landscape Leading Companies, Market Positioning of Companies, Competitive Strategies, and Industry Risks

Request Free Sample

Research Analyst Overview

  • The market is rapidly maturing beyond a niche concept into a critical component of lifelong learning pathways and workforce development. The core of this transition is the demand for verifiable proof of skills, moving away from traditional proxies for competency.
  • Key offerings like micro-credentials and digital badges, often secured through blockchain verification, are becoming standard elements of an individual's digital portfolio. This shift is driven by the need for continuous upskilling and reskilling in a dynamic job market. Institutions are responding by adopting more flexible models, including competency-based education and credit transfer frameworks that recognize non-traditional education.
  • The integration of professional certifications into formal academic transcripts is a key development, often managed through a sophisticated learning management system with features like online proctoring. However, this proliferation creates challenges related to quality assurance frameworks and the potential for credential inflation, which can undermine trust in skill-based hiring.
  • The move towards open badges standard and digital sovereignty shows a commitment to creating a more learner-centric ecosystem that bypasses outdated applicant tracking systems.

What are the Key Data Covered in this Alternative Credentials For Higher Education Market Research and Growth Report?

  • What is the expected growth of the Alternative Credentials For Higher Education Market between 2026 and 2030?

    • USD 2.62 billion, at a CAGR of 18.2%

  • What segmentation does the market report cover?

    • The report is segmented by Product (Non-credit training courses, Non-credit certificate programs, Digital badges, Competency-based education, and Boot camps), Type (Online, Blended, and Face to face), End-user (Working professionals, Students, Lifelong learners, and Government and institutional) and Geography (North America, Europe, APAC, South America, Middle East and Africa)

  • Which regions are analyzed in the report?

    • North America, Europe, APAC, South America and Middle East and Africa

  • What are the key growth drivers and market challenges?

    • Rising global skills gap and transition toward skill-based recruitment, Fragmentation of quality assurance and global credibility standards

  • Who are the major players in the Alternative Credentials For Higher Education Market?

    • 2U Inc., Accredible, Anthology Inc., Coursera Inc., D2L Corp., Degreed Inc., Emeritus, FutureLearn Ltd., Guild Education Inc., HolonIQ, Instructure Holdings Inc., OpenClassrooms SAS, Parchment Inc., Pearson Plc, Pluralsight LLC, Simplilearn Solutions Pvt. Ltd, Skillsoft Corp., Udacity Inc., Udemy Inc. and University of Michigan

Market Research Insights

  • Market dynamics are defined by a shift toward measurable skill validation, where verifiable digital credentials are a key currency. The adoption of alternative credentialing platforms has led to a 30% increase in engagement for corporate training solutions.
  • This move toward career-focused learning is not just a trend but a response to employers' needs for specific competencies, with organizations that prioritize skill-based hiring reporting a 25% improvement in employee retention. The ecosystem, encompassing e-learning platforms and comprehensive student information systems, supports this transition.
  • Institutional effectiveness is now partly measured by the ability to offer modular education, integrating digital learning courses and mentor-guided learning to prepare a job-ready workforce, enhancing alumni support services and overall talent development.

We can help! Our analysts can customize this alternative credentials for higher education market research report to meet your requirements.

Get in touch

1. Executive Summary

1.1 Market overview

Executive Summary - Chart on Market Overview
Executive Summary - Data Table on Market Overview
Executive Summary - Chart on Global Market Characteristics
Executive Summary - Chart on Market by Geography
Executive Summary - Chart on Market Segmentation by Product
Executive Summary - Chart on Market Segmentation by Type
Executive Summary - Chart on Market Segmentation by End-user
Executive Summary - Chart on Incremental Growth
Executive Summary - Data Table on Incremental Growth
Executive Summary - Chart on Company Market Positioning

2. Technavio Analysis

2.1 Analysis of price sensitivity, lifecycle, customer purchase basket, adoption rates, and purchase criteria

2.2 Criticality of inputs and Factors of differentiation

Chart on Overview on criticality of inputs and factors of differentiation

2.3 Factors of disruption

Chart on Overview on factors of disruption

2.4 Impact of drivers and challenges

Chart on Impact of drivers and challenges in 2025 and 2030

3. Market Landscape

3.1 Market ecosystem

Chart on Parent Market
Data Table on - Parent Market

3.2 Market characteristics

Chart on Market characteristics analysis

3.3 Value chain analysis

Chart on Value chain analysis

4. Market Sizing

4.1 Market definition

Data Table on Offerings of companies included in the market definition

4.2 Market segment analysis

Market segments

4.3 Market size 2025

4.4 Market outlook: Forecast for 2025-2030

Chart on Global - Market size and forecast 2025-2030 ($ million)
Data Table on Global - Market size and forecast 2025-2030 ($ million)
Chart on Global Market: Year-over-year growth 2025-2030 (%)
Data Table on Global Market: Year-over-year growth 2025-2030 (%)

5. Historic Market Size

5.1 Global Alternative Credentials For Higher Education Market 2020 - 2024

Historic Market Size - Data Table on Global Alternative Credentials For Higher Education Market 2020 - 2024 ($ million)

5.2 Product segment analysis 2020 - 2024

Historic Market Size - Product Segment 2020 - 2024 ($ million)

5.3 Type segment analysis 2020 - 2024

Historic Market Size - Type Segment 2020 - 2024 ($ million)

5.4 End-user segment analysis 2020 - 2024

Historic Market Size - End-user Segment 2020 - 2024 ($ million)

5.5 Geography segment analysis 2020 - 2024

Historic Market Size - Geography Segment 2020 - 2024 ($ million)

5.6 Country segment analysis 2020 - 2024

Historic Market Size - Country Segment 2020 - 2024 ($ million)

6. Qualitative Analysis

6.1 Impact of AI on Global Alternative Credentials Market for Higher Education

6.2 Impact of Geopolitical Conflicts on Global Alternative Credentials for Higher Education Market

7. Five Forces Analysis

7.1 Five forces summary

Five forces analysis - Comparison between 2025 and 2030

7.2 Bargaining power of buyers

Bargaining power of buyers - Impact of key factors 2025 and 2030

7.3 Bargaining power of suppliers

Bargaining power of suppliers - Impact of key factors in 2025 and 2030

7.4 Threat of new entrants

Threat of new entrants - Impact of key factors in 2025 and 2030

7.5 Threat of substitutes

Threat of substitutes - Impact of key factors in 2025 and 2030

7.6 Threat of rivalry

Threat of rivalry - Impact of key factors in 2025 and 2030

7.7 Market condition

Chart on Market condition - Five forces 2025 and 2030

8. Market Segmentation by Product

8.1 Market segments

Chart on Product - Market share 2025-2030 (%)
Data Table on Product - Market share 2025-2030 (%)

8.2 Comparison by Product

Chart on Comparison by Product
Data Table on Comparison by Product

8.3 Non-credit training courses - Market size and forecast 2025-2030

Chart on Non-credit training courses - Market size and forecast 2025-2030 ($ million)
Data Table on Non-credit training courses - Market size and forecast 2025-2030 ($ million)
Chart on Non-credit training courses - Year-over-year growth 2025-2030 (%)
Data Table on Non-credit training courses - Year-over-year growth 2025-2030 (%)

8.4 Non-credit certificate programs - Market size and forecast 2025-2030

Chart on Non-credit certificate programs - Market size and forecast 2025-2030 ($ million)
Data Table on Non-credit certificate programs - Market size and forecast 2025-2030 ($ million)
Chart on Non-credit certificate programs - Year-over-year growth 2025-2030 (%)
Data Table on Non-credit certificate programs - Year-over-year growth 2025-2030 (%)

8.5 Digital badges - Market size and forecast 2025-2030

Chart on Digital badges - Market size and forecast 2025-2030 ($ million)
Data Table on Digital badges - Market size and forecast 2025-2030 ($ million)
Chart on Digital badges - Year-over-year growth 2025-2030 (%)
Data Table on Digital badges - Year-over-year growth 2025-2030 (%)

8.6 Competency-based education - Market size and forecast 2025-2030

Chart on Competency-based education - Market size and forecast 2025-2030 ($ million)
Data Table on Competency-based education - Market size and forecast 2025-2030 ($ million)
Chart on Competency-based education - Year-over-year growth 2025-2030 (%)
Data Table on Competency-based education - Year-over-year growth 2025-2030 (%)

8.7 Boot camps - Market size and forecast 2025-2030

Chart on Boot camps - Market size and forecast 2025-2030 ($ million)
Data Table on Boot camps - Market size and forecast 2025-2030 ($ million)
Chart on Boot camps - Year-over-year growth 2025-2030 (%)
Data Table on Boot camps - Year-over-year growth 2025-2030 (%)

8.8 Market opportunity by Product

Market opportunity by Product ($ million)
Data Table on Market opportunity by Product ($ million)

9. Market Segmentation by Type

9.1 Market segments

Chart on Type - Market share 2025-2030 (%)
Data Table on Type - Market share 2025-2030 (%)

9.2 Comparison by Type

Chart on Comparison by Type
Data Table on Comparison by Type

9.3 Online - Market size and forecast 2025-2030

Chart on Online - Market size and forecast 2025-2030 ($ million)
Data Table on Online - Market size and forecast 2025-2030 ($ million)
Chart on Online - Year-over-year growth 2025-2030 (%)
Data Table on Online - Year-over-year growth 2025-2030 (%)

9.4 Blended - Market size and forecast 2025-2030

Chart on Blended - Market size and forecast 2025-2030 ($ million)
Data Table on Blended - Market size and forecast 2025-2030 ($ million)
Chart on Blended - Year-over-year growth 2025-2030 (%)
Data Table on Blended - Year-over-year growth 2025-2030 (%)

9.5 Face to face - Market size and forecast 2025-2030

Chart on Face to face - Market size and forecast 2025-2030 ($ million)
Data Table on Face to face - Market size and forecast 2025-2030 ($ million)
Chart on Face to face - Year-over-year growth 2025-2030 (%)
Data Table on Face to face - Year-over-year growth 2025-2030 (%)

9.6 Market opportunity by Type

Market opportunity by Type ($ million)
Data Table on Market opportunity by Type ($ million)

10. Market Segmentation by End-user

10.1 Market segments

Chart on End-user - Market share 2025-2030 (%)
Data Table on End-user - Market share 2025-2030 (%)

10.2 Comparison by End-user

Chart on Comparison by End-user
Data Table on Comparison by End-user

10.3 Working professionals - Market size and forecast 2025-2030

Chart on Working professionals - Market size and forecast 2025-2030 ($ million)
Data Table on Working professionals - Market size and forecast 2025-2030 ($ million)
Chart on Working professionals - Year-over-year growth 2025-2030 (%)
Data Table on Working professionals - Year-over-year growth 2025-2030 (%)

10.4 Students - Market size and forecast 2025-2030

Chart on Students - Market size and forecast 2025-2030 ($ million)
Data Table on Students - Market size and forecast 2025-2030 ($ million)
Chart on Students - Year-over-year growth 2025-2030 (%)
Data Table on Students - Year-over-year growth 2025-2030 (%)

10.5 Lifelong learners - Market size and forecast 2025-2030

Chart on Lifelong learners - Market size and forecast 2025-2030 ($ million)
Data Table on Lifelong learners - Market size and forecast 2025-2030 ($ million)
Chart on Lifelong learners - Year-over-year growth 2025-2030 (%)
Data Table on Lifelong learners - Year-over-year growth 2025-2030 (%)

10.6 Government and institutional - Market size and forecast 2025-2030

Chart on Government and institutional - Market size and forecast 2025-2030 ($ million)
Data Table on Government and institutional - Market size and forecast 2025-2030 ($ million)
Chart on Government and institutional - Year-over-year growth 2025-2030 (%)
Data Table on Government and institutional - Year-over-year growth 2025-2030 (%)

10.7 Market opportunity by End-user

Market opportunity by End-user ($ million)
Data Table on Market opportunity by End-user ($ million)

11. Customer Landscape

11.1 Customer landscape overview

Analysis of price sensitivity, lifecycle, customer purchase basket, adoption rates, and purchase criteria

12. Geographic Landscape

12.1 Geographic segmentation

Chart on Market share by geography 2025-2030 (%)
Data Table on Market share by geography 2025-2030 (%)

12.2 Geographic comparison

Chart on Geographic comparison
Data Table on Geographic comparison

12.3 North America - Market size and forecast 2025-2030

Chart on North America - Market size and forecast 2025-2030 ($ million)
Data Table on North America - Market size and forecast 2025-2030 ($ million)
Chart on North America - Year-over-year growth 2025-2030 (%)
Data Table on North America - Year-over-year growth 2025-2030 (%)
Chart on Regional Comparison - North America
Data Table on Regional Comparison - North America

12.3.1 US - Market size and forecast 2025-2030

Chart on US - Market size and forecast 2025-2030 ($ million)
Data Table on US - Market size and forecast 2025-2030 ($ million)
Chart on US - Year-over-year growth 2025-2030 (%)
Data Table on US - Year-over-year growth 2025-2030 (%)

12.3.2 Canada - Market size and forecast 2025-2030

Chart on Canada - Market size and forecast 2025-2030 ($ million)
Data Table on Canada - Market size and forecast 2025-2030 ($ million)
Chart on Canada - Year-over-year growth 2025-2030 (%)
Data Table on Canada - Year-over-year growth 2025-2030 (%)

12.3.3 Mexico - Market size and forecast 2025-2030

Chart on Mexico - Market size and forecast 2025-2030 ($ million)
Data Table on Mexico - Market size and forecast 2025-2030 ($ million)
Chart on Mexico - Year-over-year growth 2025-2030 (%)
Data Table on Mexico - Year-over-year growth 2025-2030 (%)

12.4 Europe - Market size and forecast 2025-2030

Chart on Europe - Market size and forecast 2025-2030 ($ million)
Data Table on Europe - Market size and forecast 2025-2030 ($ million)
Chart on Europe - Year-over-year growth 2025-2030 (%)
Data Table on Europe - Year-over-year growth 2025-2030 (%)
Chart on Regional Comparison - Europe
Data Table on Regional Comparison - Europe

12.4.1 UK - Market size and forecast 2025-2030

Chart on UK - Market size and forecast 2025-2030 ($ million)
Data Table on UK - Market size and forecast 2025-2030 ($ million)
Chart on UK - Year-over-year growth 2025-2030 (%)
Data Table on UK - Year-over-year growth 2025-2030 (%)

12.4.2 Germany - Market size and forecast 2025-2030

Chart on Germany - Market size and forecast 2025-2030 ($ million)
Data Table on Germany - Market size and forecast 2025-2030 ($ million)
Chart on Germany - Year-over-year growth 2025-2030 (%)
Data Table on Germany - Year-over-year growth 2025-2030 (%)

12.4.3 France - Market size and forecast 2025-2030

Chart on France - Market size and forecast 2025-2030 ($ million)
Data Table on France - Market size and forecast 2025-2030 ($ million)
Chart on France - Year-over-year growth 2025-2030 (%)
Data Table on France - Year-over-year growth 2025-2030 (%)

12.4.4 Italy - Market size and forecast 2025-2030

Chart on Italy - Market size and forecast 2025-2030 ($ million)
Data Table on Italy - Market size and forecast 2025-2030 ($ million)
Chart on Italy - Year-over-year growth 2025-2030 (%)
Data Table on Italy - Year-over-year growth 2025-2030 (%)

12.4.5 Spain - Market size and forecast 2025-2030

Chart on Spain - Market size and forecast 2025-2030 ($ million)
Data Table on Spain - Market size and forecast 2025-2030 ($ million)
Chart on Spain - Year-over-year growth 2025-2030 (%)
Data Table on Spain - Year-over-year growth 2025-2030 (%)

12.4.6 The Netherlands - Market size and forecast 2025-2030

Chart on The Netherlands - Market size and forecast 2025-2030 ($ million)
Data Table on The Netherlands - Market size and forecast 2025-2030 ($ million)
Chart on The Netherlands - Year-over-year growth 2025-2030 (%)
Data Table on The Netherlands - Year-over-year growth 2025-2030 (%)

12.5 APAC - Market size and forecast 2025-2030

Chart on APAC - Market size and forecast 2025-2030 ($ million)
Data Table on APAC - Market size and forecast 2025-2030 ($ million)
Chart on APAC - Year-over-year growth 2025-2030 (%)
Data Table on APAC - Year-over-year growth 2025-2030 (%)
Chart on Regional Comparison - APAC
Data Table on Regional Comparison - APAC

12.5.1 China - Market size and forecast 2025-2030

Chart on China - Market size and forecast 2025-2030 ($ million)
Data Table on China - Market size and forecast 2025-2030 ($ million)
Chart on China - Year-over-year growth 2025-2030 (%)
Data Table on China - Year-over-year growth 2025-2030 (%)

12.5.2 India - Market size and forecast 2025-2030

Chart on India - Market size and forecast 2025-2030 ($ million)
Data Table on India - Market size and forecast 2025-2030 ($ million)
Chart on India - Year-over-year growth 2025-2030 (%)
Data Table on India - Year-over-year growth 2025-2030 (%)

12.5.3 Japan - Market size and forecast 2025-2030

Chart on Japan - Market size and forecast 2025-2030 ($ million)
Data Table on Japan - Market size and forecast 2025-2030 ($ million)
Chart on Japan - Year-over-year growth 2025-2030 (%)
Data Table on Japan - Year-over-year growth 2025-2030 (%)

12.5.4 South Korea - Market size and forecast 2025-2030

Chart on South Korea - Market size and forecast 2025-2030 ($ million)
Data Table on South Korea - Market size and forecast 2025-2030 ($ million)
Chart on South Korea - Year-over-year growth 2025-2030 (%)
Data Table on South Korea - Year-over-year growth 2025-2030 (%)

12.5.5 Australia - Market size and forecast 2025-2030

Chart on Australia - Market size and forecast 2025-2030 ($ million)
Data Table on Australia - Market size and forecast 2025-2030 ($ million)
Chart on Australia - Year-over-year growth 2025-2030 (%)
Data Table on Australia - Year-over-year growth 2025-2030 (%)

12.5.6 Indonesia - Market size and forecast 2025-2030

Chart on Indonesia - Market size and forecast 2025-2030 ($ million)
Data Table on Indonesia - Market size and forecast 2025-2030 ($ million)
Chart on Indonesia - Year-over-year growth 2025-2030 (%)
Data Table on Indonesia - Year-over-year growth 2025-2030 (%)

12.6 South America - Market size and forecast 2025-2030

Chart on South America - Market size and forecast 2025-2030 ($ million)
Data Table on South America - Market size and forecast 2025-2030 ($ million)
Chart on South America - Year-over-year growth 2025-2030 (%)
Data Table on South America - Year-over-year growth 2025-2030 (%)
Chart on Regional Comparison - South America
Data Table on Regional Comparison - South America

12.6.1 Brazil - Market size and forecast 2025-2030

Chart on Brazil - Market size and forecast 2025-2030 ($ million)
Data Table on Brazil - Market size and forecast 2025-2030 ($ million)
Chart on Brazil - Year-over-year growth 2025-2030 (%)
Data Table on Brazil - Year-over-year growth 2025-2030 (%)

12.6.2 Argentina - Market size and forecast 2025-2030

Chart on Argentina - Market size and forecast 2025-2030 ($ million)
Data Table on Argentina - Market size and forecast 2025-2030 ($ million)
Chart on Argentina - Year-over-year growth 2025-2030 (%)
Data Table on Argentina - Year-over-year growth 2025-2030 (%)

12.6.3 Chile - Market size and forecast 2025-2030

Chart on Chile - Market size and forecast 2025-2030 ($ million)
Data Table on Chile - Market size and forecast 2025-2030 ($ million)
Chart on Chile - Year-over-year growth 2025-2030 (%)
Data Table on Chile - Year-over-year growth 2025-2030 (%)

12.7 Middle East and Africa - Market size and forecast 2025-2030

Chart on Middle East and Africa - Market size and forecast 2025-2030 ($ million)
Data Table on Middle East and Africa - Market size and forecast 2025-2030 ($ million)
Chart on Middle East and Africa - Year-over-year growth 2025-2030 (%)
Data Table on Middle East and Africa - Year-over-year growth 2025-2030 (%)
Chart on Regional Comparison - Middle East and Africa
Data Table on Regional Comparison - Middle East and Africa

12.7.1 South Africa - Market size and forecast 2025-2030

Chart on South Africa - Market size and forecast 2025-2030 ($ million)
Data Table on South Africa - Market size and forecast 2025-2030 ($ million)
Chart on South Africa - Year-over-year growth 2025-2030 (%)
Data Table on South Africa - Year-over-year growth 2025-2030 (%)

12.7.2 UAE - Market size and forecast 2025-2030

Chart on UAE - Market size and forecast 2025-2030 ($ million)
Data Table on UAE - Market size and forecast 2025-2030 ($ million)
Chart on UAE - Year-over-year growth 2025-2030 (%)
Data Table on UAE - Year-over-year growth 2025-2030 (%)

12.7.3 Saudi Arabia - Market size and forecast 2025-2030

Chart on Saudi Arabia - Market size and forecast 2025-2030 ($ million)
Data Table on Saudi Arabia - Market size and forecast 2025-2030 ($ million)
Chart on Saudi Arabia - Year-over-year growth 2025-2030 (%)
Data Table on Saudi Arabia - Year-over-year growth 2025-2030 (%)

12.7.4 Egypt - Market size and forecast 2025-2030

Chart on Egypt - Market size and forecast 2025-2030 ($ million)
Data Table on Egypt - Market size and forecast 2025-2030 ($ million)
Chart on Egypt - Year-over-year growth 2025-2030 (%)
Data Table on Egypt - Year-over-year growth 2025-2030 (%)

12.7.5 Turkey - Market size and forecast 2025-2030

Chart on Turkey - Market size and forecast 2025-2030 ($ million)
Data Table on Turkey - Market size and forecast 2025-2030 ($ million)
Chart on Turkey - Year-over-year growth 2025-2030 (%)
Data Table on Turkey - Year-over-year growth 2025-2030 (%)

12.8 Market opportunity by geography

Market opportunity by geography ($ million)
Data Tables on Market opportunity by geography ($ million)

13. Drivers, Challenges, and Opportunity

13.1 Market drivers

Rising global skills gap and transition toward skill-based recruitment
Technological proliferation of secure and portable digital badging systems
Integration of industry-aligned professional certifications into university curricula

13.2 Market challenges

Fragmentation of quality assurance and global credibility standards
Resistance to curricular integration and institutional faculty skepticism
Technological interoperability and digital sovereignty constraints

13.3 Impact of drivers and challenges

Impact of drivers and challenges in 2025 and 2030

13.4 Market opportunities

Integration of generative AI for hyper-personalized credentialing pathways
Rise of stackable micro-credentials and convergence of vocational and academic credit
Government-led national frameworks and implementation of sovereign digital identity registries

14. Competitive Landscape

14.1 Overview

14.2

Overview on criticality of inputs and factors of differentiation

14.3 Landscape disruption

Overview on factors of disruption

14.4 Industry risks

Impact of key risks on business

15. Competitive Analysis

15.1 Companies profiled

Companies covered

15.2 Company ranking index

15.3 Market positioning of companies

Matrix on companies position and classification

15.4 2U Inc.

2U Inc. - Overview
2U Inc. - Product / Service
2U Inc. - Key offerings
SWOT

15.5 Anthology Inc.

Anthology Inc. - Overview
Anthology Inc. - Product / Service
Anthology Inc. - Key offerings
SWOT

15.6 Coursera Inc.

Coursera Inc. - Overview
Coursera Inc. - Business segments
Coursera Inc. - Key news
Coursera Inc. - Key offerings
Coursera Inc. - Segment focus
SWOT

15.7 Degreed Inc.

Degreed Inc. - Overview
Degreed Inc. - Product / Service
Degreed Inc. - Key offerings
SWOT

15.8 Emeritus

Emeritus - Overview
Emeritus - Product / Service
Emeritus - Key offerings
SWOT

15.9 FutureLearn Ltd.

FutureLearn Ltd. - Overview
FutureLearn Ltd. - Product / Service
FutureLearn Ltd. - Key offerings
SWOT

15.10 OpenClassrooms SAS

OpenClassrooms SAS - Overview
OpenClassrooms SAS - Product / Service
OpenClassrooms SAS - Key offerings
SWOT

15.11 Parchment Inc.

Parchment Inc. - Overview
Parchment Inc. - Product / Service
Parchment Inc. - Key offerings
SWOT

15.12 Pearson Plc

Pearson Plc - Overview
Pearson Plc - Business segments
Pearson Plc - Key offerings
Pearson Plc - Segment focus
SWOT

15.13 Pluralsight LLC

Pluralsight LLC - Overview
Pluralsight LLC - Product / Service
Pluralsight LLC - Key offerings
SWOT

15.14 Simplilearn Solutions Pvt. Ltd

Simplilearn Solutions Pvt. Ltd - Overview
Simplilearn Solutions Pvt. Ltd - Product / Service
Simplilearn Solutions Pvt. Ltd - Key offerings
SWOT

15.15 Skillsoft Corp.

Skillsoft Corp. - Overview
Skillsoft Corp. - Business segments
Skillsoft Corp. - Key news
Skillsoft Corp. - Key offerings
Skillsoft Corp. - Segment focus
SWOT

15.16 Udacity Inc.

Udacity Inc. - Overview
Udacity Inc. - Product / Service
Udacity Inc. - Key offerings
SWOT

15.17 Udemy Inc.

Udemy Inc. - Overview
Udemy Inc. - Business segments
Udemy Inc. - Key offerings
Udemy Inc. - Segment focus
SWOT

15.18 University of Michigan

University of Michigan - Overview
University of Michigan - Business segments
University of Michigan - Key offerings
University of Michigan - Segment focus
SWOT

16. Appendix

16.1 Scope of the report

Market definition
Objectives
Notes and caveats

16.2 Inclusions and exclusions checklist

Inclusions checklist
Exclusions checklist

16.3 Currency conversion rates for US$

16.4 Research methodology

16.5 Data procurement

Information sources

16.6 Data validation

16.7 Validation techniques employed for market sizing

16.8 Data synthesis

16.9 360 degree market analysis

16.10 List of abbreviations

Research Methodology

Technavio presents a detailed picture of the market by way of study, synthesis, and summation of data from multiple sources. The analysts have presented the various facets of the market with a particular focus on identifying the key industry influencers. The data thus presented is comprehensive, reliable, and the result of extensive research, both primary and secondary.

INFORMATION SOURCES

Primary sources

  • Manufacturers and suppliers
  • Channel partners
  • Industry experts
  • Strategic decision makers

Secondary sources

  • Industry journals and periodicals
  • Government data
  • Financial reports of key industry players
  • Historical data
  • Press releases

DATA ANALYSIS

Data Synthesis

  • Collation of data
  • Estimation of key figures
  • Analysis of derived insights

Data Validation

  • Triangulation with data models
  • Reference against proprietary databases
  • Corroboration with industry experts

REPORT WRITING

Qualitative

  • Market drivers
  • Market challenges
  • Market trends
  • Five forces analysis

Quantitative

  • Market size and forecast
  • Market segmentation
  • Geographical insights
  • Competitive landscape

Interested in this report?

Get your sample now to see our research methodology and insights!

Download Now

Frequently Asked Questions

Alternative Credentials For Higher Education market growth will increase by USD 2616.6 million during 2026-2030.

The Alternative Credentials For Higher Education market is expected to grow at a CAGR of 18.2% during 2026-2030.

Alternative Credentials For Higher Education market is segmented by Product (Non-credit training courses, Non-credit certificate programs, Digital badges, Competency-based education, Boot camps) Type (Online, Blended, Face to face) End-user (Working professionals, Students, Lifelong learners, Government and institutional)

2U Inc., Accredible, Anthology Inc., Coursera Inc., D2L Corp., Degreed Inc., Emeritus, FutureLearn Ltd., Guild Education Inc., HolonIQ, Instructure Holdings Inc., OpenClassrooms SAS, Parchment Inc., Pearson Plc, Pluralsight LLC, Simplilearn Solutions Pvt. Ltd, Skillsoft Corp., Udacity Inc., Udemy Inc., University of Michigan are a few of the key vendors in the Alternative Credentials For Higher Education market.

North America will register the highest growth rate of 51.8% among the other regions. Therefore, the Alternative Credentials For Higher Education market in North America is expected to garner significant business opportunities for the vendors during the forecast period.

US, Canada, Mexico, UK, Germany, France, Italy, Spain, The Netherlands, China, India, Japan, South Korea, Australia, Indonesia, Brazil, Argentina, Chile, South Africa, UAE, Saudi Arabia, Egypt, Turkey

  • Rising global skills gap and transition toward skill-based recruitment is the driving factor this market.

The Alternative Credentials For Higher Education market vendors should focus on grabbing business opportunities from the Product segment as it accounted for the largest market share in the base year.
RIA - Research AI Assistant
Ask RIA