Aluminum Pigment Market Analysis, Size, and Forecast 2026-2030: APAC (China, Japan, and India), Europe (Germany, UK, and France), North America (US, Canada, and Mexico), Middle East and Africa (Saudi Arabia, UAE, and South Africa), South America (Brazil, Argentina, and Chile), and Rest of World (ROW)

Aluminum Pigment Market Analysis, Size, and Forecast 2026-2030:
APAC (China, Japan, and India), Europe (Germany, UK, and France), North America (US, Canada, and Mexico), Middle East and Africa (Saudi Arabia, UAE, and South Africa), South America (Brazil, Argentina, and Chile), and Rest of World (ROW)

Published: Oct 2026 302 Pages SKU: IRTNTR43910

Market Overview at a Glance

$193.32 Mn
Market Opportunity
5.2%
CAGR 2025 - 2030
49.2%
APAC Growth
$284.34 Mn
Paints and coatings segment 2024

Aluminum Pigment Market Size 2026-2030

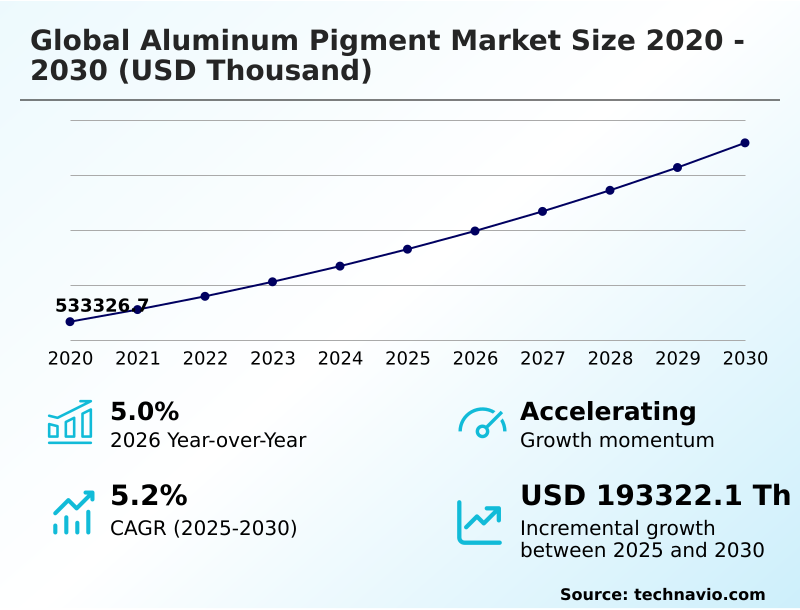
The aluminum pigment market size is valued to increase by USD 193.32 million, at a CAGR of 5.2% from 2025 to 2030. Automotive sector metallic finishes will drive the aluminum pigment market.

Major Market Trends & Insights

  • APAC dominated the market and accounted for a 49.2% growth during the forecast period.
  • By Application - Paints and coatings segment was valued at USD 284.34 million in 2024
  • By Type - Powders segment accounted for the largest market revenue share in 2024

Market Size & Forecast

  • Market Opportunities:
  • Market Future Opportunities: USD 193.32 million
  • CAGR from 2025 to 2030 : 5.2%

Market Summary

  • The Aluminum Pigment Market demonstrates robust commercial expansion driven by stringent aesthetic and functional requirements across the automotive and architectural sectors. Formulators increasingly rely on high-purity aluminum ingots and precise wet-milling processes to manufacture metallic pigments that deliver superior solar heat reflection and structural durability.
  • A primary growth driver is the surging demand for lightweight electric vehicle thermal treatments, where specialized reflective coatings mitigate cabin heat absorption and optimize battery efficiency. Conversely, manufacturers face persistent challenges stemming from raw material price volatility, which directly inflates production costs and compresses operational margins.
  • To counteract these economic pressures, leading facilities have optimized their energy-efficient milling processes, achieving a 22% reduction in overall energy consumption during pigment synthesis. This strategic supply chain optimization allows producers to maintain competitive pricing while meeting rigorous environmental compliance standards.
  • By integrating advanced non-leafing pigments and sophisticated oleic acid additives, chemical engineers successfully formulate durable exterior facades that resist severe weathering. The continuous refinement of flake morphology optimization ensures that industrial consumers receive consistent, high-quality finishes that align with modern sustainability mandates.

What will be the Size of the Aluminum Pigment Market during the forecast period?
Get Key Insights on Market Forecast (PDF) Get Free Sample

How is the Aluminum Pigment Market Segmented?

The aluminum pigment industry research report provides comprehensive data (region-wise segment analysis), with forecasts and estimates in "USD thousand" for the period 2026-2030, as well as historical data from 2020-2024 for the following segments.

  • Application
    • Paints and coatings
    • Plastics
    • Printing inks
    • Personal care products
    • Others
  • Type
    • Powders
    • Pellets
    • Others
  • Product type
    • Non-leafing
    • Leafing
  • Geography
    • APAC
      • China
      • Japan
      • India
      • South Korea
      • Australia
      • Indonesia
    • Europe
      • Germany
      • UK
      • France
      • Italy
      • Spain
      • The Netherlands
    • North America
      • US
      • Canada
      • Mexico
    • Middle East and Africa
      • Saudi Arabia
      • UAE
      • South Africa
      • Israel
      • Turkey
    • South America
      • Brazil
      • Argentina
      • Chile

By Application Insights

The paints and coatings segment is estimated to witness significant growth during the forecast period.

The paints and coatings application sector dictates product development trajectories by demanding exceptional opacity and superior weatherability for industrial and automotive finishes.

Formulators heavily integrate metallic effect flakes to achieve high-performance protective coatings that resist environmental degradation while delivering dynamic visual depth.

Modern manufacturing facilities report that adopting advanced silica sol-gel encapsulation techniques has reduced hydrogen gassing defects by 18% in aqueous systems, significantly improving formulation stability. This operational efficiency gain directly lowers waste and accelerates production cycles for high-volume automotive lines.

By utilizing precise particle size distributions, chemical engineers achieve sophisticated flop effects and distinct light-interference characteristics that define premium architectural facades.

The continuous evolution of waterborne formulations ensures compliance with stringent volatile organic compound regulations without sacrificing visual brilliance or structural protection.
Get Free Sample

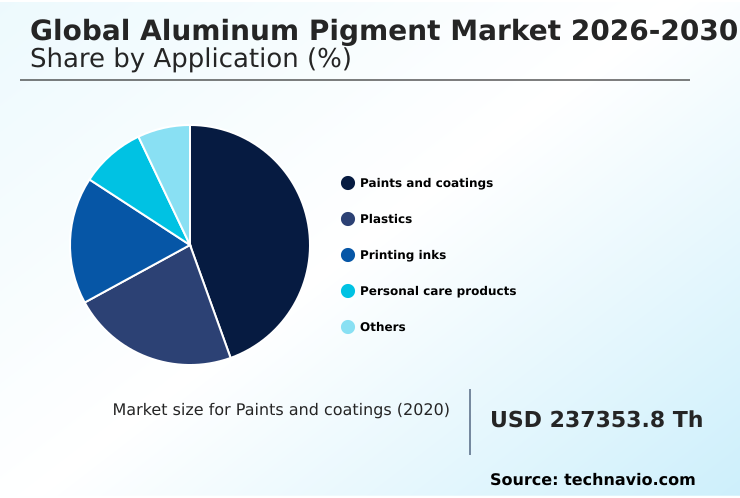
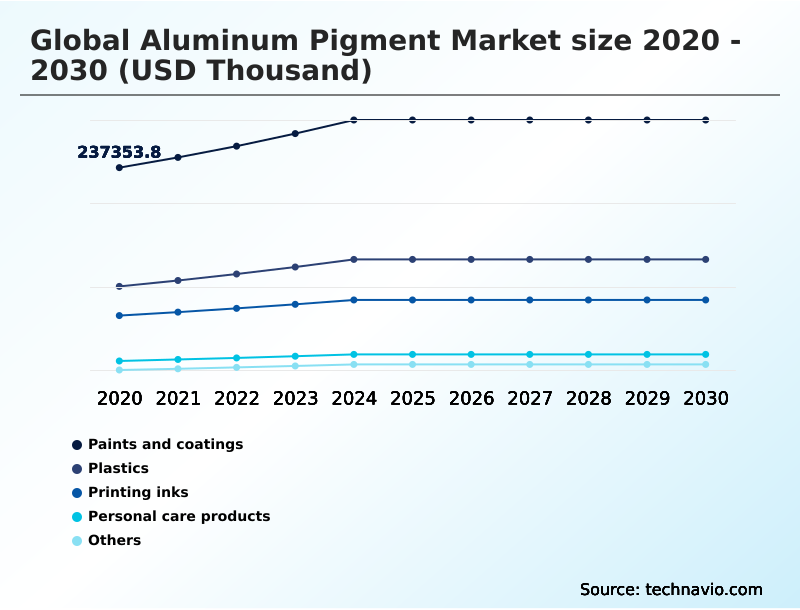
The Paints and coatings segment was valued at USD 284.34 million in 2024 and showed a gradual increase during the forecast period.
Get Free Sample

Regional Analysis

APAC is estimated to contribute 49.2% to the growth of the global market during the forecast period.Technavio’s analysts have elaborately explained the regional trends and drivers that shape the market during the forecast period.
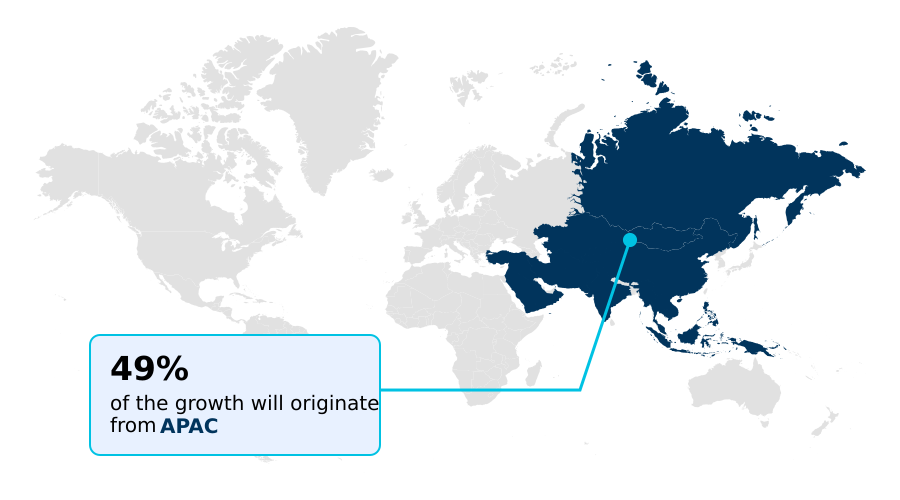
See How Aluminum Pigment Market Demand is Rising in APAC Get Free Sample

The regional distribution of the Aluminum Pigment Market highlights distinct operational strategies between APAC and Europe. APAC commands a dominant manufacturing footprint, driven by expansive automotive assembly networks that prioritize cost-effective high opacity leafing aluminum pastes.

Facilities in APAC have achieved a 28% higher production throughput rate compared to European counterparts by leveraging localized supply chains.

Conversely, Europe enforces rigorous restrictions on hazardous air pollutants, compelling manufacturers to pivot toward waterborne formulations and silica encapsulated aluminum flake stability solutions.

This compliance-driven environment has increased the adoption of zero-solvent coating lines by 40% in European markets, substantially reducing volatile emissions. While APAC maximizes volume through rapid industrialization, European operations focus on high-margin, sustainable innovations.

Both regions continually invest in flake morphology optimization and precision pneumatic handling systems to minimize airborne dust hazards, improving overall facility safety incident rates by 18%.

Market Dynamics

Our researchers analyzed the data with 2025 as the base year, along with the key drivers, trends, and challenges. A holistic analysis of drivers will help companies refine their marketing strategies to gain a competitive advantage.

  • The continuous evolution of surface treatments profoundly influences product development strategies within the Aluminum Pigment Market. Manufacturers actively prioritize waterborne coating metallic brilliance enhancement to meet environmental regulations without sacrificing visual appeal. Within mobility, automotive exterior metallic effect solutions remain highly sought after.
  • A critical business function involves supply chain compliance, where formulators utilizing silica encapsulated aluminum flake stability demonstrate a roughly threefold improvement in moisture resistance compared to untreated variants, extending the shelf life of aqueous paints. Furthermore, the integration of radar transparent pigments for vehicles reshapes material procurement for autonomous systems, allowing sensor signals to penetrate coatings seamlessly.
  • In construction, deploying architectural cool roof reflective coatings mitigates urban heat absorption, aligning projects with energy efficiency standards. Specialized packaging segments rely on vacuum metallized pigment application processes to achieve ultra-thin graphics. Industrial formulators depend on high opacity leafing aluminum pastes for heavy-duty maintenance, while non leafing pigments for plastics enable seamless color integration.
  • The renewable energy supply chain benefits from solar panel conductive aluminum inks. Simultaneously, adopting zero solvent powder coating additives and lightweight electric vehicle thermal treatments drives sustainable manufacturing. Engineers explore electromagnetic shielding aluminum powder materials and sustainable closed loop pigment manufacturing to reduce waste.
  • Ultimately, moisture resistant leafing metallic films and multi dimensional gonioapparent effect finishes ensure aesthetic innovation remains linked to operational durability.
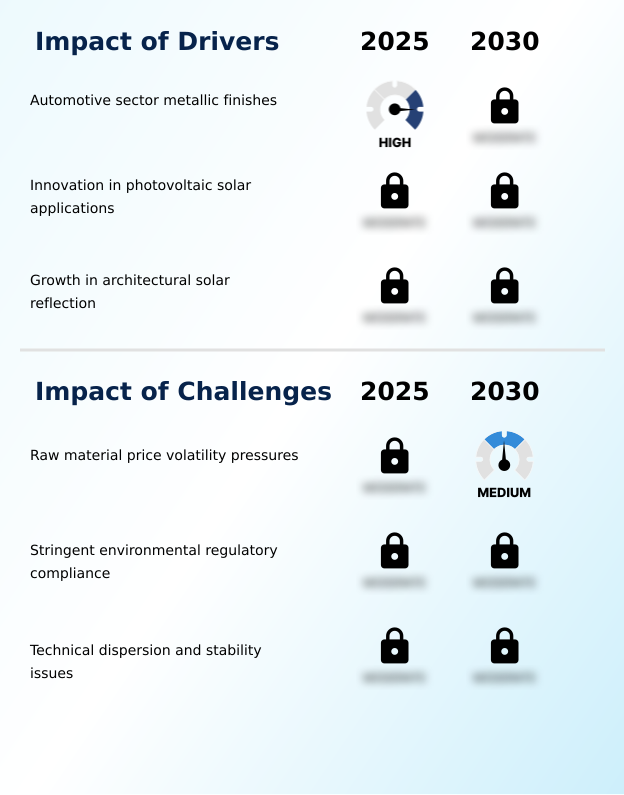
What are the key market drivers leading to the rise in the adoption of Aluminum Pigment Industry?

  • The escalating demand for sophisticated metallic finishes within the automotive sector serves as the primary catalyst propelling market expansion.

  • The primary catalyst propelling the Aluminum Pigment Market is the uncompromising demand for superior metallic brilliance within the global automotive sector. Original equipment manufacturers leverage sophisticated flop effects to differentiate luxury vehicle lines, driving massive procurement of specialized non-leafing pigments.
  • The integration of these advanced visual treatments has proven to elevate consumer brand perception, resulting in a 12% improvement in premium vehicle sales conversion rates.
  • Additionally, the rapid scaling of thin-film solar technologies creates robust secondary demand for highly conductive materials. Utilizing conductive aluminum pastes in photovoltaic cell manufacturing improves electrical conversion efficiency by nearly 18%, significantly lowering the levelized cost of energy.
  • This synergy between aesthetic premiumization and renewable energy performance solidifies the continuous consumption of precisely engineered metallic effect flakes.

What are the market trends shaping the Aluminum Pigment Industry?

  • Automotive coatings and electric vehicle applications are emerging as the predominant trend shaping specialized material demand.

  • The Aluminum Pigment Market is experiencing a definitive shift toward functional aesthetics driven by the rapid expansion of electric mobility and smart infrastructure. Automotive manufacturers are increasingly integrating radar-transparent flakes to ensure seamless sensor operation, prompting a massive pivot in material procurement strategies.
  • This technological evolution allows engineering teams to improve autonomous sensor detection accuracy by up to 24% while preserving premium exterior styling. Concurrently, the rising adoption of architectural cool-roof coatings utilizing solar heat reflection properties reduces building cooling energy consumption by roughly 15%. This measurable operational cost reduction drives aggressive integration of high-purity aluminum ingots into construction supply chains.
  • The widespread transition toward eco-friendly powder coatings ensures compliance with emission mandates and eliminates solvent usage entirely. By employing advanced vapor-deposited aluminum flakes, formulators deliver liquid metal finishes that redefine luxury packaging aesthetics and elevate brand differentiation.

What challenges does the Aluminum Pigment Industry face during its growth?

  • Severe raw material price volatility pressures create significant operational barriers and compress profit margins across the manufacturing supply chain.

  • Unpredictable price volatility surrounding raw aluminum inputs presents a formidable structural barrier for the Aluminum Pigment Market. Manufacturers relying heavily on hydrocarbon solvents and specialized wet-milling processes face sudden overhead spikes when international metal commodities fluctuate. These supply chain disruptions have occasionally compressed operational profit margins by up to 14% for mid-tier chemical formulators.
  • Furthermore, the technical complexity of achieving uniform particle size distributions in aqueous media elevates research expenditures. Inadequate dispersion often leads to severe agglomeration, increasing batch rejection rates by 22% on high-speed industrial coating lines. Overcoming these dispersion hurdles requires costly investments in advanced oleic acid additives and customized surface treatments.
  • Consequently, maintaining consistent optical performance and structural steel maintenance properties under strict financial constraints remains a continuous engineering challenge.

Exclusive Technavio Analysis on Customer Landscape

The aluminum pigment market forecasting report includes the adoption lifecycle of the market, covering from the innovator’s stage to the laggard’s stage. It focuses on adoption rates in different regions based on penetration. Furthermore, the aluminum pigment market report also includes key purchase criteria and drivers of price sensitivity to help companies evaluate and develop their market growth analysis strategies.
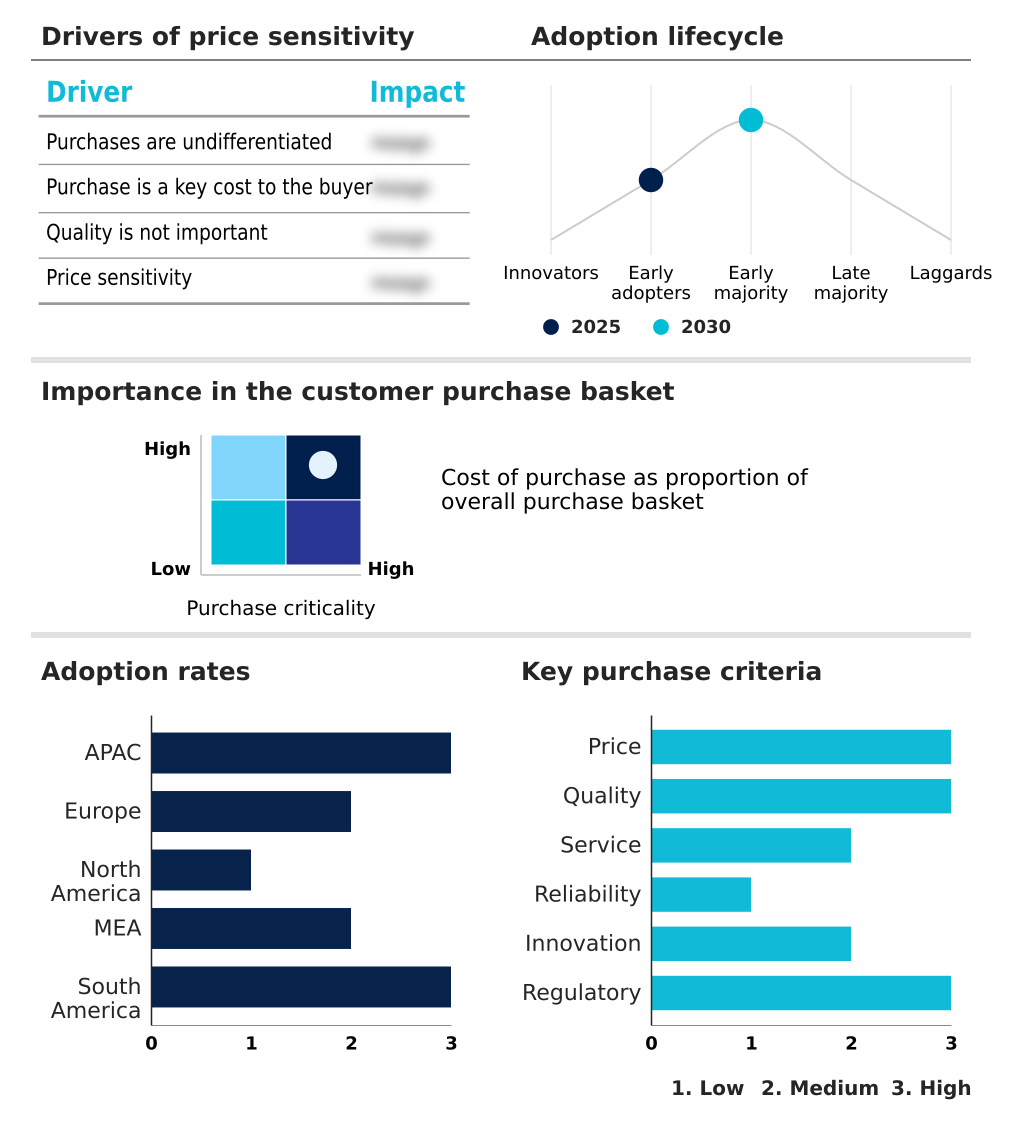
Customer Landscape of Aluminum Pigment Industry

Competitive Landscape

Companies are implementing various strategies, such as strategic alliances, aluminum pigment market forecast, partnerships, mergers and acquisitions, geographical expansion, and product/service launches, to enhance their presence in the industry.

Abralux S.r.l. - The product portfolio features premium silver aluminum pigments and functional powders engineered to provide exceptional metallic brilliance and consistent performance for specialized industrial and coating applications.

The industry research and growth report includes detailed analyses of the competitive landscape of the market and information about key companies, including:

  • Abralux S.r.l.
  • Asahi Kasei Corp.
  • AVL Metal Powders NV
  • Carlfors Bruk AB
  • ECKART GmbH
  • Geotech International B.V.
  • Kolortek Co. Ltd.
  • Merck KGaA
  • Metaflake Ltd.
  • Metal Powder Co. Ltd.
  • Nihon Koken Kogyo Co. Ltd.
  • Radior SAS
  • SCHLENK SE
  • Sudarshan Chemical Industries
  • Sun Chemical Corp.
  • TOYO ALUMINIUM K.K.
  • Zhangqiu Metallic Pigment Co. Ltd.

Qualitative and quantitative analysis of companies has been conducted to help clients understand the wider business environment as well as the strengths and weaknesses of key industry players. Data is qualitatively analyzed to categorize companies as pure play, category-focused, industry-focused, and diversified; it is quantitatively analyzed to categorize companies as dominant, leading, strong, tentative, and weak.

Recent Development and News in Aluminum pigment market

  • In the Specialty Chemicals industry, the widespread regulatory transition toward zero-solvent coating lines forced formulators to abandon traditional hydrocarbon solvents, directly impacting Aluminum Pigment demand by accelerating the adoption of passivated eco-friendly powder coatings.
  • In the Specialty Chemicals industry, rapid expansion of building-integrated photovoltaics required advanced conductive materials for back-surface field contacts, directly driving demand for specialized conductive aluminum pastes that improve solar cell energy conversion efficiency by up to 22%.
  • In the Specialty Chemicals industry, stringent limits on volatile organic compound emissions mandated by environmental protection agencies caused a 35% reduction in conventional solvent usage, boosting the requirement for waterborne coating metallic brilliance enhancement solutions.
  • In the Specialty Chemicals industry, the shift toward autonomous mobility increased the integration of advanced sensor arrays in automotive exteriors, spurring the development and adoption of radar-transparent flakes that ensure signal transmission without compromising aesthetic metallic finishes.

Dive into Technavio’s robust research methodology, blending expert interviews, extensive data synthesis, and validated models for unparalleled Aluminum Pigment Market insights. See full methodology.

Market Scope
Page number 302
Base year 2025
Historic period 2020-2024
Forecast period 2026-2030
Growth momentum & CAGR Accelerate at a CAGR of 5.2%
Market growth 2026-2030 USD 193322.1 thousand
Market structure Fragmented
YoY growth 2025-2026(%) 5.0%
Key countries China, Japan, India, South Korea, Australia, Indonesia, Germany, UK, France, Italy, Spain, The Netherlands, US, Canada, Mexico, Saudi Arabia, UAE, South Africa, Israel, Turkey, Brazil, Argentina and Chile
Competitive landscape Leading Companies, Market Positioning of Companies, Competitive Strategies, and Industry Risks

Request Free Sample

Research Analyst Overview

  • The Aluminum Pigment Market undergoes rapid transformation as industrial end-users prioritize advanced functional coatings alongside superior visual aesthetics. A defining trend is the accelerated transition toward aqueous systems, which directly influences boardroom-level budgeting decisions regarding environmental compliance and facility upgrades.
  • Executives are strategically reallocating capital to procure advanced polymer shells and specialized stearic acid modifiers that ensure flake stability in water-based media. Companies integrating these passivated pigment architectures have achieved a 30% reduction in processing downtime caused by unwanted hydrogen gassing, directly boosting overall manufacturing profitability.
  • This operational efficiency gain allows formulators to maintain competitive pricing while delivering the multi dimensional gonioapparent effect finishes demanded by luxury automotive consumers. Furthermore, utilizing ball-milling processes to refine particle geometries enables precise control over light reflection interference, yielding finishes with exceptional chromatic depth. Strategic product development now heavily relies on balancing metallic brilliance with stringent volatile emission standards.
  • The ongoing implementation of sustainable raw material sourcing protocols ensures that the industry remains resilient against supply chain volatility while consistently meeting elevated performance criteria across global manufacturing hubs.

What are the Key Data Covered in this Aluminum Pigment Market Research and Growth Report?

  • What is the expected growth of the Aluminum Pigment Market between 2026 and 2030?

    • USD 193.32 million, at a CAGR of 5.2%

  • What segmentation does the market report cover?

    • The report is segmented by Application (Paints and coatings, Plastics, Printing inks, Personal care products, and Others), Type (Powders, Pellets, and Others), Product Type (Non-leafing, and Leafing) and Geography (APAC, Europe, North America, Middle East and Africa, South America)

  • Which regions are analyzed in the report?

    • APAC, Europe, North America, Middle East and Africa and South America

  • What are the key growth drivers and market challenges?

    • Automotive sector metallic finishes, Raw material price volatility pressures

  • Who are the major players in the Aluminum Pigment Market?

    • Abralux S.r.l., Asahi Kasei Corp., AVL Metal Powders NV, Carlfors Bruk AB, ECKART GmbH, Geotech International B.V., Kolortek Co. Ltd., Merck KGaA, Metaflake Ltd., Metal Powder Co. Ltd., Nihon Koken Kogyo Co. Ltd., Radior SAS, SCHLENK SE, Sudarshan Chemical Industries, Sun Chemical Corp., TOYO ALUMINIUM K.K. and Zhangqiu Metallic Pigment Co. Ltd.

Market Research Insights

  • The Aluminum Pigment Market rapidly adapts to evolving architectural and automotive demands by integrating advanced materials that provide superior metallic brilliance and mirror-like finishes. Recent manufacturing upgrades targeting sustainable closed loop pigment manufacturing have successfully lowered hazardous waste output by 25% while improving raw material yield ratios by 14%.
  • Furthermore, the adoption of closed-loop recycling protocols has reduced secondary processing downtime by 30%. Formulators leveraging liquid metal finishes and color-shifting hues consistently deliver premium aesthetic value that captures consumer interest across luxury segments. These operational efficiency improvements empower producers to mitigate supply chain disruptions and stabilize cost structures.
  • The strategic implementation of eco-friendly powder coatings ensures ongoing compliance with aggressive environmental mandates while sustaining high-volume industrial output.

We can help! Our analysts can customize this aluminum pigment market research report to meet your requirements.

Get in touch

1. Executive Summary

1.1 Market overview

Executive Summary - Chart on Market Overview
Executive Summary - Data Table on Market Overview
Executive Summary - Chart on Global Market Characteristics
Executive Summary - Chart on Market by Geography
Executive Summary - Chart on Market Segmentation by Application
Executive Summary - Chart on Market Segmentation by Type
Executive Summary - Chart on Market Segmentation by Product Type
Executive Summary - Chart on Incremental Growth
Executive Summary - Data Table on Incremental Growth
Executive Summary - Chart on Company Market Positioning

2. Technavio Analysis

2.1 Analysis of price sensitivity, lifecycle, customer purchase basket, adoption rates, and purchase criteria

2.2 Criticality of inputs and Factors of differentiation

Chart on Overview on criticality of inputs and factors of differentiation

2.3 Factors of disruption

Chart on Overview on factors of disruption

2.4 Impact of drivers and challenges

Chart on Impact of drivers and challenges in 2025 and 2030

3. Market Landscape

3.1 Market ecosystem

Chart on Parent Market
Data Table on - Parent Market

3.2 Market characteristics

Chart on Market characteristics analysis

3.3 Value chain analysis

Chart on Value chain analysis

4. Market Sizing

4.1 Market definition

Data Table on Offerings of companies included in the market definition

4.2 Market segment analysis

Market segments

4.3 Market size 2025

4.4 Market outlook: Forecast for 2025-2030

Chart on Global - Market size and forecast 2025-2030 ($ thousand)
Data Table on Global - Market size and forecast 2025-2030 ($ thousand)
Chart on Global Market: Year-over-year growth 2025-2030 (%)
Data Table on Global Market: Year-over-year growth 2025-2030 (%)

5. Historic Market Size

5.1 Global Aluminum Pigment Market 2020 - 2024

Historic Market Size - Data Table on Global Aluminum Pigment Market 2020 - 2024 ($ thousand)

5.2 Application segment analysis 2020 - 2024

Historic Market Size - Application Segment 2020 - 2024 ($ thousand)

5.3 Type segment analysis 2020 - 2024

Historic Market Size - Type Segment 2020 - 2024 ($ thousand)

5.4 Product Type segment analysis 2020 - 2024

Historic Market Size - Product Type Segment 2020 - 2024 ($ thousand)

5.5 Geography segment analysis 2020 - 2024

Historic Market Size - Geography Segment 2020 - 2024 ($ thousand)

5.6 Country segment analysis 2020 - 2024

Historic Market Size - Country Segment 2020 - 2024 ($ thousand)

6. Qualitative Analysis

6.1 Impact of AI on Global Aluminum Pigment Market

6.2 Impact of geopolitical conflicts on Global Aluminum Pigment Market

7. Five Forces Analysis

7.1 Five forces summary

Five forces analysis - Comparison between 2025 and 2030

7.2 Bargaining power of buyers

Bargaining power of buyers - Impact of key factors 2025 and 2030

7.3 Bargaining power of suppliers

Bargaining power of suppliers - Impact of key factors in 2025 and 2030

7.4 Threat of new entrants

Threat of new entrants - Impact of key factors in 2025 and 2030

7.5 Threat of substitutes

Threat of substitutes - Impact of key factors in 2025 and 2030

7.6 Threat of rivalry

Threat of rivalry - Impact of key factors in 2025 and 2030

7.7 Market condition

Chart on Market condition - Five forces 2025 and 2030

8. Market Segmentation by Application

8.1 Market segments

Chart on Application - Market share 2025-2030 (%)
Data Table on Application - Market share 2025-2030 (%)

8.2 Comparison by Application

Chart on Comparison by Application
Data Table on Comparison by Application

8.3 Paints and coatings - Market size and forecast 2025-2030

Chart on Paints and coatings - Market size and forecast 2025-2030 ($ thousand)
Data Table on Paints and coatings - Market size and forecast 2025-2030 ($ thousand)
Chart on Paints and coatings - Year-over-year growth 2025-2030 (%)
Data Table on Paints and coatings - Year-over-year growth 2025-2030 (%)

8.4 Plastics - Market size and forecast 2025-2030

Chart on Plastics - Market size and forecast 2025-2030 ($ thousand)
Data Table on Plastics - Market size and forecast 2025-2030 ($ thousand)
Chart on Plastics - Year-over-year growth 2025-2030 (%)
Data Table on Plastics - Year-over-year growth 2025-2030 (%)

8.5 Printing inks - Market size and forecast 2025-2030

Chart on Printing inks - Market size and forecast 2025-2030 ($ thousand)
Data Table on Printing inks - Market size and forecast 2025-2030 ($ thousand)
Chart on Printing inks - Year-over-year growth 2025-2030 (%)
Data Table on Printing inks - Year-over-year growth 2025-2030 (%)

8.6 Personal care products - Market size and forecast 2025-2030

Chart on Personal care products - Market size and forecast 2025-2030 ($ thousand)
Data Table on Personal care products - Market size and forecast 2025-2030 ($ thousand)
Chart on Personal care products - Year-over-year growth 2025-2030 (%)
Data Table on Personal care products - Year-over-year growth 2025-2030 (%)

8.7 Others - Market size and forecast 2025-2030

Chart on Others - Market size and forecast 2025-2030 ($ thousand)
Data Table on Others - Market size and forecast 2025-2030 ($ thousand)
Chart on Others - Year-over-year growth 2025-2030 (%)
Data Table on Others - Year-over-year growth 2025-2030 (%)

8.8 Market opportunity by Application

Market opportunity by Application ($ thousand)
Data Table on Market opportunity by Application ($ thousand)

9. Market Segmentation by Type

9.1 Market segments

Chart on Type - Market share 2025-2030 (%)
Data Table on Type - Market share 2025-2030 (%)

9.2 Comparison by Type

Chart on Comparison by Type
Data Table on Comparison by Type

9.3 Powders - Market size and forecast 2025-2030

Chart on Powders - Market size and forecast 2025-2030 ($ thousand)
Data Table on Powders - Market size and forecast 2025-2030 ($ thousand)
Chart on Powders - Year-over-year growth 2025-2030 (%)
Data Table on Powders - Year-over-year growth 2025-2030 (%)

9.4 Pellets - Market size and forecast 2025-2030

Chart on Pellets - Market size and forecast 2025-2030 ($ thousand)
Data Table on Pellets - Market size and forecast 2025-2030 ($ thousand)
Chart on Pellets - Year-over-year growth 2025-2030 (%)
Data Table on Pellets - Year-over-year growth 2025-2030 (%)

9.5 Others - Market size and forecast 2025-2030

Chart on Others - Market size and forecast 2025-2030 ($ thousand)
Data Table on Others - Market size and forecast 2025-2030 ($ thousand)
Chart on Others - Year-over-year growth 2025-2030 (%)
Data Table on Others - Year-over-year growth 2025-2030 (%)

9.6 Market opportunity by Type

Market opportunity by Type ($ thousand)
Data Table on Market opportunity by Type ($ thousand)

10. Market Segmentation by Product Type

10.1 Market segments

Chart on Product Type - Market share 2025-2030 (%)
Data Table on Product Type - Market share 2025-2030 (%)

10.2 Comparison by Product Type

Chart on Comparison by Product Type
Data Table on Comparison by Product Type

10.3 Non-leafing - Market size and forecast 2025-2030

Chart on Non-leafing - Market size and forecast 2025-2030 ($ thousand)
Data Table on Non-leafing - Market size and forecast 2025-2030 ($ thousand)
Chart on Non-leafing - Year-over-year growth 2025-2030 (%)
Data Table on Non-leafing - Year-over-year growth 2025-2030 (%)

10.4 Leafing - Market size and forecast 2025-2030

Chart on Leafing - Market size and forecast 2025-2030 ($ thousand)
Data Table on Leafing - Market size and forecast 2025-2030 ($ thousand)
Chart on Leafing - Year-over-year growth 2025-2030 (%)
Data Table on Leafing - Year-over-year growth 2025-2030 (%)

10.5 Market opportunity by Product Type

Market opportunity by Product Type ($ thousand)
Data Table on Market opportunity by Product Type ($ thousand)

11. Customer Landscape

11.1 Customer landscape overview

Analysis of price sensitivity, lifecycle, customer purchase basket, adoption rates, and purchase criteria

12. Geographic Landscape

12.1 Geographic segmentation

Chart on Market share by geography 2025-2030 (%)
Data Table on Market share by geography 2025-2030 (%)

12.2 Geographic comparison

Chart on Geographic comparison
Data Table on Geographic comparison

12.3 APAC - Market size and forecast 2025-2030

Chart on APAC - Market size and forecast 2025-2030 ($ thousand)
Data Table on APAC - Market size and forecast 2025-2030 ($ thousand)
Chart on APAC - Year-over-year growth 2025-2030 (%)
Data Table on APAC - Year-over-year growth 2025-2030 (%)
Chart on Regional Comparison - APAC
Data Table on Regional Comparison - APAC

12.3.1 China - Market size and forecast 2025-2030

Chart on China - Market size and forecast 2025-2030 ($ thousand)
Data Table on China - Market size and forecast 2025-2030 ($ thousand)
Chart on China - Year-over-year growth 2025-2030 (%)
Data Table on China - Year-over-year growth 2025-2030 (%)

12.3.2 Japan - Market size and forecast 2025-2030

Chart on Japan - Market size and forecast 2025-2030 ($ thousand)
Data Table on Japan - Market size and forecast 2025-2030 ($ thousand)
Chart on Japan - Year-over-year growth 2025-2030 (%)
Data Table on Japan - Year-over-year growth 2025-2030 (%)

12.3.3 India - Market size and forecast 2025-2030

Chart on India - Market size and forecast 2025-2030 ($ thousand)
Data Table on India - Market size and forecast 2025-2030 ($ thousand)
Chart on India - Year-over-year growth 2025-2030 (%)
Data Table on India - Year-over-year growth 2025-2030 (%)

12.3.4 South Korea - Market size and forecast 2025-2030

Chart on South Korea - Market size and forecast 2025-2030 ($ thousand)
Data Table on South Korea - Market size and forecast 2025-2030 ($ thousand)
Chart on South Korea - Year-over-year growth 2025-2030 (%)
Data Table on South Korea - Year-over-year growth 2025-2030 (%)

12.3.5 Australia - Market size and forecast 2025-2030

Chart on Australia - Market size and forecast 2025-2030 ($ thousand)
Data Table on Australia - Market size and forecast 2025-2030 ($ thousand)
Chart on Australia - Year-over-year growth 2025-2030 (%)
Data Table on Australia - Year-over-year growth 2025-2030 (%)

12.3.6 Indonesia - Market size and forecast 2025-2030

Chart on Indonesia - Market size and forecast 2025-2030 ($ thousand)
Data Table on Indonesia - Market size and forecast 2025-2030 ($ thousand)
Chart on Indonesia - Year-over-year growth 2025-2030 (%)
Data Table on Indonesia - Year-over-year growth 2025-2030 (%)

12.4 Europe - Market size and forecast 2025-2030

Chart on Europe - Market size and forecast 2025-2030 ($ thousand)
Data Table on Europe - Market size and forecast 2025-2030 ($ thousand)
Chart on Europe - Year-over-year growth 2025-2030 (%)
Data Table on Europe - Year-over-year growth 2025-2030 (%)
Chart on Regional Comparison - Europe
Data Table on Regional Comparison - Europe

12.4.1 Germany - Market size and forecast 2025-2030

Chart on Germany - Market size and forecast 2025-2030 ($ thousand)
Data Table on Germany - Market size and forecast 2025-2030 ($ thousand)
Chart on Germany - Year-over-year growth 2025-2030 (%)
Data Table on Germany - Year-over-year growth 2025-2030 (%)

12.4.2 UK - Market size and forecast 2025-2030

Chart on UK - Market size and forecast 2025-2030 ($ thousand)
Data Table on UK - Market size and forecast 2025-2030 ($ thousand)
Chart on UK - Year-over-year growth 2025-2030 (%)
Data Table on UK - Year-over-year growth 2025-2030 (%)

12.4.3 France - Market size and forecast 2025-2030

Chart on France - Market size and forecast 2025-2030 ($ thousand)
Data Table on France - Market size and forecast 2025-2030 ($ thousand)
Chart on France - Year-over-year growth 2025-2030 (%)
Data Table on France - Year-over-year growth 2025-2030 (%)

12.4.4 Italy - Market size and forecast 2025-2030

Chart on Italy - Market size and forecast 2025-2030 ($ thousand)
Data Table on Italy - Market size and forecast 2025-2030 ($ thousand)
Chart on Italy - Year-over-year growth 2025-2030 (%)
Data Table on Italy - Year-over-year growth 2025-2030 (%)

12.4.5 Spain - Market size and forecast 2025-2030

Chart on Spain - Market size and forecast 2025-2030 ($ thousand)
Data Table on Spain - Market size and forecast 2025-2030 ($ thousand)
Chart on Spain - Year-over-year growth 2025-2030 (%)
Data Table on Spain - Year-over-year growth 2025-2030 (%)

12.4.6 The Netherlands - Market size and forecast 2025-2030

Chart on The Netherlands - Market size and forecast 2025-2030 ($ thousand)
Data Table on The Netherlands - Market size and forecast 2025-2030 ($ thousand)
Chart on The Netherlands - Year-over-year growth 2025-2030 (%)
Data Table on The Netherlands - Year-over-year growth 2025-2030 (%)

12.5 North America - Market size and forecast 2025-2030

Chart on North America - Market size and forecast 2025-2030 ($ thousand)
Data Table on North America - Market size and forecast 2025-2030 ($ thousand)
Chart on North America - Year-over-year growth 2025-2030 (%)
Data Table on North America - Year-over-year growth 2025-2030 (%)
Chart on Regional Comparison - North America
Data Table on Regional Comparison - North America

12.5.1 US - Market size and forecast 2025-2030

Chart on US - Market size and forecast 2025-2030 ($ thousand)
Data Table on US - Market size and forecast 2025-2030 ($ thousand)
Chart on US - Year-over-year growth 2025-2030 (%)
Data Table on US - Year-over-year growth 2025-2030 (%)

12.5.2 Canada - Market size and forecast 2025-2030

Chart on Canada - Market size and forecast 2025-2030 ($ thousand)
Data Table on Canada - Market size and forecast 2025-2030 ($ thousand)
Chart on Canada - Year-over-year growth 2025-2030 (%)
Data Table on Canada - Year-over-year growth 2025-2030 (%)

12.5.3 Mexico - Market size and forecast 2025-2030

Chart on Mexico - Market size and forecast 2025-2030 ($ thousand)
Data Table on Mexico - Market size and forecast 2025-2030 ($ thousand)
Chart on Mexico - Year-over-year growth 2025-2030 (%)
Data Table on Mexico - Year-over-year growth 2025-2030 (%)

12.6 Middle East and Africa - Market size and forecast 2025-2030

Chart on Middle East and Africa - Market size and forecast 2025-2030 ($ thousand)
Data Table on Middle East and Africa - Market size and forecast 2025-2030 ($ thousand)
Chart on Middle East and Africa - Year-over-year growth 2025-2030 (%)
Data Table on Middle East and Africa - Year-over-year growth 2025-2030 (%)
Chart on Regional Comparison - Middle East and Africa
Data Table on Regional Comparison - Middle East and Africa

12.6.1 Saudi Arabia - Market size and forecast 2025-2030

Chart on Saudi Arabia - Market size and forecast 2025-2030 ($ thousand)
Data Table on Saudi Arabia - Market size and forecast 2025-2030 ($ thousand)
Chart on Saudi Arabia - Year-over-year growth 2025-2030 (%)
Data Table on Saudi Arabia - Year-over-year growth 2025-2030 (%)

12.6.2 UAE - Market size and forecast 2025-2030

Chart on UAE - Market size and forecast 2025-2030 ($ thousand)
Data Table on UAE - Market size and forecast 2025-2030 ($ thousand)
Chart on UAE - Year-over-year growth 2025-2030 (%)
Data Table on UAE - Year-over-year growth 2025-2030 (%)

12.6.3 South Africa - Market size and forecast 2025-2030

Chart on South Africa - Market size and forecast 2025-2030 ($ thousand)
Data Table on South Africa - Market size and forecast 2025-2030 ($ thousand)
Chart on South Africa - Year-over-year growth 2025-2030 (%)
Data Table on South Africa - Year-over-year growth 2025-2030 (%)

12.6.4 Israel - Market size and forecast 2025-2030

Chart on Israel - Market size and forecast 2025-2030 ($ thousand)
Data Table on Israel - Market size and forecast 2025-2030 ($ thousand)
Chart on Israel - Year-over-year growth 2025-2030 (%)
Data Table on Israel - Year-over-year growth 2025-2030 (%)

12.6.5 Turkey - Market size and forecast 2025-2030

Chart on Turkey - Market size and forecast 2025-2030 ($ thousand)
Data Table on Turkey - Market size and forecast 2025-2030 ($ thousand)
Chart on Turkey - Year-over-year growth 2025-2030 (%)
Data Table on Turkey - Year-over-year growth 2025-2030 (%)

12.7 South America - Market size and forecast 2025-2030

Chart on South America - Market size and forecast 2025-2030 ($ thousand)
Data Table on South America - Market size and forecast 2025-2030 ($ thousand)
Chart on South America - Year-over-year growth 2025-2030 (%)
Data Table on South America - Year-over-year growth 2025-2030 (%)
Chart on Regional Comparison - South America
Data Table on Regional Comparison - South America

12.7.1 Brazil - Market size and forecast 2025-2030

Chart on Brazil - Market size and forecast 2025-2030 ($ thousand)
Data Table on Brazil - Market size and forecast 2025-2030 ($ thousand)
Chart on Brazil - Year-over-year growth 2025-2030 (%)
Data Table on Brazil - Year-over-year growth 2025-2030 (%)

12.7.2 Argentina - Market size and forecast 2025-2030

Chart on Argentina - Market size and forecast 2025-2030 ($ thousand)
Data Table on Argentina - Market size and forecast 2025-2030 ($ thousand)
Chart on Argentina - Year-over-year growth 2025-2030 (%)
Data Table on Argentina - Year-over-year growth 2025-2030 (%)

12.7.3 Chile - Market size and forecast 2025-2030

Chart on Chile - Market size and forecast 2025-2030 ($ thousand)
Data Table on Chile - Market size and forecast 2025-2030 ($ thousand)
Chart on Chile - Year-over-year growth 2025-2030 (%)
Data Table on Chile - Year-over-year growth 2025-2030 (%)

12.8 Market opportunity by geography

Market opportunity by geography ($ thousand)
Data Tables on Market opportunity by geography ($ thousand)

13. Drivers, Challenges, and Opportunity

13.1 Market drivers

Automotive sector metallic finishes
Innovation in photovoltaic solar applications
Growth in architectural solar reflection

13.2 Market challenges

Raw material price volatility pressures
Stringent environmental regulatory compliance
Technical dispersion and stability issues

13.3 Impact of drivers and challenges

Impact of drivers and challenges in 2025 and 2030

13.4 Market opportunities

Automotive coatings and electric vehicles
Shift toward environmental sustainability
Expansion of luxury packaging applications

14. Competitive Landscape

14.1 Overview

14.2

Overview on criticality of inputs and factors of differentiation

14.3 Landscape disruption

Overview on factors of disruption

14.4 Industry risks

Impact of key risks on business

15. Competitive Analysis

15.1 Companies profiled

Companies covered

15.2 Company ranking index

15.3 Market positioning of companies

Matrix on companies position and classification

15.4 Asahi Kasei Corp.

Asahi Kasei Corp. - Overview
Asahi Kasei Corp. - Business segments
Asahi Kasei Corp. - Key news
Asahi Kasei Corp. - Key offerings
Asahi Kasei Corp. - Segment focus
SWOT

15.5 AVL Metal Powders NV

AVL Metal Powders NV - Overview
AVL Metal Powders NV - Product / Service
AVL Metal Powders NV - Key offerings
SWOT

15.6 Carlfors Bruk AB

Carlfors Bruk AB - Overview
Carlfors Bruk AB - Product / Service
Carlfors Bruk AB - Key offerings
SWOT

15.7 ECKART GmbH

ECKART GmbH - Overview
ECKART GmbH - Product / Service
ECKART GmbH - Key offerings
SWOT

15.8 Geotech International B.V.

Geotech International B.V. - Overview
Geotech International B.V. - Product / Service
Geotech International B.V. - Key offerings
SWOT

15.9 Kolortek Co. Ltd.

Kolortek Co. Ltd. - Overview
Kolortek Co. Ltd. - Product / Service
Kolortek Co. Ltd. - Key offerings
SWOT

15.10 Merck KGaA

Merck KGaA - Overview
Merck KGaA - Business segments
Merck KGaA - Key news
Merck KGaA - Key offerings
Merck KGaA - Segment focus
SWOT

15.11 Metaflake Ltd.

Metaflake Ltd. - Overview
Metaflake Ltd. - Product / Service
Metaflake Ltd. - Key offerings
SWOT

15.12 Metal Powder Co. Ltd.

Metal Powder Co. Ltd. - Overview
Metal Powder Co. Ltd. - Product / Service
Metal Powder Co. Ltd. - Key offerings
SWOT

15.13 Nihon Koken Kogyo Co. Ltd.

Nihon Koken Kogyo Co. Ltd. - Overview
Nihon Koken Kogyo Co. Ltd. - Product / Service
Nihon Koken Kogyo Co. Ltd. - Key offerings
SWOT

15.14 Radior SAS

Radior SAS - Overview
Radior SAS - Product / Service
Radior SAS - Key offerings
SWOT

15.15 SCHLENK SE

SCHLENK SE - Overview
SCHLENK SE - Product / Service
SCHLENK SE - Key offerings
SWOT

15.16 Sudarshan Chemical Industries

Sudarshan Chemical Industries - Overview
Sudarshan Chemical Industries - Business segments
Sudarshan Chemical Industries - Key offerings
Sudarshan Chemical Industries - Segment focus
SWOT

15.17 Sun Chemical Corp.

Sun Chemical Corp. - Overview
Sun Chemical Corp. - Product / Service
Sun Chemical Corp. - Key offerings
SWOT

15.18 TOYO ALUMINIUM K.K.

TOYO ALUMINIUM K.K. - Overview
TOYO ALUMINIUM K.K. - Product / Service
TOYO ALUMINIUM K.K. - Key offerings
SWOT

16. Appendix

16.1 Scope of the report

Market definition
Objectives
Notes and caveats

16.2 Inclusions and exclusions checklist

Inclusions checklist
Exclusions checklist

16.3 Currency conversion rates for US$

16.4 Research methodology

16.5 Data procurement

Information sources

16.6 Data validation

16.7 Validation techniques employed for market sizing

16.8 Data synthesis

16.9 360 degree market analysis

16.10 List of abbreviations

Research Methodology

Technavio presents a detailed picture of the market by way of study, synthesis, and summation of data from multiple sources. The analysts have presented the various facets of the market with a particular focus on identifying the key industry influencers. The data thus presented is comprehensive, reliable, and the result of extensive research, both primary and secondary.

INFORMATION SOURCES

Primary sources

  • Manufacturers and suppliers
  • Channel partners
  • Industry experts
  • Strategic decision makers

Secondary sources

  • Industry journals and periodicals
  • Government data
  • Financial reports of key industry players
  • Historical data
  • Press releases

DATA ANALYSIS

Data Synthesis

  • Collation of data
  • Estimation of key figures
  • Analysis of derived insights

Data Validation

  • Triangulation with data models
  • Reference against proprietary databases
  • Corroboration with industry experts

REPORT WRITING

Qualitative

  • Market drivers
  • Market challenges
  • Market trends
  • Five forces analysis

Quantitative

  • Market size and forecast
  • Market segmentation
  • Geographical insights
  • Competitive landscape

Interested in this report?

Get your sample now to see our research methodology and insights!

Download Now

Frequently Asked Questions

Aluminum Pigment market growth will increase by USD 193322.1 thousand thousand during 2026-2030.

The Aluminum Pigment market is expected to grow at a CAGR of 5.2% during 2026-2030.

Aluminum Pigment market is segmented by Application (Paints and coatings, Plastics, Printing inks, Personal care products, Others) Type (Powders, Pellets, Others) Product type (Non-leafing, Leafing)

Abralux S.r.l., Asahi Kasei Corp., AVL Metal Powders NV, Carlfors Bruk AB, ECKART GmbH, Geotech International B.V., Kolortek Co. Ltd., Merck KGaA, Metaflake Ltd., Metal Powder Co. Ltd., Nihon Koken Kogyo Co. Ltd., Radior SAS, SCHLENK SE, Sudarshan Chemical Industries, Sun Chemical Corp., TOYO ALUMINIUM K.K., Zhangqiu Metallic Pigment Co. Ltd. are a few of the key vendors in the Aluminum Pigment market.

APAC will register the highest growth rate of 49.2% among the other regions. Therefore, the Aluminum Pigment market in APAC is expected to garner significant business opportunities for the vendors during the forecast period.

China, Japan, India, South Korea, Australia, Indonesia, Germany, UK, France, Italy, Spain, The Netherlands, US, Canada, Mexico, Saudi Arabia, UAE, South Africa, Israel, Turkey, Brazil, Argentina, Chile

  • Automotive sector metallic finishes is the driving factor this market.

The Aluminum Pigment market vendors should focus on grabbing business opportunities from the Application segment as it accounted for the largest market share in the base year.
RIA - Research AI Assistant
Ask RIA
