
Ambulance Services Market Analysis, Size, and Forecast 2026-2030: North America (US, Canada, and Mexico), Europe (Germany, UK, and France), APAC (China, Japan, and India), South America (Brazil, Argentina, and Chile), Middle East and Africa (Saudi Arabia, UAE, and South Africa), and Rest of World (ROW)

Ambulance Services Market Analysis, Size, and Forecast 2026-2030:
North America (US, Canada, and Mexico), Europe (Germany, UK, and France), APAC (China, Japan, and India), South America (Brazil, Argentina, and Chile), Middle East and Africa (Saudi Arabia, UAE, and South Africa), and Rest of World (ROW)

Published: Oct 2026 291 Pages SKU: IRTNTR45741

Market Overview at a Glance

$15.51 B
Market Opportunity
6.8%
CAGR 2025 - 2030
36.7%
North America Growth
$23.47 B
Advance life support (ALS) ambulance services segment 2024

Ambulance Services Market Size 2026-2030

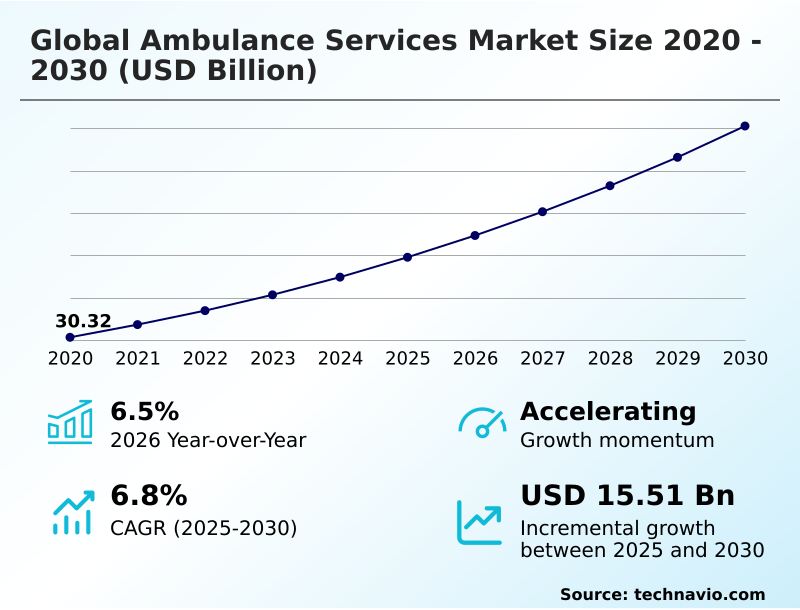
The ambulance services market size is valued to increase by USD 15.51 billion, at a CAGR of 6.8% from 2025 to 2030. Rising global geriatric population drives emergency medical response demand will drive the ambulance services market.

Major Market Trends & Insights

  • North America dominated the market and accounted for a 36.7% growth during the forecast period.
  • By Service Type - Advance life support (ALS) ambulance services segment was valued at USD 23.47 billion in 2024
  • By Type - Emergency segment accounted for the largest market revenue share in 2024

Market Size & Forecast

  • Market Opportunities: USD 24.97 billion
  • Market Future Opportunities: USD 15.51 billion
  • CAGR from 2025 to 2030 : 6.8%

Market Summary

  • The Ambulance Services market demonstrates continuous structural expansion as healthcare systems prioritize rapid clinical intervention and efficient patient transport logistics. Municipal health authorities and private fleet operators are heavily investing in mobile medical technology to stabilize critical patients during transit.
  • A primary driver of this demand is the rising demographic of elderly patients experiencing chronic health crises, which directly increases the frequency of acute emergency calls and routine inter-facility transfers. To accommodate this volume, dispatch centers implement centralized digital triage software, improving daily fleet utilization efficiency by 20% compared to legacy manual routing methods.
  • However, severe paramedic workforce shortages pose a substantial operational challenge, leading to elevated overtime costs and reduced active vehicle deployment during peak medical incident windows. To mitigate these labor constraints, transport providers utilize automated patient monitoring systems to support smaller medical crews.
  • The integration of telemedicine platforms inside emergency vehicles allows paramedics to transmit vital physiological data directly to destination hospitals, significantly reducing pre-arrival preparation time and elevating the overall standard of out-of-hospital stabilization.

What will be the Size of the Ambulance Services Market during the forecast period?
Get Key Insights on Market Forecast (PDF) Get Free Sample

How is the Ambulance Services Market Segmented?

The ambulance services industry research report provides comprehensive data (region-wise segment analysis), with forecasts and estimates in "USD million" for the period 2026-2030, as well as historical data from 2020-2024 for the following segments.

  • Service type
    • Advance life support (ALS) ambulance services
    • Basic life support (BLS) ambulance services
  • Type
    • Emergency
    • Non-emergency
  • Vehicle type
    • Ground ambulance
    • Air ambulance
    • Water ambulance
  • Geography
    • North America
      • US
      • Canada
      • Mexico
    • Europe
      • Germany
      • UK
      • France
      • Italy
      • Spain
      • The Netherlands
    • APAC
      • China
      • Japan
      • India
      • South Korea
      • Australia
      • Indonesia
    • South America
      • Brazil
      • Argentina
      • Chile
    • Middle East and Africa
      • Saudi Arabia
      • UAE
      • South Africa
      • Israel
      • Egypt

By Service Type Insights

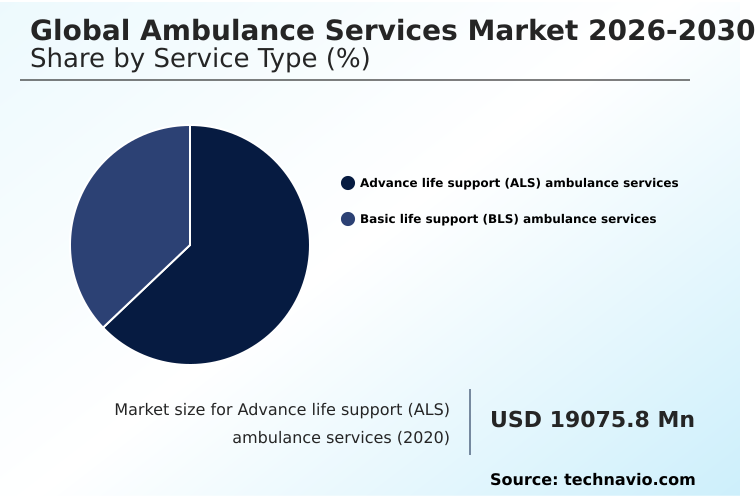
The advance life support (als) ambulance services segment is estimated to witness significant growth during the forecast period.

Advance life support operations represent the high-acuity tier of Ambulance Services, addressing complex clinical requirements before hospital admission. These mobile intensive care systems deliver sophisticated pre-hospital clinical care to patients experiencing severe medical crises.

Fleet operators prioritize acute trauma stabilization by outfitting vehicles with a modern cardiac monitoring system and automated external defibrillator arrays. Incorporating mechanical ventilator integration directly reduces patient deterioration risks during transit.

Additionally, specialized bariatric patient transport and neonatal transport unit logistics require custom vehicle chassis engineering to accommodate unique physiological profiles.

By upgrading communication protocols with a regional trauma center, providers ensure seamless medical data transmission, which improves triage accuracy by 15%.

This strategic focus on rapid trauma response enables healthcare networks to lower hospital readmission rates and optimize critical care continuity.
Get Free Sample

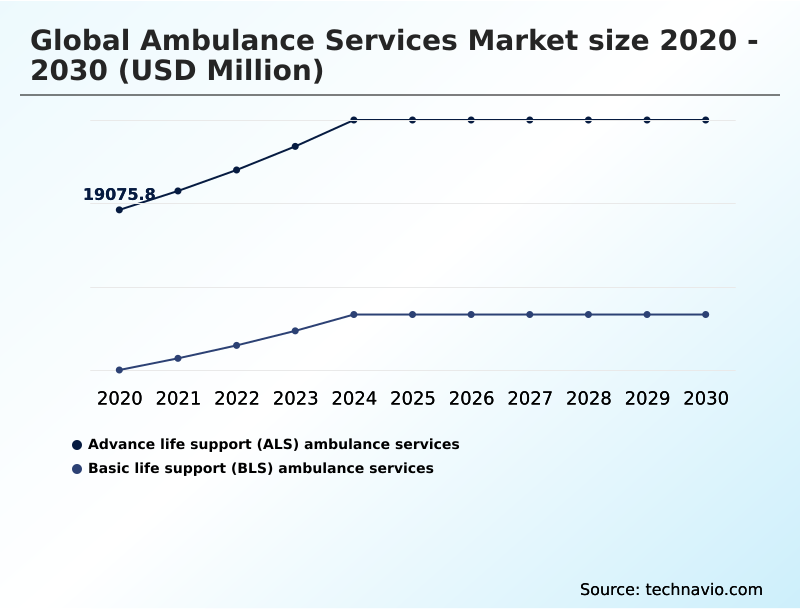
The Advance life support (ALS) ambulance services segment was valued at USD 23.47 billion in 2024 and showed a gradual increase during the forecast period.
Get Free Sample

Regional Analysis

North America is estimated to contribute 36.7% to the growth of the global market during the forecast period.Technavio’s analysts have elaborately explained the regional trends and drivers that shape the market during the forecast period.
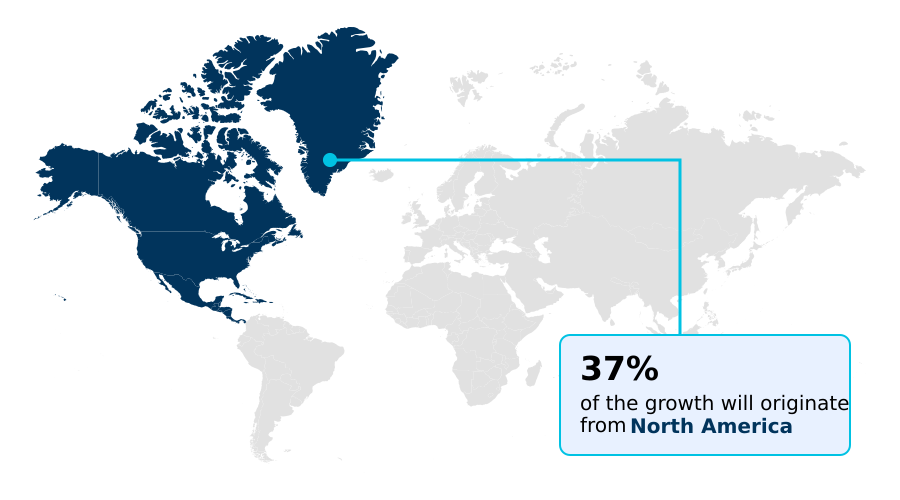
See How Ambulance Services Market Demand is Rising in North America Get Free Sample

The geographic landscape of the Ambulance Services sector highlights distinct operational contrasts between mature and developing territories.

North America maintains highly structured emergency response frameworks, achieving a 25% higher dispatch efficiency rate than South America due to extensive public-private partnership models.

In North America, the widespread deployment of a helicopter emergency medical network and standardized aeromedical evacuation protocol ensures rapid trauma response across vast rural healthcare coverage zones.

Conversely, emerging APAC markets are expanding basic life support fleets to address foundational transport gaps, improving interfacility patient transfer times by 18%. Furthermore, European operators are heavily investing in fixed-wing medical aircraft to support cross-border patient repatriation.

Across all regions, the integration of advanced clinical decision support software and sophisticated medical device outfitting allows paramedics to administer critical interventions faster, thereby reducing overall patient mortality risks by up to 12% during pre-hospital transit.

Market Dynamics

Our researchers analyzed the data with 2025 as the base year, along with the key drivers, trends, and challenges. A holistic analysis of drivers will help companies refine their marketing strategies to gain a competitive advantage.

  • The foundational architecture of Ambulance Services relies heavily on integrating sophisticated clinical technologies with rapid dispatch logistics to maximize patient survival outcomes. Providers managing advanced life support emergency response fleets deploy multi parameter cardiac monitoring equipment to analyze complex arrhythmias instantly.
  • For routine care, non-emergency basic life support transit plays a vital role in reducing hospital bed bottlenecks, delivering a 20% improvement in daily patient throughput compared to uncoordinated discharge processes. Ensuring seamless connectivity, real-time telemetry in medical transport facilitates immediate data sharing with physicians, creating a highly efficient interfacility patient transfer logistics network.
  • In critical scenarios, the implementation of a helicopter emergency medical evacuation protocol accelerates rural regional trauma center access for severe accident victims. Digital dispatch management optimization software further enhances response metrics, while algorithmic dispatch optimization for ambulances minimizes fuel waste and idle times.
  • Operators are continually exploring the electric vertical takeoff medical aviation sector to bypass urban gridlock, complementing broader initiatives toward hybrid emergency vehicle fleet modernization. Inside the cabin, pediatric and neonatal critical care transport units feature specialized incubators, and bariatric non-emergency medical transport vehicles employ reinforced chassis structures to ensure safe mobility.
  • Furthermore, automated external defibrillator fleet integration and mobile intensive care unit deployment guarantee immediate out-of-hospital stabilization. Through robust public private emergency healthcare partnership agreements, municipal authorities secure essential capital, while remote telemedicine consultation during transit empowers paramedics to perform advanced interventions flawlessly.
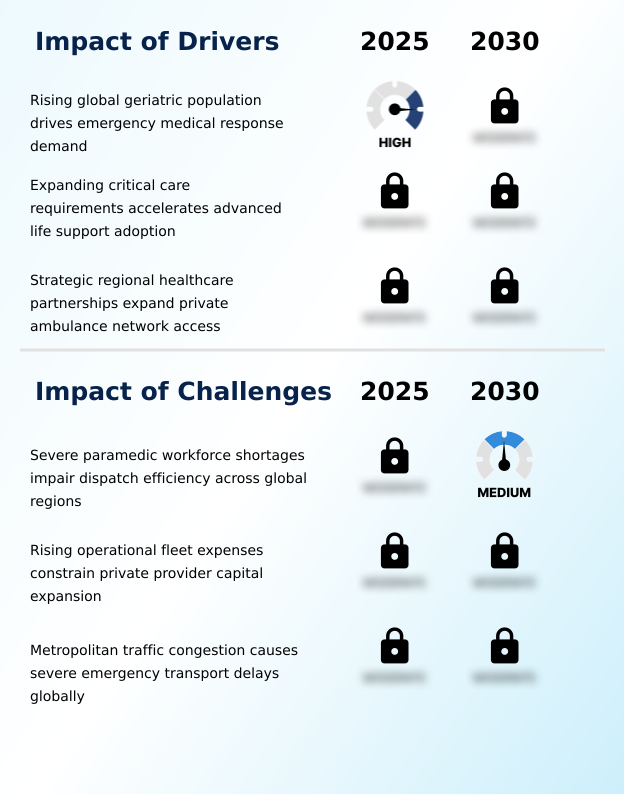
What are the key market drivers leading to the rise in the adoption of Ambulance Services Industry?

  • The rising geriatric population systematically drives demand for rapid emergency medical response and specialized interfacility patient transportation.

  • The escalating demographic health demand driven by an aging global population acts as a primary catalyst for the expansion of Ambulance Services.
  • High rates of chronic disease exacerbation compel healthcare networks to scale up advanced life support and specialized critical care fleets.
  • By deploying units equipped with a multi-parameter cardiac monitor and automated intravenous medication infusion pumps, providers can execute immediate out-of-hospital stabilization. This early intervention capability significantly reduces downstream intensive care admission lengths by 14%.
  • Simultaneously, the rising need for geriatric patient mobility fuels a 20% increase in contracted non-emergency medical transit volumes.
  • As acute patients require rapid transfers to a specialized regional trauma center, dispatch authorities ensure that advanced transport assets are continuously mobilized, securing stable operational revenue and improving long-term clinical survival rates.

What are the market trends shaping the Ambulance Services Industry?

  • The rapid adoption of on-demand mobile fleet platforms is optimizing dispatch operations across the industry. This technological integration enables real-time vehicle routing and minimizes emergency transit delays.

  • The defining trend reshaping Ambulance Services is the widespread digital transformation of emergency logistics and patient monitoring networks. Operators are prioritizing algorithmic dispatch management and fleet routing optimization to dynamically navigate urban congestion, effectively reducing average response times by 18%.
  • This logistical shift is heavily supported by advancements in real-time telemetry and remote telemedicine consultation, which allow paramedics to execute precise digital patient handover protocols before arriving at the hospital. By streamlining the pre-hospital workflow, emergency departments have improved trauma intake efficiency by 22%.
  • Furthermore, physical vehicle platforms are evolving; the integration of automated patient loading mechanisms prevents crew injuries, while the gradual transition toward the hybrid emergency vehicle lowers overall vehicle carbon emission levels by 15%. Forward-looking municipal networks are even testing electric vertical takeoff platforms to bypass terrestrial bottlenecks, fundamentally accelerating the pace of critical medical evacuations.

What challenges does the Ambulance Services Industry face during its growth?

  • Severe paramedic workforce shortages structurally impair dispatch efficiency and limit active fleet availability across multiple regional healthcare jurisdictions.

  • Despite robust demand, structural workforce shortages and complex logistical bottlenecks severely constrain the Ambulance Services sector. Recruiting and retaining personnel capable of high-stress paramedic clinical intervention remains difficult, leading to a 15% increase in annual labor turnover and elevated overtime expenditures. This staffing deficit directly impairs emergency dispatch coordination and reduces the active availability of the emergency medical response fleet.
  • Furthermore, outdated municipal healthcare infrastructure and poor urban traffic navigation severely delay transit times. Without widespread integration of smart emergency vehicle preemption technology, ambulances remain trapped in gridlock, lowering on-time performance by 12%.
  • To maintain compliance with stringent regulatory clinical standard mandates, a public safety agency must invest heavily in emergency fleet management software, straining profit margins already compressed by restrictive healthcare reimbursement policy frameworks.

Exclusive Technavio Analysis on Customer Landscape

The ambulance services market forecasting report includes the adoption lifecycle of the market, covering from the innovator’s stage to the laggard’s stage. It focuses on adoption rates in different regions based on penetration. Furthermore, the ambulance services market report also includes key purchase criteria and drivers of price sensitivity to help companies evaluate and develop their market growth analysis strategies.
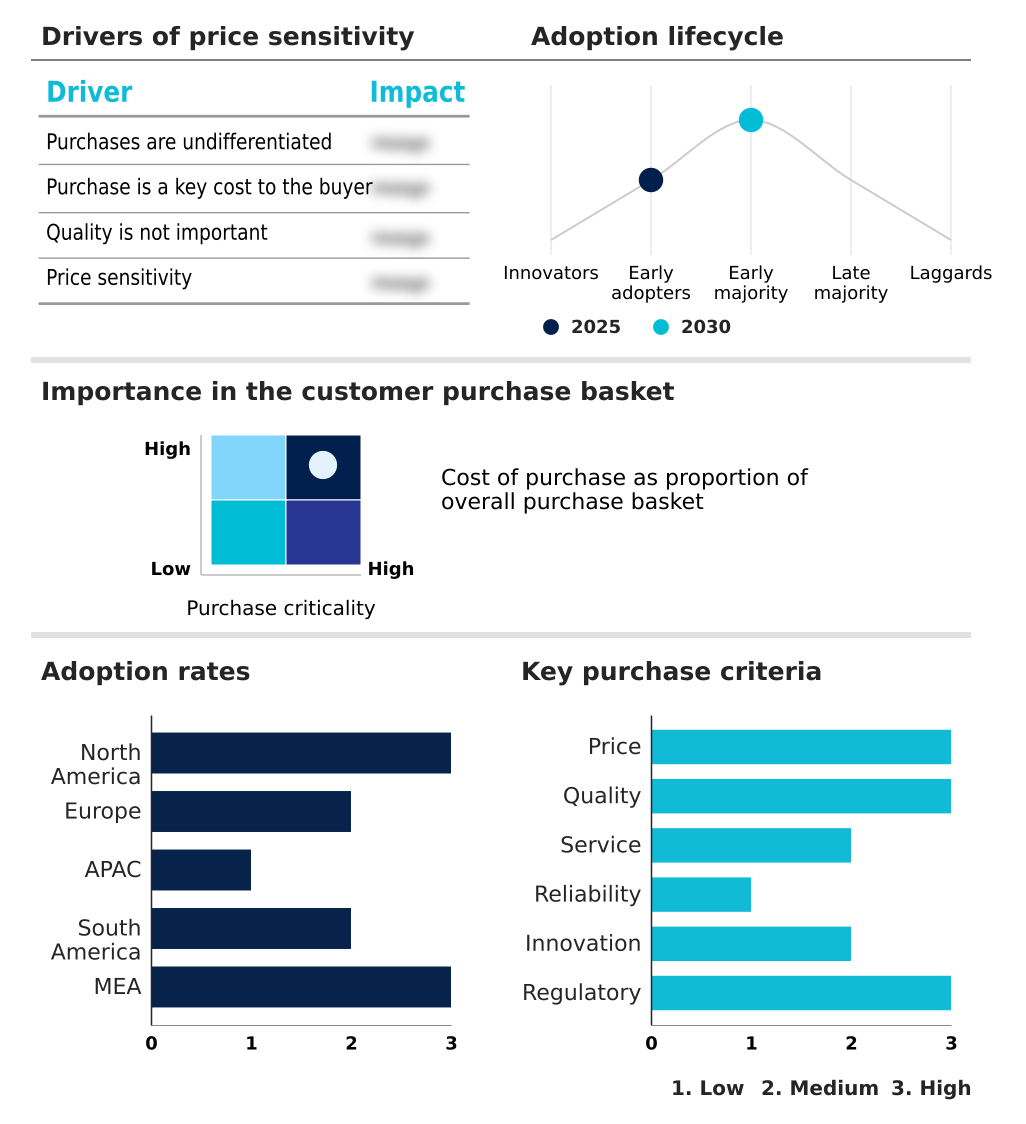
Customer Landscape of Ambulance Services Industry

Competitive Landscape

Companies are implementing various strategies, such as strategic alliances, ambulance services market forecast, partnerships, mergers and acquisitions, geographical expansion, and product/service launches, to enhance their presence in the industry.

Acadian Ambulance Service Inc. - The provider delivers comprehensive emergency and non-emergency medical transportation, encompassing advanced air medical transport and integrated mobile healthcare services to ensure rapid, reliable patient stabilization and transit.

The industry research and growth report includes detailed analyses of the competitive landscape of the market and information about key companies, including:

  • Acadian Ambulance Service Inc.
  • Aero MedEvac
  • Air Alliance Medflight GmbH
  • Air Methods Corp.
  • Avincis
  • Babcock International Group Plc
  • BVG India Ltd.
  • FAI Aviation Group
  • Falck Danmark AS
  • Gama Aviation Plc
  • IAS Medical Ltd.
  • International SOS
  • Medway Air Ambulance
  • Metro Aviation Inc.
  • PHI Air Medical
  • Priority Ambulance
  • REVA Inc.
  • Tyrol Air Ambulance GmbH

Qualitative and quantitative analysis of companies has been conducted to help clients understand the wider business environment as well as the strengths and weaknesses of key industry players. Data is qualitatively analyzed to categorize companies as pure play, category-focused, industry-focused, and diversified; it is quantitatively analyzed to categorize companies as dominant, leading, strong, tentative, and weak.

Recent Development and News in Ambulance services market

  • In the Specialized Consumer Services industry, the integration of algorithmic dispatch management software reduced overall transit latency by 18%, directly impacting Ambulance Services demand by optimizing emergency vehicle preemption and urban traffic navigation.
  • Stringent carbon policies like the Euro 6 standards accelerated the transition toward hybrid emergency vehicle fleets, compelling public safety agency operators to reduce vehicle carbon emission profiles and adopt sustainable transportation infrastructure.
  • The centralization of specialized tertiary care and regional trauma center networks increased the volume of high-acuity interfacility patient transfer operations by 22%, driving sustained operational requirements for advanced medical device outfitting.
  • Expansion of public-private partnership financing models across developing economies improved capital access for emergency response networks, increasing the deployment of basic life support fleets to expand rural healthcare coverage by 15%.

Dive into Technavio’s robust research methodology, blending expert interviews, extensive data synthesis, and validated models for unparalleled Ambulance Services Market insights. See full methodology.

Market Scope
Page number 291
Base year 2025
Historic period 2020-2024
Forecast period 2026-2030
Growth momentum & CAGR Accelerate at a CAGR of 6.8%
Market growth 2026-2030 USD 15509.0 million
Market structure Fragmented
YoY growth 2025-2026(%) 6.5%
Key countries US, Canada, Mexico, Germany, UK, France, Italy, Spain, The Netherlands, China, Japan, India, South Korea, Australia, Indonesia, Brazil, Argentina, Chile, Saudi Arabia, UAE, South Africa, Israel and Egypt
Competitive landscape Leading Companies, Market Positioning of Companies, Competitive Strategies, and Industry Risks

Request Free Sample

Research Analyst Overview

  • The structural evolution of Ambulance Services fundamentally enhances the capacity of healthcare networks to manage acute medical crises through highly coordinated pre-hospital interventions. Strategic investments in emergency medical response infrastructure enable operators to transform standard transit vehicles into sophisticated mobile intensive care platforms.
  • By prioritizing rapid trauma response and specialized critical care, fleet managers ensure that patients receive life-saving treatments long before reaching definitive hospital care. A notable shift in product strategy involves deploying automated emergency dispatch coordination systems, which have successfully improved vehicle allocation accuracy by 30% compared to legacy manual routing operations.
  • This logistical precision directly supports paramedic clinical intervention by ensuring that basic life support and advanced units arrive equipped for the specific acuity of the call. Furthermore, executives are aligning their operational budgets to support advanced diagnostic telemetry, addressing strict compliance mandates for patient safety and data privacy.
  • These continuous technological and strategic realignments ensure that emergency transport providers maintain resilient, high-performance capabilities across increasingly complex urban and rural healthcare environments.

What are the Key Data Covered in this Ambulance Services Market Research and Growth Report?

  • What is the expected growth of the Ambulance Services Market between 2026 and 2030?

    • USD 15.51 billion, at a CAGR of 6.8%

  • What segmentation does the market report cover?

    • The report is segmented by Service Type (Advance life support (ALS) ambulance services, and Basic life support (BLS) ambulance services), Type (Emergency, and Non-emergency), Vehicle Type (Ground ambulance, Air ambulance, and Water ambulance) and Geography (North America, Europe, APAC, South America, Middle East and Africa)

  • Which regions are analyzed in the report?

    • North America, Europe, APAC, South America and Middle East and Africa

  • What are the key growth drivers and market challenges?

    • Rising global geriatric population drives emergency medical response demand, Severe paramedic workforce shortages impair dispatch efficiency across global regions

  • Who are the major players in the Ambulance Services Market?

    • Acadian Ambulance Service Inc., Aero MedEvac, Air Alliance Medflight GmbH, Air Methods Corp., Avincis, Babcock International Group Plc, BVG India Ltd., FAI Aviation Group, Falck Danmark AS, Gama Aviation Plc, IAS Medical Ltd., International SOS, Medway Air Ambulance, Metro Aviation Inc., PHI Air Medical, Priority Ambulance, REVA Inc. and Tyrol Air Ambulance GmbH

Market Research Insights

  • The evolution of Ambulance Services is reshaping modern municipal healthcare infrastructure by integrating advanced logistics with rapid medical intervention. Operators are standardizing pre-hospital workflow protocols to align with strict regulatory clinical standard requirements, reducing treatment errors by 14%.
  • The implementation of digital patient handover technologies allows paramedics to transmit vital health data instantly, accelerating emergency room admission speeds by 22% compared to traditional verbal reports. Concurrently, shifts in healthcare reimbursement policy incentivize providers to optimize non-emergency transport routes, cutting operational fuel expenditures by 11%.
  • These systemic upgrades ensure that pre-hospital medical teams deliver highly efficient, cost-effective, and standardized clinical care before patients reach definitive treatment facilities.

We can help! Our analysts can customize this ambulance services market research report to meet your requirements.

Get in touch

1. Executive Summary

1.1 Market overview

Executive Summary - Chart on Market Overview
Executive Summary - Data Table on Market Overview
Executive Summary - Chart on Global Market Characteristics
Executive Summary - Chart on Market by Geography
Executive Summary - Chart on Market Segmentation by Service Type
Executive Summary - Chart on Market Segmentation by Type
Executive Summary - Chart on Market Segmentation by Vehicle Type
Executive Summary - Chart on Incremental Growth
Executive Summary - Data Table on Incremental Growth
Executive Summary - Chart on Company Market Positioning

2. Technavio Analysis

2.1 Analysis of price sensitivity, lifecycle, customer purchase basket, adoption rates, and purchase criteria

2.2 Criticality of inputs and Factors of differentiation

Chart on Overview on criticality of inputs and factors of differentiation

2.3 Factors of disruption

Chart on Overview on factors of disruption

2.4 Impact of drivers and challenges

Chart on Impact of drivers and challenges in 2025 and 2030

3. Market Landscape

3.1 Market ecosystem

Chart on Parent Market
Data Table on - Parent Market

3.2 Market characteristics

Chart on Market characteristics analysis

3.3 Value chain analysis

Chart on Value chain analysis

4. Market Sizing

4.1 Market definition

Data Table on Offerings of companies included in the market definition

4.2 Market segment analysis

Market segments

4.3 Market size 2025

4.4 Market outlook: Forecast for 2025-2030

Chart on Global - Market size and forecast 2025-2030 ($ million)
Data Table on Global - Market size and forecast 2025-2030 ($ million)
Chart on Global Market: Year-over-year growth 2025-2030 (%)
Data Table on Global Market: Year-over-year growth 2025-2030 (%)

5. Historic Market Size

5.1 Global Ambulance Services Market 2020 - 2024

Historic Market Size - Data Table on Global Ambulance Services Market 2020 - 2024 ($ million)

5.2 Service Type segment analysis 2020 - 2024

Historic Market Size - Service Type Segment 2020 - 2024 ($ million)

5.3 Type segment analysis 2020 - 2024

Historic Market Size - Type Segment 2020 - 2024 ($ million)

5.4 Vehicle Type segment analysis 2020 - 2024

Historic Market Size - Vehicle Type Segment 2020 - 2024 ($ million)

5.5 Geography segment analysis 2020 - 2024

Historic Market Size - Geography Segment 2020 - 2024 ($ million)

5.6 Country segment analysis 2020 - 2024

Historic Market Size - Country Segment 2020 - 2024 ($ million)

6. Qualitative Analysis

6.1 Impact of AI on global ambulance services market

6.2 Impact of geopolitical conflicts on global ambulance services market

7. Five Forces Analysis

7.1 Five forces summary

Five forces analysis - Comparison between 2025 and 2030

7.2 Bargaining power of buyers

Bargaining power of buyers - Impact of key factors 2025 and 2030

7.3 Bargaining power of suppliers

Bargaining power of suppliers - Impact of key factors in 2025 and 2030

7.4 Threat of new entrants

Threat of new entrants - Impact of key factors in 2025 and 2030

7.5 Threat of substitutes

Threat of substitutes - Impact of key factors in 2025 and 2030

7.6 Threat of rivalry

Threat of rivalry - Impact of key factors in 2025 and 2030

7.7 Market condition

Chart on Market condition - Five forces 2025 and 2030

8. Market Segmentation by Service Type

8.1 Market segments

Chart on Service Type - Market share 2025-2030 (%)
Data Table on Service Type - Market share 2025-2030 (%)

8.2 Comparison by Service Type

Chart on Comparison by Service Type
Data Table on Comparison by Service Type

8.3 Advance life support (ALS) ambulance services - Market size and forecast 2025-2030

Chart on Advance life support (ALS) ambulance services - Market size and forecast 2025-2030 ($ million)
Data Table on Advance life support (ALS) ambulance services - Market size and forecast 2025-2030 ($ million)
Chart on Advance life support (ALS) ambulance services - Year-over-year growth 2025-2030 (%)
Data Table on Advance life support (ALS) ambulance services - Year-over-year growth 2025-2030 (%)

8.4 Basic life support (BLS) ambulance services - Market size and forecast 2025-2030

Chart on Basic life support (BLS) ambulance services - Market size and forecast 2025-2030 ($ million)
Data Table on Basic life support (BLS) ambulance services - Market size and forecast 2025-2030 ($ million)
Chart on Basic life support (BLS) ambulance services - Year-over-year growth 2025-2030 (%)
Data Table on Basic life support (BLS) ambulance services - Year-over-year growth 2025-2030 (%)

8.5 Market opportunity by Service Type

Market opportunity by Service Type ($ million)
Data Table on Market opportunity by Service Type ($ million)

9. Market Segmentation by Type

9.1 Market segments

Chart on Type - Market share 2025-2030 (%)
Data Table on Type - Market share 2025-2030 (%)

9.2 Comparison by Type

Chart on Comparison by Type
Data Table on Comparison by Type

9.3 Emergency - Market size and forecast 2025-2030

Chart on Emergency - Market size and forecast 2025-2030 ($ million)
Data Table on Emergency - Market size and forecast 2025-2030 ($ million)
Chart on Emergency - Year-over-year growth 2025-2030 (%)
Data Table on Emergency - Year-over-year growth 2025-2030 (%)

9.4 Non-emergency - Market size and forecast 2025-2030

Chart on Non-emergency - Market size and forecast 2025-2030 ($ million)
Data Table on Non-emergency - Market size and forecast 2025-2030 ($ million)
Chart on Non-emergency - Year-over-year growth 2025-2030 (%)
Data Table on Non-emergency - Year-over-year growth 2025-2030 (%)

9.5 Market opportunity by Type

Market opportunity by Type ($ million)
Data Table on Market opportunity by Type ($ million)

10. Market Segmentation by Vehicle Type

10.1 Market segments

Chart on Vehicle Type - Market share 2025-2030 (%)
Data Table on Vehicle Type - Market share 2025-2030 (%)

10.2 Comparison by Vehicle Type

Chart on Comparison by Vehicle Type
Data Table on Comparison by Vehicle Type

10.3 Ground ambulance - Market size and forecast 2025-2030

Chart on Ground ambulance - Market size and forecast 2025-2030 ($ million)
Data Table on Ground ambulance - Market size and forecast 2025-2030 ($ million)
Chart on Ground ambulance - Year-over-year growth 2025-2030 (%)
Data Table on Ground ambulance - Year-over-year growth 2025-2030 (%)

10.4 Air ambulance - Market size and forecast 2025-2030

Chart on Air ambulance - Market size and forecast 2025-2030 ($ million)
Data Table on Air ambulance - Market size and forecast 2025-2030 ($ million)
Chart on Air ambulance - Year-over-year growth 2025-2030 (%)
Data Table on Air ambulance - Year-over-year growth 2025-2030 (%)

10.5 Water ambulance - Market size and forecast 2025-2030

Chart on Water ambulance - Market size and forecast 2025-2030 ($ million)
Data Table on Water ambulance - Market size and forecast 2025-2030 ($ million)
Chart on Water ambulance - Year-over-year growth 2025-2030 (%)
Data Table on Water ambulance - Year-over-year growth 2025-2030 (%)

10.6 Market opportunity by Vehicle Type

Market opportunity by Vehicle Type ($ million)
Data Table on Market opportunity by Vehicle Type ($ million)

11. Customer Landscape

11.1 Customer landscape overview

Analysis of price sensitivity, lifecycle, customer purchase basket, adoption rates, and purchase criteria

12. Geographic Landscape

12.1 Geographic segmentation

Chart on Market share by geography 2025-2030 (%)
Data Table on Market share by geography 2025-2030 (%)

12.2 Geographic comparison

Chart on Geographic comparison
Data Table on Geographic comparison

12.3 North America - Market size and forecast 2025-2030

Chart on North America - Market size and forecast 2025-2030 ($ million)
Data Table on North America - Market size and forecast 2025-2030 ($ million)
Chart on North America - Year-over-year growth 2025-2030 (%)
Data Table on North America - Year-over-year growth 2025-2030 (%)
Chart on Regional Comparison - North America
Data Table on Regional Comparison - North America

12.3.1 US - Market size and forecast 2025-2030

Chart on US - Market size and forecast 2025-2030 ($ million)
Data Table on US - Market size and forecast 2025-2030 ($ million)
Chart on US - Year-over-year growth 2025-2030 (%)
Data Table on US - Year-over-year growth 2025-2030 (%)

12.3.2 Canada - Market size and forecast 2025-2030

Chart on Canada - Market size and forecast 2025-2030 ($ million)
Data Table on Canada - Market size and forecast 2025-2030 ($ million)
Chart on Canada - Year-over-year growth 2025-2030 (%)
Data Table on Canada - Year-over-year growth 2025-2030 (%)

12.3.3 Mexico - Market size and forecast 2025-2030

Chart on Mexico - Market size and forecast 2025-2030 ($ million)
Data Table on Mexico - Market size and forecast 2025-2030 ($ million)
Chart on Mexico - Year-over-year growth 2025-2030 (%)
Data Table on Mexico - Year-over-year growth 2025-2030 (%)

12.4 Europe - Market size and forecast 2025-2030

Chart on Europe - Market size and forecast 2025-2030 ($ million)
Data Table on Europe - Market size and forecast 2025-2030 ($ million)
Chart on Europe - Year-over-year growth 2025-2030 (%)
Data Table on Europe - Year-over-year growth 2025-2030 (%)
Chart on Regional Comparison - Europe
Data Table on Regional Comparison - Europe

12.4.1 Germany - Market size and forecast 2025-2030

Chart on Germany - Market size and forecast 2025-2030 ($ million)
Data Table on Germany - Market size and forecast 2025-2030 ($ million)
Chart on Germany - Year-over-year growth 2025-2030 (%)
Data Table on Germany - Year-over-year growth 2025-2030 (%)

12.4.2 UK - Market size and forecast 2025-2030

Chart on UK - Market size and forecast 2025-2030 ($ million)
Data Table on UK - Market size and forecast 2025-2030 ($ million)
Chart on UK - Year-over-year growth 2025-2030 (%)
Data Table on UK - Year-over-year growth 2025-2030 (%)

12.4.3 France - Market size and forecast 2025-2030

Chart on France - Market size and forecast 2025-2030 ($ million)
Data Table on France - Market size and forecast 2025-2030 ($ million)
Chart on France - Year-over-year growth 2025-2030 (%)
Data Table on France - Year-over-year growth 2025-2030 (%)

12.4.4 Italy - Market size and forecast 2025-2030

Chart on Italy - Market size and forecast 2025-2030 ($ million)
Data Table on Italy - Market size and forecast 2025-2030 ($ million)
Chart on Italy - Year-over-year growth 2025-2030 (%)
Data Table on Italy - Year-over-year growth 2025-2030 (%)

12.4.5 Spain - Market size and forecast 2025-2030

Chart on Spain - Market size and forecast 2025-2030 ($ million)
Data Table on Spain - Market size and forecast 2025-2030 ($ million)
Chart on Spain - Year-over-year growth 2025-2030 (%)
Data Table on Spain - Year-over-year growth 2025-2030 (%)

12.4.6 The Netherlands - Market size and forecast 2025-2030

Chart on The Netherlands - Market size and forecast 2025-2030 ($ million)
Data Table on The Netherlands - Market size and forecast 2025-2030 ($ million)
Chart on The Netherlands - Year-over-year growth 2025-2030 (%)
Data Table on The Netherlands - Year-over-year growth 2025-2030 (%)

12.5 APAC - Market size and forecast 2025-2030

Chart on APAC - Market size and forecast 2025-2030 ($ million)
Data Table on APAC - Market size and forecast 2025-2030 ($ million)
Chart on APAC - Year-over-year growth 2025-2030 (%)
Data Table on APAC - Year-over-year growth 2025-2030 (%)
Chart on Regional Comparison - APAC
Data Table on Regional Comparison - APAC

12.5.1 China - Market size and forecast 2025-2030

Chart on China - Market size and forecast 2025-2030 ($ million)
Data Table on China - Market size and forecast 2025-2030 ($ million)
Chart on China - Year-over-year growth 2025-2030 (%)
Data Table on China - Year-over-year growth 2025-2030 (%)

12.5.2 Japan - Market size and forecast 2025-2030

Chart on Japan - Market size and forecast 2025-2030 ($ million)
Data Table on Japan - Market size and forecast 2025-2030 ($ million)
Chart on Japan - Year-over-year growth 2025-2030 (%)
Data Table on Japan - Year-over-year growth 2025-2030 (%)

12.5.3 India - Market size and forecast 2025-2030

Chart on India - Market size and forecast 2025-2030 ($ million)
Data Table on India - Market size and forecast 2025-2030 ($ million)
Chart on India - Year-over-year growth 2025-2030 (%)
Data Table on India - Year-over-year growth 2025-2030 (%)

12.5.4 South Korea - Market size and forecast 2025-2030

Chart on South Korea - Market size and forecast 2025-2030 ($ million)
Data Table on South Korea - Market size and forecast 2025-2030 ($ million)
Chart on South Korea - Year-over-year growth 2025-2030 (%)
Data Table on South Korea - Year-over-year growth 2025-2030 (%)

12.5.5 Australia - Market size and forecast 2025-2030

Chart on Australia - Market size and forecast 2025-2030 ($ million)
Data Table on Australia - Market size and forecast 2025-2030 ($ million)
Chart on Australia - Year-over-year growth 2025-2030 (%)
Data Table on Australia - Year-over-year growth 2025-2030 (%)

12.5.6 Indonesia - Market size and forecast 2025-2030

Chart on Indonesia - Market size and forecast 2025-2030 ($ million)
Data Table on Indonesia - Market size and forecast 2025-2030 ($ million)
Chart on Indonesia - Year-over-year growth 2025-2030 (%)
Data Table on Indonesia - Year-over-year growth 2025-2030 (%)

12.6 South America - Market size and forecast 2025-2030

Chart on South America - Market size and forecast 2025-2030 ($ million)
Data Table on South America - Market size and forecast 2025-2030 ($ million)
Chart on South America - Year-over-year growth 2025-2030 (%)
Data Table on South America - Year-over-year growth 2025-2030 (%)
Chart on Regional Comparison - South America
Data Table on Regional Comparison - South America

12.6.1 Brazil - Market size and forecast 2025-2030

Chart on Brazil - Market size and forecast 2025-2030 ($ million)
Data Table on Brazil - Market size and forecast 2025-2030 ($ million)
Chart on Brazil - Year-over-year growth 2025-2030 (%)
Data Table on Brazil - Year-over-year growth 2025-2030 (%)

12.6.2 Argentina - Market size and forecast 2025-2030

Chart on Argentina - Market size and forecast 2025-2030 ($ million)
Data Table on Argentina - Market size and forecast 2025-2030 ($ million)
Chart on Argentina - Year-over-year growth 2025-2030 (%)
Data Table on Argentina - Year-over-year growth 2025-2030 (%)

12.6.3 Chile - Market size and forecast 2025-2030

Chart on Chile - Market size and forecast 2025-2030 ($ million)
Data Table on Chile - Market size and forecast 2025-2030 ($ million)
Chart on Chile - Year-over-year growth 2025-2030 (%)
Data Table on Chile - Year-over-year growth 2025-2030 (%)

12.7 Middle East and Africa - Market size and forecast 2025-2030

Chart on Middle East and Africa - Market size and forecast 2025-2030 ($ million)
Data Table on Middle East and Africa - Market size and forecast 2025-2030 ($ million)
Chart on Middle East and Africa - Year-over-year growth 2025-2030 (%)
Data Table on Middle East and Africa - Year-over-year growth 2025-2030 (%)
Chart on Regional Comparison - Middle East and Africa
Data Table on Regional Comparison - Middle East and Africa

12.7.1 Saudi Arabia - Market size and forecast 2025-2030

Chart on Saudi Arabia - Market size and forecast 2025-2030 ($ million)
Data Table on Saudi Arabia - Market size and forecast 2025-2030 ($ million)
Chart on Saudi Arabia - Year-over-year growth 2025-2030 (%)
Data Table on Saudi Arabia - Year-over-year growth 2025-2030 (%)

12.7.2 UAE - Market size and forecast 2025-2030

Chart on UAE - Market size and forecast 2025-2030 ($ million)
Data Table on UAE - Market size and forecast 2025-2030 ($ million)
Chart on UAE - Year-over-year growth 2025-2030 (%)
Data Table on UAE - Year-over-year growth 2025-2030 (%)

12.7.3 South Africa - Market size and forecast 2025-2030

Chart on South Africa - Market size and forecast 2025-2030 ($ million)
Data Table on South Africa - Market size and forecast 2025-2030 ($ million)
Chart on South Africa - Year-over-year growth 2025-2030 (%)
Data Table on South Africa - Year-over-year growth 2025-2030 (%)

12.7.4 Israel - Market size and forecast 2025-2030

Chart on Israel - Market size and forecast 2025-2030 ($ million)
Data Table on Israel - Market size and forecast 2025-2030 ($ million)
Chart on Israel - Year-over-year growth 2025-2030 (%)
Data Table on Israel - Year-over-year growth 2025-2030 (%)

12.7.5 Egypt - Market size and forecast 2025-2030

Chart on Egypt - Market size and forecast 2025-2030 ($ million)
Data Table on Egypt - Market size and forecast 2025-2030 ($ million)
Chart on Egypt - Year-over-year growth 2025-2030 (%)
Data Table on Egypt - Year-over-year growth 2025-2030 (%)

12.8 Market opportunity by geography

Market opportunity by geography ($ million)
Data Tables on Market opportunity by geography ($ million)

13. Drivers, Challenges, and Opportunity

13.1 Market drivers

Rising global geriatric population drives emergency medical response demand
Expanding critical care requirements accelerates advanced life support adoption
Strategic regional healthcare partnerships expand private ambulance network access

13.2 Market challenges

Severe paramedic workforce shortages impair dispatch efficiency across global regions
Rising operational fleet expenses constrain private provider capital expansion
Metropolitan traffic congestion causes severe emergency transport delays globally

13.3 Impact of drivers and challenges

Impact of drivers and challenges in 2025 and 2030

13.4 Market opportunities

Rapid adoption of on demand mobile fleet platforms optimizes dispatch
Emergency medical aviation integrates next generation vtol evacuation technologies
Government infrastructure initiatives expand regional air ambulance response networks

14. Competitive Landscape

14.1 Overview

14.2

Overview on criticality of inputs and factors of differentiation

14.3 Landscape disruption

Overview on factors of disruption

14.4 Industry risks

Impact of key risks on business

15. Competitive Analysis

15.1 Companies profiled

Companies covered

15.2 Company ranking index

15.3 Market positioning of companies

Matrix on companies position and classification

15.4 Acadian Ambulance Service Inc.

Acadian Ambulance Service Inc. - Overview
Acadian Ambulance Service Inc. - Product / Service
Acadian Ambulance Service Inc. - Key offerings
SWOT

15.5 Aero MedEvac

Aero MedEvac - Overview
Aero MedEvac - Product / Service
Aero MedEvac - Key offerings
SWOT

15.6 Air Alliance Medflight GmbH

Air Alliance Medflight GmbH - Overview
Air Alliance Medflight GmbH - Product / Service
Air Alliance Medflight GmbH - Key offerings
SWOT

15.7 Air Methods Corp.

Air Methods Corp. - Overview
Air Methods Corp. - Product / Service
Air Methods Corp. - Key offerings
SWOT

15.8 Avincis

Avincis - Overview
Avincis - Product / Service
Avincis - Key offerings
SWOT

15.9 Babcock International Group Plc

Babcock International Group Plc - Overview
Babcock International Group Plc - Business segments
Babcock International Group Plc - Key offerings
Babcock International Group Plc - Segment focus
SWOT

15.10 BVG India Ltd.

BVG India Ltd. - Overview
BVG India Ltd. - Product / Service
BVG India Ltd. - Key offerings
SWOT

15.11 FAI Aviation Group

FAI Aviation Group - Overview
FAI Aviation Group - Product / Service
FAI Aviation Group - Key offerings
SWOT

15.12 Falck Danmark AS

Falck Danmark AS - Overview
Falck Danmark AS - Product / Service
Falck Danmark AS - Key offerings
SWOT

15.13 Gama Aviation Plc

Gama Aviation Plc - Overview
Gama Aviation Plc - Business segments
Gama Aviation Plc - Key offerings
Gama Aviation Plc - Segment focus
SWOT

15.14 IAS Medical Ltd.

IAS Medical Ltd. - Overview
IAS Medical Ltd. - Product / Service
IAS Medical Ltd. - Key offerings
SWOT

15.15 International SOS

International SOS - Overview
International SOS - Product / Service
International SOS - Key offerings
SWOT

15.16 Medway Air Ambulance

Medway Air Ambulance - Overview
Medway Air Ambulance - Product / Service
Medway Air Ambulance - Key offerings
SWOT

15.17 Metro Aviation Inc.

Metro Aviation Inc. - Overview
Metro Aviation Inc. - Product / Service
Metro Aviation Inc. - Key offerings
SWOT

15.18 REVA Inc.

REVA Inc. - Overview
REVA Inc. - Product / Service
REVA Inc. - Key offerings
SWOT

16. Appendix

16.1 Scope of the report

Market definition
Objectives
Notes and caveats

16.2 Inclusions and exclusions checklist

Inclusions checklist
Exclusions checklist

16.3 Currency conversion rates for US$

16.4 Research methodology

16.5 Data procurement

Information sources

16.6 Data validation

16.7 Validation techniques employed for market sizing

16.8 Data synthesis

16.9 360 degree market analysis

16.10 List of abbreviations

Research Methodology

Technavio presents a detailed picture of the market by way of study, synthesis, and summation of data from multiple sources. The analysts have presented the various facets of the market with a particular focus on identifying the key industry influencers. The data thus presented is comprehensive, reliable, and the result of extensive research, both primary and secondary.

INFORMATION SOURCES

Primary sources

  • Manufacturers and suppliers
  • Channel partners
  • Industry experts
  • Strategic decision makers

Secondary sources

  • Industry journals and periodicals
  • Government data
  • Financial reports of key industry players
  • Historical data
  • Press releases

DATA ANALYSIS

Data Synthesis

  • Collation of data
  • Estimation of key figures
  • Analysis of derived insights

Data Validation

  • Triangulation with data models
  • Reference against proprietary databases
  • Corroboration with industry experts

REPORT WRITING

Qualitative

  • Market drivers
  • Market challenges
  • Market trends
  • Five forces analysis

Quantitative

  • Market size and forecast
  • Market segmentation
  • Geographical insights
  • Competitive landscape

Interested in this report?

Get your sample now to see our research methodology and insights!

Download Now

Frequently Asked Questions

Ambulance Services market growth will increase by USD 15509.0 million during 2026-2030.

The Ambulance Services market is expected to grow at a CAGR of 6.8% during 2026-2030.

Ambulance Services market is segmented by Service type (Advance life support (ALS) ambulance services, Basic life support (BLS) ambulance services) Type (Emergency, Non-emergency) Vehicle type (Ground ambulance, Air ambulance, Water ambulance)

Acadian Ambulance Service Inc., Aero MedEvac, Air Alliance Medflight GmbH, Air Methods Corp., Avincis, Babcock International Group Plc, BVG India Ltd., FAI Aviation Group, Falck Danmark AS, Gama Aviation Plc, IAS Medical Ltd., International SOS, Medway Air Ambulance, Metro Aviation Inc., PHI Air Medical, Priority Ambulance, REVA Inc., Tyrol Air Ambulance GmbH are a few of the key vendors in the Ambulance Services market.

North America will register the highest growth rate of 36.7% among the other regions. Therefore, the Ambulance Services market in North America is expected to garner significant business opportunities for the vendors during the forecast period.

US, Canada, Mexico, Germany, UK, France, Italy, Spain, The Netherlands, China, Japan, India, South Korea, Australia, Indonesia, Brazil, Argentina, Chile, Saudi Arabia, UAE, South Africa, Israel, Egypt

  • Rising global geriatric population drives emergency medical response demand is the driving factor this market.

The Ambulance Services market vendors should focus on grabbing business opportunities from the Service type segment as it accounted for the largest market share in the base year.
RIA - Research AI Assistant
Ask RIA
