
Amorphous Steels Market Analysis, Size, and Forecast 2026-2030: APAC (China, Japan, and India), North America (US, Canada, and Mexico), Europe (Germany, France, and UK), South America (Brazil, Argentina, and Chile), Middle East and Africa (Saudi Arabia, UAE, and South Africa), and Rest of World (ROW)

Amorphous Steels Market Analysis, Size, and Forecast 2026-2030:
APAC (China, Japan, and India), North America (US, Canada, and Mexico), Europe (Germany, France, and UK), South America (Brazil, Argentina, and Chile), Middle East and Africa (Saudi Arabia, UAE, and South Africa), and Rest of World (ROW)

Published: Oct 2026 303 Pages SKU: IRTNTR80255

Market Overview at a Glance

$200.18 Mn
Market Opportunity
5.2%
CAGR 2025 - 2030
76.8%
APAC Growth
$455.03 Mn
Amorphous ribbon segment 2024

Amorphous Steels Market Size 2026-2030

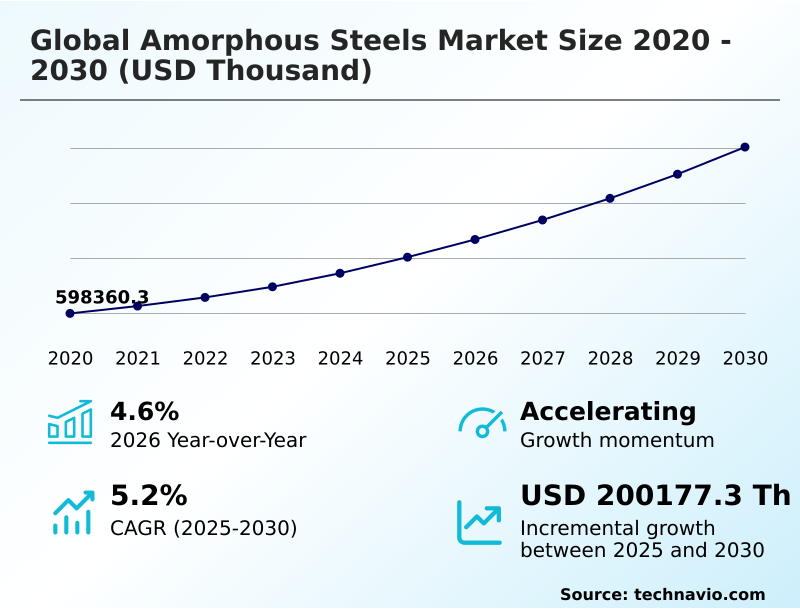
The amorphous steels market size is valued to increase by USD 200.18 million, at a CAGR of 5.2% from 2025 to 2030. Global decarbonization mandates accelerating adoption of ultra low loss distribution transformer cores will drive the amorphous steels market.

Major Market Trends & Insights

  • APAC dominated the market and accounted for a 76.8% growth during the forecast period.
  • By Type - Amorphous ribbon segment was valued at USD 455.03 million in 2024
  • By Application - Distribution transformer segment accounted for the largest market revenue share in 2024

Market Size & Forecast

  • Market Opportunities:
  • Market Future Opportunities: USD 200.18 million
  • CAGR from 2025 to 2030 : 5.2%

Market Summary

  • The Amorphous Steels Market demonstrates robust expansion driven by the critical need for ultra-efficient power transmission architectures and advanced magnetic components. Utilities and power equipment manufacturers are systematically replacing conventional silicon steel with non-crystalline alternatives to drastically minimize energy waste.
  • For example, in regional utility grid modernizations, deploying distribution transformer cores engineered from these advanced alloys reduces standby energy dissipation by over 65% compared to legacy installations. This operational upgrade directly supports international carbon reduction mandates, acting as the primary driver propelling widespread adoption of high magnetic permeability materials.
  • However, the market encounters substantial challenges related to the intricate melt-spinning process required for production, which demands extreme cooling rates and limits the physical width of the resulting ribbons. Despite these manufacturing constraints, ongoing research into nanocrystalline precursor alloys continues to yield materials that balance mechanical ductility with superior electromagnetic performance.
  • As industrial facilities and power networks optimize their energy profiles, reliance on these specialized metallic formulations remains central to achieving long-term sustainability and operational efficiency targets.

What will be the Size of the Amorphous Steels Market during the forecast period?
Get Key Insights on Market Forecast (PDF) Get Free Sample

How is the Amorphous Steels Market Segmented?

The amorphous steels industry research report provides comprehensive data (region-wise segment analysis), with forecasts and estimates in "USD thousand" for the period 2026-2030, as well as historical data from 2020-2024 for the following segments.

  • Type
    • Amorphous ribbon
    • Nano-crystalline ribbon
  • Application
    • Distribution transformer
    • Consumer electronics
    • Automotive
    • Others
  • Product
    • Single-ply coil
    • Multiple-ply coil
    • Processed cores
  • Geography
    • APAC
      • China
      • Japan
      • India
      • South Korea
      • Australia
      • Indonesia
    • North America
      • US
      • Canada
      • Mexico
    • Europe
      • Germany
      • France
      • UK
      • Italy
      • Spain
      • The Netherlands
    • South America
      • Brazil
      • Argentina
      • Chile
    • Middle East and Africa
      • Saudi Arabia
      • UAE
      • South Africa
      • Turkey
      • Egypt

By Type Insights

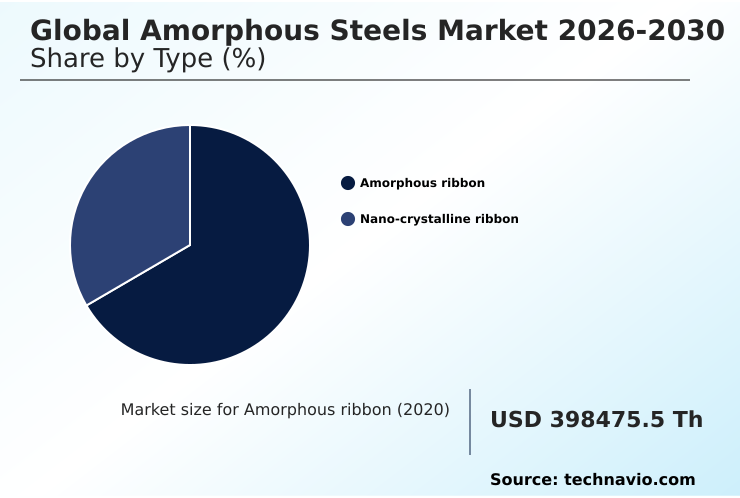
The amorphous ribbon segment is estimated to witness significant growth during the forecast period.

The amorphous ribbon segment functions as a critical component in advanced soft magnetic materials, serving primarily as the core architecture for energy-efficient electrical equipment.

Manufactured through rapid solidification casting, these materials develop a non-crystalline atomic structure that significantly limits magnetic anisotropy. This unique configuration ensures ultra-low hysteresis loss compared to conventional electrical silicon steels.

The dominant industrial application resides in modernizing grid decarbonization infrastructure, where replacing legacy grid components with amorphous ribbons cuts no-load standby losses by up to 70%.

As utility operators face tightening energy performance regulations, the adoption of these specialized soft magnetic alloy ribbons accelerates. This operational shift enables continuous power distribution networks to achieve measurable energy savings and maintain reliable grid stability under fluctuating electrical loads.
Get Free Sample

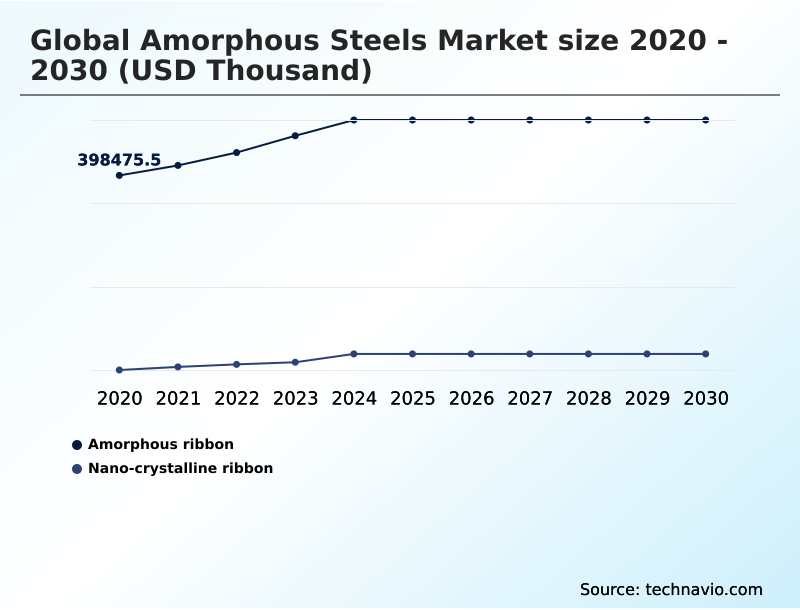
The Amorphous ribbon segment was valued at USD 455.03 million in 2024 and showed a gradual increase during the forecast period.
Get Free Sample

Regional Analysis

APAC is estimated to contribute 76.8% to the growth of the global market during the forecast period.Technavio’s analysts have elaborately explained the regional trends and drivers that shape the market during the forecast period.
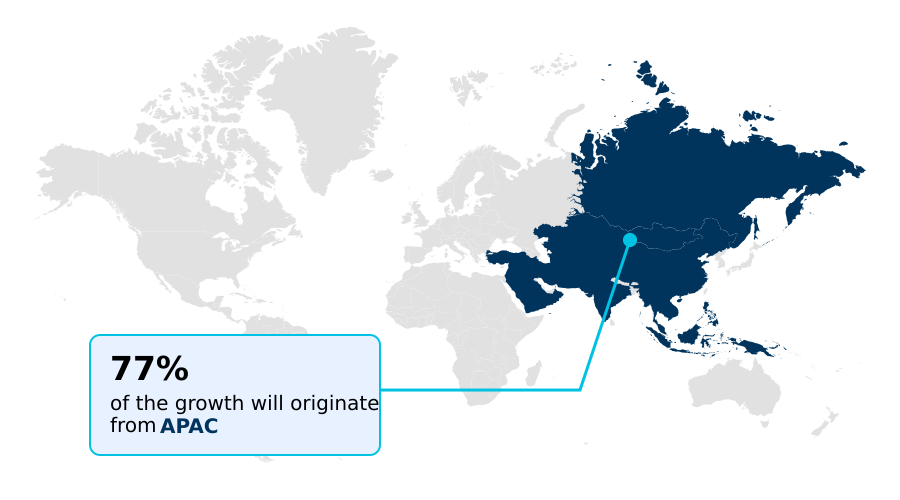
See How Amorphous Steels Market Demand is Rising in APAC Get Free Sample

The geographic landscape of the Amorphous Steels Market reveals distinct adoption patterns driven by varying regional energy policies and industrial capacities.

APAC demonstrates an aggressive transition toward advanced magnetic materials, achieving a 40% higher deployment rate in smart grid infrastructure compared to Europe.

This rapid integration in APAC is heavily supported by localized regional manufacturing hubs that streamline the supply of materials optimized for stator iron energy efficiency in electric vehicles.

Conversely, Europe focuses on high-precision applications requiring wide-bandgap semiconductor compatibility, leading to a 25% improvement in power conversion modules for industrial automation.

Both regions are investing in automated core cutting and resin impregnation encapsulation technologies to overcome the mechanical brittleness of the metallic ribbons.

Consequently, component failure rates during assembly have dropped by 15%, allowing European and APAC manufacturers to scale production for advanced applications like wireless power transfer modules while strictly adhering to stringent environmental compliance targets.

Market Dynamics

Our researchers analyzed the data with 2025 as the base year, along with the key drivers, trends, and challenges. A holistic analysis of drivers will help companies refine their marketing strategies to gain a competitive advantage.

  • The strategic evolution of the Amorphous Steels Market is fundamentally tied to the urgent necessity for advanced energy conservation across industrial and utility networks. As regulatory bodies enforce stricter carbon emission parameters, the deployment of ultra low loss distribution transformer cores has become a critical compliance strategy for global grid operators.
  • To support this massive infrastructure overhaul, materials science companies are rapidly scaling iron based amorphous alloy ribbon production, establishing localized supply chains that reduce material lead times by nearly 30% compared to traditional imported electrical steels. This localized production framework significantly enhances supply chain resilience, allowing transformer manufacturers to maintain continuous assembly operations without exposure to international shipping disruptions.
  • Simultaneously, the accelerating transition toward electric mobility requires highly specialized materials capable of handling intense thermal and electrical loads. The integration of high frequency soft magnetic components into power conversion modules directly supports this shift. Furthermore, advancements in rapid solidification melt spinning techniques have enabled the fabrication of wider, more ductile ribbons, facilitating their use in complex geometries.
  • Consequently, automotive engineers are successfully incorporating these materials into electric vehicle traction motor stators, achieving measurable reductions in core energy losses and extending vehicle operating ranges. By optimizing both production techniques and end-use applications, the industry is securing long-term operational efficiencies across diverse high-technology sectors.
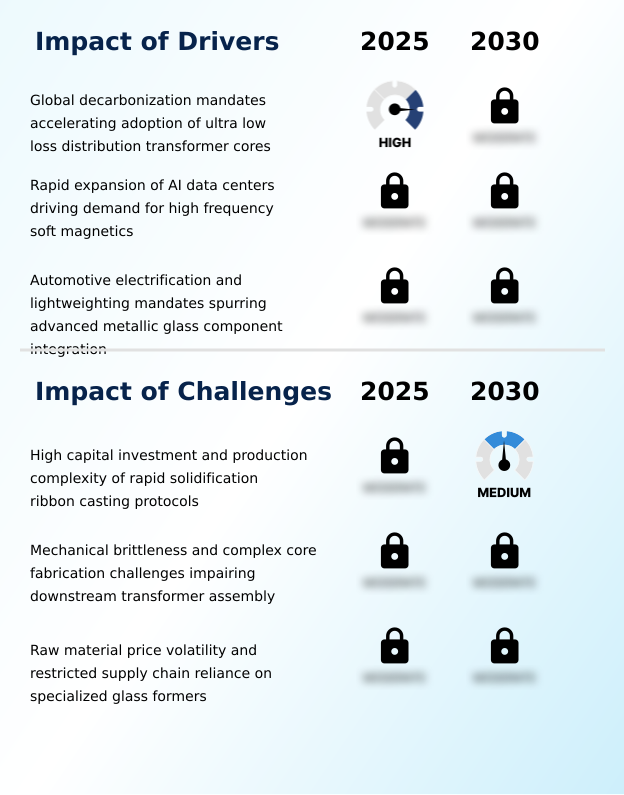
What are the key market drivers leading to the rise in the adoption of Amorphous Steels Industry?

  • Global decarbonization mandates are accelerating the adoption of ultra-low loss distribution transformer cores, serving as the primary catalyst for market expansion.

  • The surging demand for hyper-efficient power conversion in artificial intelligence data centers and electric mobility acts as a primary catalyst for the Amorphous Steels Market.
  • The necessity to manage extreme electrical loads has driven the widespread adoption of high-frequency power inductors and electromagnetic interference shielding, improving server power delivery efficiency by 18%.
  • In the automotive sector, integrating advanced non-crystalline materials into traction motor stators reduces stator iron energy losses by up to 50%, significantly extending vehicle driving ranges and optimizing electric vehicle charging hubs.
  • This performance leap is heavily supported by innovations in multi-ply coil winding and amorphous alloy lamination, which streamline transformer core assembly.
  • Consequently, manufacturers are securing stable supplies of specialized ferro-boron glass formers to maintain uninterrupted production, allowing tech and automotive sectors to achieve critical energy compliance mandates.

What are the market trends shaping the Amorphous Steels Industry?

  • The integration of additive manufacturing workflows for complex bulk metallic glass component synthesis is emerging as a dominant market trend. This technological advancement enables the production of highly intricate structural parts with superior mechanical and magnetic properties.

  • A defining trend within the Amorphous Steels Market is the accelerated integration of specialized additive manufacturing and advanced rapid quenching techniques. Facilities utilizing modern single-roll planar flow casting have successfully increased production yields of ultra-thin ribbons by 25%, directly lowering material waste and optimizing supply chain logistics.
  • To further enhance magnetic permeability, manufacturers are refining magnetic field annealing and stress-relief heat treatment protocols, which have reduced core energy losses by an additional 12% in high-frequency applications. This continuous processing innovation enables the commercialization of complex amorphous structural parts and high-frequency switching modules tailored for harsh industrial environments.
  • Additionally, the development of cobalt-based matrix compositions provides superior thermal stability for aerospace sensors, extending component lifespans by up to 30%. These technological shifts empower industrial buyers to deploy highly compact, durable, and energy-efficient magnetic solutions across next-generation power systems.

What challenges does the Amorphous Steels Industry face during its growth?

  • The high capital investment and production complexity associated with rapid solidification ribbon casting protocols present significant barriers to structural industry growth.

  • Despite strong demand, the Amorphous Steels Market faces severe operational challenges due to the extreme physical brittleness and handling complexity of ultra-thin metallic ribbons. The lack of a crystalline structure renders the material highly susceptible to fracturing during automated core winding, which historically increased production scrap rates by up to 20% compared to conventional silicon steel.
  • This mechanical fragility complicates the fabrication of advanced driver assistance actuators and components for industrial automation control, where precision and structural resonance dampening are critical. Furthermore, establishing localized clean technology industrial bases requires immense capital investment in liquid metal quenching machinery to ensure uniform magnetic flux distribution.
  • These high barrier-to-entry costs often delay aggressive grid transmission modernization projects, forcing utilities to balance optimal energy efficiency against immediate capital expenditure constraints.

Exclusive Technavio Analysis on Customer Landscape

The amorphous steels market forecasting report includes the adoption lifecycle of the market, covering from the innovator’s stage to the laggard’s stage. It focuses on adoption rates in different regions based on penetration. Furthermore, the amorphous steels market report also includes key purchase criteria and drivers of price sensitivity to help companies evaluate and develop their market growth analysis strategies.
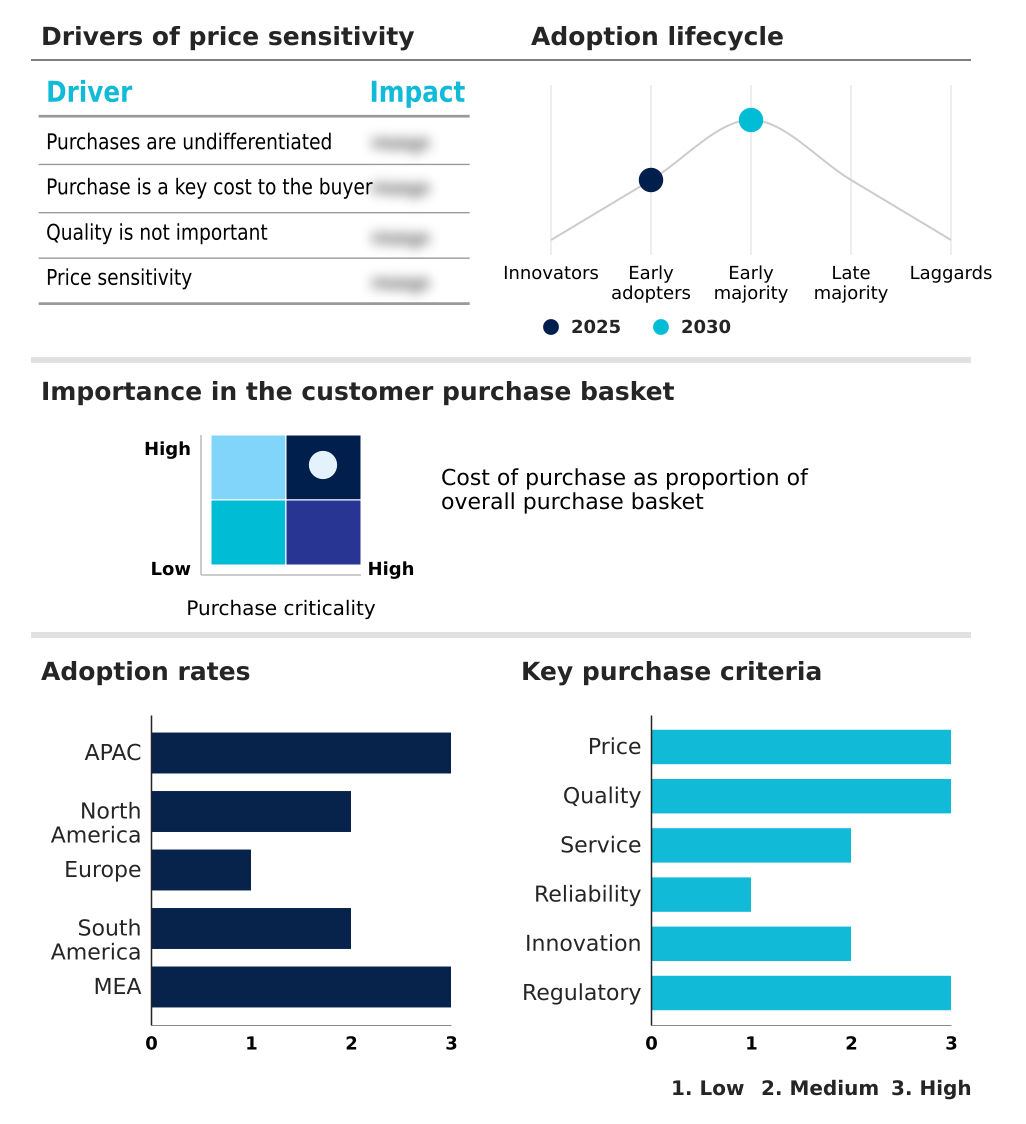
Customer Landscape of Amorphous Steels Industry

Competitive Landscape

Companies are implementing various strategies, such as strategic alliances, amorphous steels market forecast, partnerships, mergers and acquisitions, geographical expansion, and product/service launches, to enhance their presence in the industry.

Advanced Technology and Materials - The vendor provides specialized soft magnetic components, delivering advanced amorphous alloy ribbons, nanocrystalline materials, and engineered magnetic cores designed for high-efficiency power distribution and industrial manufacturing applications.

The industry research and growth report includes detailed analyses of the competitive landscape of the market and information about key companies, including:

  • Advanced Technology and Materials
  • AONA Technology Co. Ltd.
  • Arnold Magnetic Tech.
  • Bomatec AG
  • China Amorphous Technology Co Ltd
  • Gaotune Technologies Co. Ltd.
  • Hitachi Ltd.
  • Leimai Magnetic Materials Co Ltd
  • Londerful New Material Technology
  • Metglas Inc.
  • Nanocrystalline Strip Technology
  • Nippon Steel Corp.
  • POSCO Co. Ltd.
  • Proterial Ltd.
  • TDK Corp.
  • Toshiba Materials Co. Ltd.
  • Transmart Industrial Ltd.
  • Vacuumschmelze GmbH and Co. KG
  • Vikarsh Nano Pvt. Ltd.
  • Yeke Technology Co. Ltd.

Qualitative and quantitative analysis of companies has been conducted to help clients understand the wider business environment as well as the strengths and weaknesses of key industry players. Data is qualitatively analyzed to categorize companies as pure play, category-focused, industry-focused, and diversified; it is quantitatively analyzed to categorize companies as dominant, leading, strong, tentative, and weak.

Recent Development and News in Amorphous steels market

  • In the Steel industry, the accelerated integration of advanced manufacturing technologies for high-permeability soft magnetic materials directly expanded the availability of specialized alloys, supporting increased Amorphous Steels demand for smart grid deployment projects requiring 30% lower transmission losses.
  • Stringent electrical efficiency regulations targeting base-load power conversion forced transformer manufacturers to substitute standard silicon steel with high-performance non-crystalline alloys, impacting Amorphous Steels demand to meet new energy performance standards.
  • The rapid expansion of artificial intelligence infrastructure mandated upgrades to high-density power delivery architectures, elevating Amorphous Steels consumption for hyperscale data center power components requiring 20% higher thermal efficiency.
  • Automotive structural transitions toward lightweight and high-efficiency electric vehicle powertrains shifted material procurement toward advanced metallic glasses, driving Amorphous Steels integration within electric vehicle power conversion modules to reduce stator weight by 15%.

Dive into Technavio’s robust research methodology, blending expert interviews, extensive data synthesis, and validated models for unparalleled Amorphous Steels Market insights. See full methodology.

Market Scope
Page number 303
Base year 2025
Historic period 2020-2024
Forecast period 2026-2030
Growth momentum & CAGR Accelerate at a CAGR of 5.2%
Market growth 2026-2030 USD 200177.3 thousand
Market structure Fragmented
YoY growth 2025-2026(%) 4.6%
Key countries China, Japan, India, South Korea, Australia, Indonesia, US, Canada, Mexico, Germany, France, UK, Italy, Spain, The Netherlands, Brazil, Argentina, Chile, Saudi Arabia, UAE, South Africa, Turkey and Egypt
Competitive landscape Leading Companies, Market Positioning of Companies, Competitive Strategies, and Industry Risks

Request Free Sample

Research Analyst Overview

  • The Amorphous Steels Market is undergoing a fundamental transformation as industries prioritize energy conservation and high-frequency power optimization. By eliminating the crystalline grain lattice, advanced iron-based metallic glass eliminates magnetic domain wall pinning, drastically reducing energy dissipation during continuous magnetization cycles.
  • Corporate boardrooms and utility planners are aligning their procurement strategies to mandate the use of soft magnetic alloy ribbons, achieving a 35% improvement in overall network transmission efficiency compared to standard legacy grid infrastructure.
  • This strategic shift is further accelerated by engineering breakthroughs that deliver high saturation flux density in newer alloy formulations, allowing for the miniaturization of electrical components without sacrificing performance. Furthermore, the integration of bulk metallic glass components into industrial automation and aerospace applications ensures superior mechanical wear resistance and eddy current minimization.
  • As regulatory frameworks tighten around energy performance, manufacturers are heavily prioritizing these advanced non-crystalline materials to secure long-term compliance, reduce lifecycle operational expenditures, and differentiate next-generation power electronics in an increasingly efficiency-driven industrial landscape.

What are the Key Data Covered in this Amorphous Steels Market Research and Growth Report?

  • What is the expected growth of the Amorphous Steels Market between 2026 and 2030?

    • USD 200.18 million, at a CAGR of 5.2%

  • What segmentation does the market report cover?

    • The report is segmented by Type (Amorphous ribbon, and Nano-crystalline ribbon), Application (Distribution transformer, Consumer electronics, Automotive, and Others), Product (Single-ply coil, Multiple-ply coil, and Processed cores) and Geography (APAC, North America, Europe, South America, Middle East and Africa)

  • Which regions are analyzed in the report?

    • APAC, North America, Europe, South America and Middle East and Africa

  • What are the key growth drivers and market challenges?

    • Global decarbonization mandates accelerating adoption of ultra low loss distribution transformer cores, High capital investment and production complexity of rapid solidification ribbon casting protocols

  • Who are the major players in the Amorphous Steels Market?

    • Advanced Technology and Materials, AONA Technology Co. Ltd., Arnold Magnetic Tech., Bomatec AG, China Amorphous Technology Co Ltd, Gaotune Technologies Co. Ltd., Hitachi Ltd., Leimai Magnetic Materials Co Ltd, Londerful New Material Technology, Metglas Inc., Nanocrystalline Strip Technology, Nippon Steel Corp., POSCO Co. Ltd., Proterial Ltd., TDK Corp., Toshiba Materials Co. Ltd., Transmart Industrial Ltd., Vacuumschmelze GmbH and Co. KG, Vikarsh Nano Pvt. Ltd. and Yeke Technology Co. Ltd.

Market Research Insights

  • The Amorphous Steels Market is structurally evolving to meet the intense efficiency demands of modern power electronics and electrical grids. Manufacturers are increasingly integrating non-crystalline alloys to optimize thermal dissipation control in high-frequency applications. By mitigating magnetic core saturation, component designers have successfully improved the power usage effectiveness of advanced computing facilities by 18%.
  • Furthermore, the incorporation of these low-loss magnetic materials into renewable energy inverter systems has increased overall power conversion efficiency by up to 25%, directly lowering operational lifecycle costs for utility providers. This systemic transition toward high-performance metallic glasses enables operators to achieve stringent regulatory compliance while maximizing the reliability and output of critical electrical infrastructure.

We can help! Our analysts can customize this amorphous steels market research report to meet your requirements.

Get in touch

1. Executive Summary

1.1 Market overview

Executive Summary - Chart on Market Overview
Executive Summary - Data Table on Market Overview
Executive Summary - Chart on Global Market Characteristics
Executive Summary - Chart on Market by Geography
Executive Summary - Chart on Market Segmentation by Type
Executive Summary - Chart on Market Segmentation by Application
Executive Summary - Chart on Market Segmentation by Product
Executive Summary - Chart on Incremental Growth
Executive Summary - Data Table on Incremental Growth
Executive Summary - Chart on Company Market Positioning

2. Technavio Analysis

2.1 Analysis of price sensitivity, lifecycle, customer purchase basket, adoption rates, and purchase criteria

2.2 Criticality of inputs and Factors of differentiation

Chart on Overview on criticality of inputs and factors of differentiation

2.3 Factors of disruption

Chart on Overview on factors of disruption

2.4 Impact of drivers and challenges

Chart on Impact of drivers and challenges in 2025 and 2030

3. Market Landscape

3.1 Market ecosystem

Chart on Parent Market
Data Table on - Parent Market

3.2 Market characteristics

Chart on Market characteristics analysis

3.3 Value chain analysis

Chart on Value chain analysis

4. Market Sizing

4.1 Market definition

Data Table on Offerings of companies included in the market definition

4.2 Market segment analysis

Market segments

4.3 Market size 2025

4.4 Market outlook: Forecast for 2025-2030

Chart on Global - Market size and forecast 2025-2030 ($ thousand)
Data Table on Global - Market size and forecast 2025-2030 ($ thousand)
Chart on Global Market: Year-over-year growth 2025-2030 (%)
Data Table on Global Market: Year-over-year growth 2025-2030 (%)

5. Historic Market Size

5.1 Global Amorphous Steels Market 2020 - 2024

Historic Market Size - Data Table on Global Amorphous Steels Market 2020 - 2024 ($ thousand)

5.2 Type segment analysis 2020 - 2024

Historic Market Size - Type Segment 2020 - 2024 ($ thousand)

5.3 Application segment analysis 2020 - 2024

Historic Market Size - Application Segment 2020 - 2024 ($ thousand)

5.4 Product segment analysis 2020 - 2024

Historic Market Size - Product Segment 2020 - 2024 ($ thousand)

5.5 Geography segment analysis 2020 - 2024

Historic Market Size - Geography Segment 2020 - 2024 ($ thousand)

5.6 Country segment analysis 2020 - 2024

Historic Market Size - Country Segment 2020 - 2024 ($ thousand)

6. Qualitative Analysis

6.1 Impact of AI on global amorphous steels market

6.2 Impact of geopolitical conflicts on global amorphous steels market

7. Five Forces Analysis

7.1 Five forces summary

Five forces analysis - Comparison between 2025 and 2030

7.2 Bargaining power of buyers

Bargaining power of buyers - Impact of key factors 2025 and 2030

7.3 Bargaining power of suppliers

Bargaining power of suppliers - Impact of key factors in 2025 and 2030

7.4 Threat of new entrants

Threat of new entrants - Impact of key factors in 2025 and 2030

7.5 Threat of substitutes

Threat of substitutes - Impact of key factors in 2025 and 2030

7.6 Threat of rivalry

Threat of rivalry - Impact of key factors in 2025 and 2030

7.7 Market condition

Chart on Market condition - Five forces 2025 and 2030

8. Market Segmentation by Type

8.1 Market segments

Chart on Type - Market share 2025-2030 (%)
Data Table on Type - Market share 2025-2030 (%)

8.2 Comparison by Type

Chart on Comparison by Type
Data Table on Comparison by Type

8.3 Amorphous ribbon - Market size and forecast 2025-2030

Chart on Amorphous ribbon - Market size and forecast 2025-2030 ($ thousand)
Data Table on Amorphous ribbon - Market size and forecast 2025-2030 ($ thousand)
Chart on Amorphous ribbon - Year-over-year growth 2025-2030 (%)
Data Table on Amorphous ribbon - Year-over-year growth 2025-2030 (%)

8.4 Nano-crystalline ribbon - Market size and forecast 2025-2030

Chart on Nano-crystalline ribbon - Market size and forecast 2025-2030 ($ thousand)
Data Table on Nano-crystalline ribbon - Market size and forecast 2025-2030 ($ thousand)
Chart on Nano-crystalline ribbon - Year-over-year growth 2025-2030 (%)
Data Table on Nano-crystalline ribbon - Year-over-year growth 2025-2030 (%)

8.5 Market opportunity by Type

Market opportunity by Type ($ thousand)
Data Table on Market opportunity by Type ($ thousand)

9. Market Segmentation by Application

9.1 Market segments

Chart on Application - Market share 2025-2030 (%)
Data Table on Application - Market share 2025-2030 (%)

9.2 Comparison by Application

Chart on Comparison by Application
Data Table on Comparison by Application

9.3 Distribution transformer - Market size and forecast 2025-2030

Chart on Distribution transformer - Market size and forecast 2025-2030 ($ thousand)
Data Table on Distribution transformer - Market size and forecast 2025-2030 ($ thousand)
Chart on Distribution transformer - Year-over-year growth 2025-2030 (%)
Data Table on Distribution transformer - Year-over-year growth 2025-2030 (%)

9.4 Consumer electronics - Market size and forecast 2025-2030

Chart on Consumer electronics - Market size and forecast 2025-2030 ($ thousand)
Data Table on Consumer electronics - Market size and forecast 2025-2030 ($ thousand)
Chart on Consumer electronics - Year-over-year growth 2025-2030 (%)
Data Table on Consumer electronics - Year-over-year growth 2025-2030 (%)

9.5 Automotive - Market size and forecast 2025-2030

Chart on Automotive - Market size and forecast 2025-2030 ($ thousand)
Data Table on Automotive - Market size and forecast 2025-2030 ($ thousand)
Chart on Automotive - Year-over-year growth 2025-2030 (%)
Data Table on Automotive - Year-over-year growth 2025-2030 (%)

9.6 Others - Market size and forecast 2025-2030

Chart on Others - Market size and forecast 2025-2030 ($ thousand)
Data Table on Others - Market size and forecast 2025-2030 ($ thousand)
Chart on Others - Year-over-year growth 2025-2030 (%)
Data Table on Others - Year-over-year growth 2025-2030 (%)

9.7 Market opportunity by Application

Market opportunity by Application ($ thousand)
Data Table on Market opportunity by Application ($ thousand)

10. Market Segmentation by Product

10.1 Market segments

Chart on Product - Market share 2025-2030 (%)
Data Table on Product - Market share 2025-2030 (%)

10.2 Comparison by Product

Chart on Comparison by Product
Data Table on Comparison by Product

10.3 Single-ply coil - Market size and forecast 2025-2030

Chart on Single-ply coil - Market size and forecast 2025-2030 ($ thousand)
Data Table on Single-ply coil - Market size and forecast 2025-2030 ($ thousand)
Chart on Single-ply coil - Year-over-year growth 2025-2030 (%)
Data Table on Single-ply coil - Year-over-year growth 2025-2030 (%)

10.4 Multiple-ply coil - Market size and forecast 2025-2030

Chart on Multiple-ply coil - Market size and forecast 2025-2030 ($ thousand)
Data Table on Multiple-ply coil - Market size and forecast 2025-2030 ($ thousand)
Chart on Multiple-ply coil - Year-over-year growth 2025-2030 (%)
Data Table on Multiple-ply coil - Year-over-year growth 2025-2030 (%)

10.5 Processed cores - Market size and forecast 2025-2030

Chart on Processed cores - Market size and forecast 2025-2030 ($ thousand)
Data Table on Processed cores - Market size and forecast 2025-2030 ($ thousand)
Chart on Processed cores - Year-over-year growth 2025-2030 (%)
Data Table on Processed cores - Year-over-year growth 2025-2030 (%)

10.6 Market opportunity by Product

Market opportunity by Product ($ thousand)
Data Table on Market opportunity by Product ($ thousand)

11. Customer Landscape

11.1 Customer landscape overview

Analysis of price sensitivity, lifecycle, customer purchase basket, adoption rates, and purchase criteria

12. Geographic Landscape

12.1 Geographic segmentation

Chart on Market share by geography 2025-2030 (%)
Data Table on Market share by geography 2025-2030 (%)

12.2 Geographic comparison

Chart on Geographic comparison
Data Table on Geographic comparison

12.3 APAC - Market size and forecast 2025-2030

Chart on APAC - Market size and forecast 2025-2030 ($ thousand)
Data Table on APAC - Market size and forecast 2025-2030 ($ thousand)
Chart on APAC - Year-over-year growth 2025-2030 (%)
Data Table on APAC - Year-over-year growth 2025-2030 (%)
Chart on Regional Comparison - APAC
Data Table on Regional Comparison - APAC

12.3.1 China - Market size and forecast 2025-2030

Chart on China - Market size and forecast 2025-2030 ($ thousand)
Data Table on China - Market size and forecast 2025-2030 ($ thousand)
Chart on China - Year-over-year growth 2025-2030 (%)
Data Table on China - Year-over-year growth 2025-2030 (%)

12.3.2 Japan - Market size and forecast 2025-2030

Chart on Japan - Market size and forecast 2025-2030 ($ thousand)
Data Table on Japan - Market size and forecast 2025-2030 ($ thousand)
Chart on Japan - Year-over-year growth 2025-2030 (%)
Data Table on Japan - Year-over-year growth 2025-2030 (%)

12.3.3 India - Market size and forecast 2025-2030

Chart on India - Market size and forecast 2025-2030 ($ thousand)
Data Table on India - Market size and forecast 2025-2030 ($ thousand)
Chart on India - Year-over-year growth 2025-2030 (%)
Data Table on India - Year-over-year growth 2025-2030 (%)

12.3.4 South Korea - Market size and forecast 2025-2030

Chart on South Korea - Market size and forecast 2025-2030 ($ thousand)
Data Table on South Korea - Market size and forecast 2025-2030 ($ thousand)
Chart on South Korea - Year-over-year growth 2025-2030 (%)
Data Table on South Korea - Year-over-year growth 2025-2030 (%)

12.3.5 Australia - Market size and forecast 2025-2030

Chart on Australia - Market size and forecast 2025-2030 ($ thousand)
Data Table on Australia - Market size and forecast 2025-2030 ($ thousand)
Chart on Australia - Year-over-year growth 2025-2030 (%)
Data Table on Australia - Year-over-year growth 2025-2030 (%)

12.3.6 Indonesia - Market size and forecast 2025-2030

Chart on Indonesia - Market size and forecast 2025-2030 ($ thousand)
Data Table on Indonesia - Market size and forecast 2025-2030 ($ thousand)
Chart on Indonesia - Year-over-year growth 2025-2030 (%)
Data Table on Indonesia - Year-over-year growth 2025-2030 (%)

12.4 North America - Market size and forecast 2025-2030

Chart on North America - Market size and forecast 2025-2030 ($ thousand)
Data Table on North America - Market size and forecast 2025-2030 ($ thousand)
Chart on North America - Year-over-year growth 2025-2030 (%)
Data Table on North America - Year-over-year growth 2025-2030 (%)
Chart on Regional Comparison - North America
Data Table on Regional Comparison - North America

12.4.1 US - Market size and forecast 2025-2030

Chart on US - Market size and forecast 2025-2030 ($ thousand)
Data Table on US - Market size and forecast 2025-2030 ($ thousand)
Chart on US - Year-over-year growth 2025-2030 (%)
Data Table on US - Year-over-year growth 2025-2030 (%)

12.4.2 Canada - Market size and forecast 2025-2030

Chart on Canada - Market size and forecast 2025-2030 ($ thousand)
Data Table on Canada - Market size and forecast 2025-2030 ($ thousand)
Chart on Canada - Year-over-year growth 2025-2030 (%)
Data Table on Canada - Year-over-year growth 2025-2030 (%)

12.4.3 Mexico - Market size and forecast 2025-2030

Chart on Mexico - Market size and forecast 2025-2030 ($ thousand)
Data Table on Mexico - Market size and forecast 2025-2030 ($ thousand)
Chart on Mexico - Year-over-year growth 2025-2030 (%)
Data Table on Mexico - Year-over-year growth 2025-2030 (%)

12.5 Europe - Market size and forecast 2025-2030

Chart on Europe - Market size and forecast 2025-2030 ($ thousand)
Data Table on Europe - Market size and forecast 2025-2030 ($ thousand)
Chart on Europe - Year-over-year growth 2025-2030 (%)
Data Table on Europe - Year-over-year growth 2025-2030 (%)
Chart on Regional Comparison - Europe
Data Table on Regional Comparison - Europe

12.5.1 Germany - Market size and forecast 2025-2030

Chart on Germany - Market size and forecast 2025-2030 ($ thousand)
Data Table on Germany - Market size and forecast 2025-2030 ($ thousand)
Chart on Germany - Year-over-year growth 2025-2030 (%)
Data Table on Germany - Year-over-year growth 2025-2030 (%)

12.5.2 France - Market size and forecast 2025-2030

Chart on France - Market size and forecast 2025-2030 ($ thousand)
Data Table on France - Market size and forecast 2025-2030 ($ thousand)
Chart on France - Year-over-year growth 2025-2030 (%)
Data Table on France - Year-over-year growth 2025-2030 (%)

12.5.3 UK - Market size and forecast 2025-2030

Chart on UK - Market size and forecast 2025-2030 ($ thousand)
Data Table on UK - Market size and forecast 2025-2030 ($ thousand)
Chart on UK - Year-over-year growth 2025-2030 (%)
Data Table on UK - Year-over-year growth 2025-2030 (%)

12.5.4 Italy - Market size and forecast 2025-2030

Chart on Italy - Market size and forecast 2025-2030 ($ thousand)
Data Table on Italy - Market size and forecast 2025-2030 ($ thousand)
Chart on Italy - Year-over-year growth 2025-2030 (%)
Data Table on Italy - Year-over-year growth 2025-2030 (%)

12.5.5 Spain - Market size and forecast 2025-2030

Chart on Spain - Market size and forecast 2025-2030 ($ thousand)
Data Table on Spain - Market size and forecast 2025-2030 ($ thousand)
Chart on Spain - Year-over-year growth 2025-2030 (%)
Data Table on Spain - Year-over-year growth 2025-2030 (%)

12.5.6 The Netherlands - Market size and forecast 2025-2030

Chart on The Netherlands - Market size and forecast 2025-2030 ($ thousand)
Data Table on The Netherlands - Market size and forecast 2025-2030 ($ thousand)
Chart on The Netherlands - Year-over-year growth 2025-2030 (%)
Data Table on The Netherlands - Year-over-year growth 2025-2030 (%)

12.6 South America - Market size and forecast 2025-2030

Chart on South America - Market size and forecast 2025-2030 ($ thousand)
Data Table on South America - Market size and forecast 2025-2030 ($ thousand)
Chart on South America - Year-over-year growth 2025-2030 (%)
Data Table on South America - Year-over-year growth 2025-2030 (%)
Chart on Regional Comparison - South America
Data Table on Regional Comparison - South America

12.6.1 Brazil - Market size and forecast 2025-2030

Chart on Brazil - Market size and forecast 2025-2030 ($ thousand)
Data Table on Brazil - Market size and forecast 2025-2030 ($ thousand)
Chart on Brazil - Year-over-year growth 2025-2030 (%)
Data Table on Brazil - Year-over-year growth 2025-2030 (%)

12.6.2 Argentina - Market size and forecast 2025-2030

Chart on Argentina - Market size and forecast 2025-2030 ($ thousand)
Data Table on Argentina - Market size and forecast 2025-2030 ($ thousand)
Chart on Argentina - Year-over-year growth 2025-2030 (%)
Data Table on Argentina - Year-over-year growth 2025-2030 (%)

12.6.3 Chile - Market size and forecast 2025-2030

Chart on Chile - Market size and forecast 2025-2030 ($ thousand)
Data Table on Chile - Market size and forecast 2025-2030 ($ thousand)
Chart on Chile - Year-over-year growth 2025-2030 (%)
Data Table on Chile - Year-over-year growth 2025-2030 (%)

12.7 Middle East and Africa - Market size and forecast 2025-2030

Chart on Middle East and Africa - Market size and forecast 2025-2030 ($ thousand)
Data Table on Middle East and Africa - Market size and forecast 2025-2030 ($ thousand)
Chart on Middle East and Africa - Year-over-year growth 2025-2030 (%)
Data Table on Middle East and Africa - Year-over-year growth 2025-2030 (%)
Chart on Regional Comparison - Middle East and Africa
Data Table on Regional Comparison - Middle East and Africa

12.7.1 Saudi Arabia - Market size and forecast 2025-2030

Chart on Saudi Arabia - Market size and forecast 2025-2030 ($ thousand)
Data Table on Saudi Arabia - Market size and forecast 2025-2030 ($ thousand)
Chart on Saudi Arabia - Year-over-year growth 2025-2030 (%)
Data Table on Saudi Arabia - Year-over-year growth 2025-2030 (%)

12.7.2 UAE - Market size and forecast 2025-2030

Chart on UAE - Market size and forecast 2025-2030 ($ thousand)
Data Table on UAE - Market size and forecast 2025-2030 ($ thousand)
Chart on UAE - Year-over-year growth 2025-2030 (%)
Data Table on UAE - Year-over-year growth 2025-2030 (%)

12.7.3 South Africa - Market size and forecast 2025-2030

Chart on South Africa - Market size and forecast 2025-2030 ($ thousand)
Data Table on South Africa - Market size and forecast 2025-2030 ($ thousand)
Chart on South Africa - Year-over-year growth 2025-2030 (%)
Data Table on South Africa - Year-over-year growth 2025-2030 (%)

12.7.4 Turkey - Market size and forecast 2025-2030

Chart on Turkey - Market size and forecast 2025-2030 ($ thousand)
Data Table on Turkey - Market size and forecast 2025-2030 ($ thousand)
Chart on Turkey - Year-over-year growth 2025-2030 (%)
Data Table on Turkey - Year-over-year growth 2025-2030 (%)

12.7.5 Egypt - Market size and forecast 2025-2030

Chart on Egypt - Market size and forecast 2025-2030 ($ thousand)
Data Table on Egypt - Market size and forecast 2025-2030 ($ thousand)
Chart on Egypt - Year-over-year growth 2025-2030 (%)
Data Table on Egypt - Year-over-year growth 2025-2030 (%)

12.8 Market opportunity by geography

Market opportunity by geography ($ thousand)
Data Tables on Market opportunity by geography ($ thousand)

13. Drivers, Challenges, and Opportunity

13.1 Market drivers

Global decarbonization mandates accelerating adoption of ultra low loss distribution transformer cores
Rapid expansion of AI data centers driving demand for high frequency soft magnetics
Automotive electrification and lightweighting mandates spurring advanced metallic glass component integration

13.2 Market challenges

High capital investment and production complexity of rapid solidification ribbon casting protocols
Mechanical brittleness and complex core fabrication challenges impairing downstream transformer assembly
Raw material price volatility and restricted supply chain reliance on specialized glass formers

13.3 Impact of drivers and challenges

Impact of drivers and challenges in 2025 and 2030

13.4 Market opportunities

Integration of additive manufacturing workflows for complex bulk metallic glass component synthesis
Development of high saturation flux density alloys to supercede grain oriented silicon steel
Decentralized production facility expansion across high growth emerging utility markets

14. Competitive Landscape

14.1 Overview

14.2

Overview on criticality of inputs and factors of differentiation

14.3 Landscape disruption

Overview on factors of disruption

14.4 Industry risks

Impact of key risks on business

15. Competitive Analysis

15.1 Companies profiled

Companies covered

15.2 Company ranking index

15.3 Market positioning of companies

Matrix on companies position and classification

15.4 Advanced Technology and Materials

Advanced Technology and Materials - Overview
Advanced Technology and Materials - Business segments
Advanced Technology and Materials - Key offerings
Advanced Technology and Materials - Segment focus
SWOT

15.5 AONA Technology Co. Ltd.

AONA Technology Co. Ltd. - Overview
AONA Technology Co. Ltd. - Product / Service
AONA Technology Co. Ltd. - Key offerings
SWOT

15.6 Arnold Magnetic Tech.

Arnold Magnetic Tech. - Overview
Arnold Magnetic Tech. - Product / Service
Arnold Magnetic Tech. - Key offerings
SWOT

15.7 Bomatec AG

Bomatec AG - Overview
Bomatec AG - Product / Service
Bomatec AG - Key offerings
SWOT

15.8 China Amorphous Technology Co Ltd

China Amorphous Technology Co Ltd - Overview
China Amorphous Technology Co Ltd - Product / Service
China Amorphous Technology Co Ltd - Key offerings
SWOT

15.9 Gaotune Technologies Co. Ltd.

Gaotune Technologies Co. Ltd. - Overview
Gaotune Technologies Co. Ltd. - Product / Service
Gaotune Technologies Co. Ltd. - Key offerings
SWOT

15.10 Hitachi Ltd.

Hitachi Ltd. - Overview
Hitachi Ltd. - Business segments
Hitachi Ltd. - Key offerings
Hitachi Ltd. - Segment focus
SWOT

15.11 Leimai Magnetic Materials Co Ltd

Leimai Magnetic Materials Co Ltd - Overview
Leimai Magnetic Materials Co Ltd - Product / Service
Leimai Magnetic Materials Co Ltd - Key offerings
SWOT

15.12 Londerful New Material Technology

Londerful New Material Technology - Overview
Londerful New Material Technology - Product / Service
Londerful New Material Technology - Key offerings
SWOT

15.13 Metglas Inc.

Metglas Inc. - Overview
Metglas Inc. - Product / Service
Metglas Inc. - Key offerings
SWOT

15.14 Nippon Steel Corp.

Nippon Steel Corp. - Overview
Nippon Steel Corp. - Business segments
Nippon Steel Corp. - Key offerings
Nippon Steel Corp. - Segment focus
SWOT

15.15 POSCO Co. Ltd.

POSCO Co. Ltd. - Overview
POSCO Co. Ltd. - Business segments
POSCO Co. Ltd. - Key news
POSCO Co. Ltd. - Key offerings
POSCO Co. Ltd. - Segment focus
SWOT

15.16 Proterial Ltd.

Proterial Ltd. - Overview
Proterial Ltd. - Product / Service
Proterial Ltd. - Key offerings
SWOT

15.17 TDK Corp.

TDK Corp. - Overview
TDK Corp. - Business segments
TDK Corp. - Key offerings
TDK Corp. - Segment focus
SWOT

15.18 Yeke Technology Co. Ltd.

Yeke Technology Co. Ltd. - Overview
Yeke Technology Co. Ltd. - Product / Service
Yeke Technology Co. Ltd. - Key offerings
SWOT

16. Appendix

16.1 Scope of the report

Market definition
Objectives
Notes and caveats

16.2 Inclusions and exclusions checklist

Inclusions checklist
Exclusions checklist

16.3 Currency conversion rates for US$

16.4 Research methodology

16.5 Data procurement

Information sources

16.6 Data validation

16.7 Validation techniques employed for market sizing

16.8 Data synthesis

16.9 360 degree market analysis

16.10 List of abbreviations

Research Methodology

Technavio presents a detailed picture of the market by way of study, synthesis, and summation of data from multiple sources. The analysts have presented the various facets of the market with a particular focus on identifying the key industry influencers. The data thus presented is comprehensive, reliable, and the result of extensive research, both primary and secondary.

INFORMATION SOURCES

Primary sources

  • Manufacturers and suppliers
  • Channel partners
  • Industry experts
  • Strategic decision makers

Secondary sources

  • Industry journals and periodicals
  • Government data
  • Financial reports of key industry players
  • Historical data
  • Press releases

DATA ANALYSIS

Data Synthesis

  • Collation of data
  • Estimation of key figures
  • Analysis of derived insights

Data Validation

  • Triangulation with data models
  • Reference against proprietary databases
  • Corroboration with industry experts

REPORT WRITING

Qualitative

  • Market drivers
  • Market challenges
  • Market trends
  • Five forces analysis

Quantitative

  • Market size and forecast
  • Market segmentation
  • Geographical insights
  • Competitive landscape

Interested in this report?

Get your sample now to see our research methodology and insights!

Download Now

Frequently Asked Questions

Amorphous Steels market growth will increase by USD 200177.3 thousand thousand during 2026-2030.

The Amorphous Steels market is expected to grow at a CAGR of 5.2% during 2026-2030.

Amorphous Steels market is segmented by Type (Amorphous ribbon, Nano-crystalline ribbon) Application (Distribution transformer, Consumer electronics, Automotive, Others) Product (Single-ply coil, Multiple-ply coil, Processed cores)

Advanced Technology and Materials, AONA Technology Co. Ltd., Arnold Magnetic Tech., Bomatec AG, China Amorphous Technology Co Ltd, Gaotune Technologies Co. Ltd., Hitachi Ltd., Leimai Magnetic Materials Co Ltd, Londerful New Material Technology, Metglas Inc., Nanocrystalline Strip Technology, Nippon Steel Corp., POSCO Co. Ltd., Proterial Ltd., TDK Corp., Toshiba Materials Co. Ltd., Transmart Industrial Ltd., Vacuumschmelze GmbH and Co. KG, Vikarsh Nano Pvt. Ltd., Yeke Technology Co. Ltd. are a few of the key vendors in the Amorphous Steels market.

APAC will register the highest growth rate of 76.8% among the other regions. Therefore, the Amorphous Steels market in APAC is expected to garner significant business opportunities for the vendors during the forecast period.

China, Japan, India, South Korea, Australia, Indonesia, US, Canada, Mexico, Germany, France, UK, Italy, Spain, The Netherlands, Brazil, Argentina, Chile, Saudi Arabia, UAE, South Africa, Turkey, Egypt

  • Global decarbonization mandates accelerating adoption of ultra low loss distribution transformer cores is the driving factor this market.

The Amorphous Steels market vendors should focus on grabbing business opportunities from the Type segment as it accounted for the largest market share in the base year.
RIA - Research AI Assistant
Ask RIA
