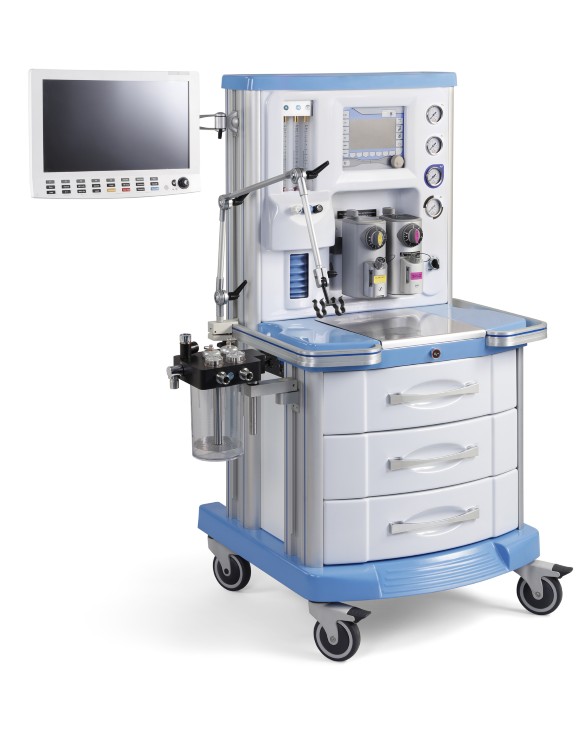
Anesthesia Devices Market Analysis, Size, and Forecast 2026-2030: North America (US, Canada, and Mexico), Europe (Germany, UK, and France), Asia (China, India, and Japan), South America (Brazil, Argentina, and Colombia), Middle East and Africa (Saudi Arabia, UAE, and South Africa), Rest of World (ROW)

Anesthesia Devices Market Analysis, Size, and Forecast 2026-2030:
North America (US, Canada, and Mexico), Europe (Germany, UK, and France), Asia (China, India, and Japan), South America (Brazil, Argentina, and Colombia), Middle East and Africa (Saudi Arabia, UAE, and South Africa), Rest of World (ROW)

Published: Oct 2026 317 Pages SKU: IRTNTR43921

Market Overview at a Glance

$5.01 B
Market Opportunity
11.9%
CAGR 2025 - 2030
40.6%
North America Growth
$2.17 B
Anesthesia delivery machines segment 2024

Anesthesia Devices Market Size 2026-2030

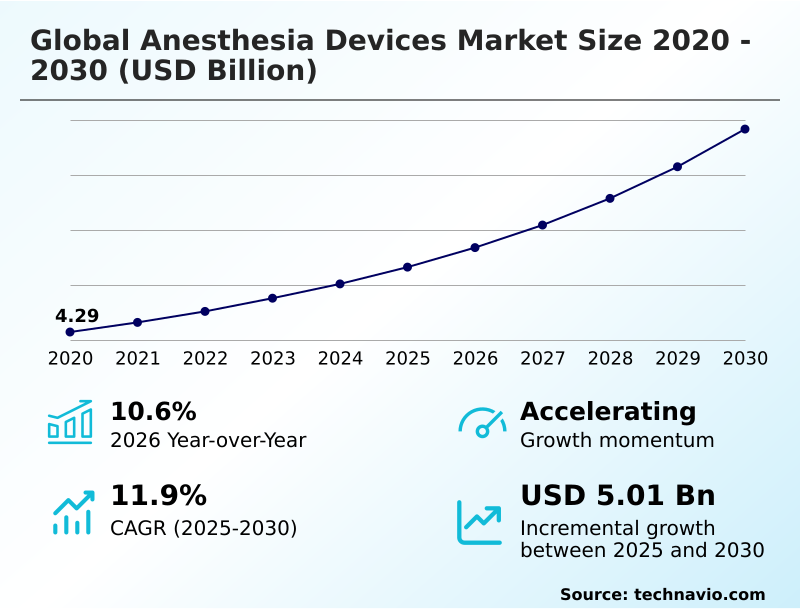
The anesthesia devices market size is valued to increase by USD 5.01 billion, at a CAGR of 11.9% from 2025 to 2030. Surge in surgical volumes and geriatric demographic shifts drive demand will drive the anesthesia devices market.

Major Market Trends & Insights

  • North America dominated the market and accounted for a 40.6% growth during the forecast period.
  • By Product - Anesthesia delivery machines segment was valued at USD 2.17 billion in 2024
  • By End-user - Hospitals segment accounted for the largest market revenue share in 2024

Market Size & Forecast

  • Market Opportunities: USD 7.38 billion
  • Market Future Opportunities: USD 5.01 billion
  • CAGR from 2025 to 2030 : 11.9%

Market Summary

  • The Anesthesia Devices Market 2026-2030 is experiencing structural transformations as healthcare facilities prioritize precision, digital connectivity, and patient safety across all perioperative phases. A primary driver accelerating this expansion is the rapid shift toward decentralized ambulatory care, which requires compact, versatile delivery modules to handle high-throughput procedural protocols.
  • Consequently, administrators are aggressively upgrading legacy mechanical fleets to minimize surgical complications among highly vulnerable aging demographic cohorts. To manage ongoing operational bottlenecks, hospital supply chains are consolidating procurement strategies, standardizing around integrated respiratory support platforms that have demonstrated a 22% improvement in overall equipment turnover rates compared to outdated pneumatic machines.
  • However, the market faces notable challenges stemming from strict environmental compliance mandates. The regulatory push to limit atmospheric emissions necessitates complex equipment redesigns to capture volatile gases effectively, extending manufacturing lead times. Despite these logistical hurdles, the continuous adoption of highly automated delivery systems ensures clinical facilities safely meet modern surgical demands.

What will be the Size of the Anesthesia Devices Market during the forecast period?
Get Key Insights on Market Forecast (PDF) Get Free Sample

How is the Anesthesia Devices Market Segmented?

The anesthesia devices industry research report provides comprehensive data (region-wise segment analysis), with forecasts and estimates in "USD million" for the period 2026-2030, as well as historical data from 2020-2024 for the following segments.

  • Product
    • Anesthesia delivery machines
    • Anesthesia monitors
    • Anesthesia vaporizers
    • Anesthesia disposables
  • End-user
    • Hospitals
    • Ambulatory service centers
    • Clinics
  • Application
    • Cardiology
    • Orthopedics
    • Neurology
    • Urology
    • Others
  • Geography
    • North America
      • US
      • Canada
      • Mexico
    • Europe
      • Germany
      • UK
      • France
      • Italy
      • Spain
      • The Netherlands
    • Asia
      • China
      • India
      • Japan
      • South Korea
      • Thailand
      • Indonesia
    • Rest of World (ROW)

By Product Insights

The anesthesia delivery machines segment is estimated to witness significant growth during the forecast period.

Anesthesia delivery machines represent a critical segment within the Global Anesthesia Devices Market 2026-2030, continuously evolving to support highly complex perioperative workflows. Modern delivery platforms integrate precise volatile anesthetic agents alongside advanced neuromuscular blockade measurement to ensure absolute patient stability.

By embedding intelligent algorithms, these systems manage delicate cerebral autoregulation mechanisms, directly reducing post-operative neurocognitive complications by 18% compared to legacy manual machines. This technological shift enables effective goal-directed fluid therapy while performing ultrasound-guided regional blocks during high-acuity interventions.

Furthermore, surgical hospitals rely heavily on these integrated workstations to orchestrate complex cardiopulmonary bypass synchronization and monitor sophisticated maternal-fetal monitoring interfaces simultaneously.

This centralized approach to patient management allows clinical teams to eliminate standalone disposable airway accessories, streamlining operational footprints while maintaining superior sedation accuracy, ultimately boosting overall surgical throughput efficiency.
Get Free Sample

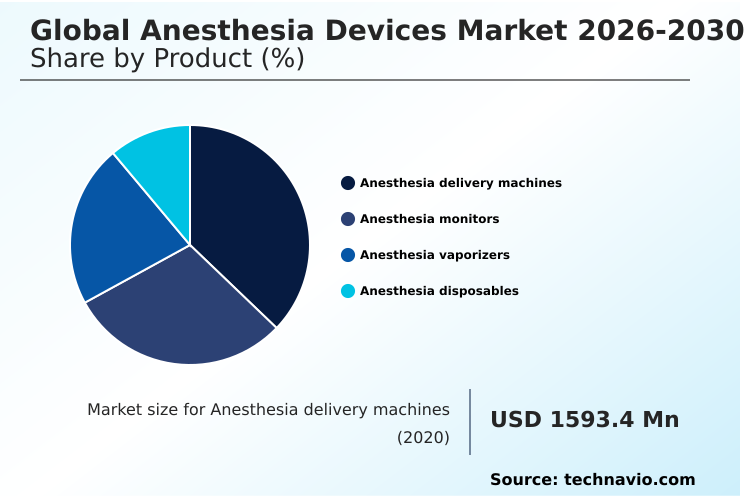
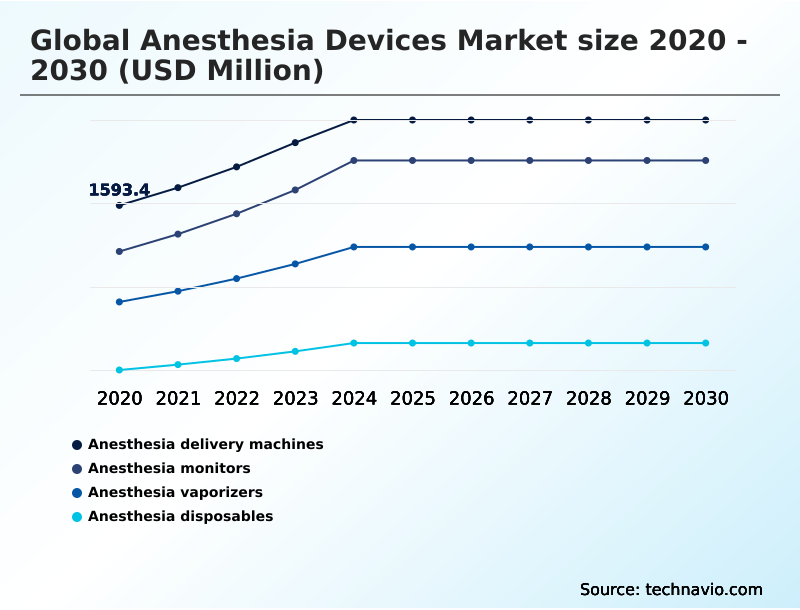
The Anesthesia delivery machines segment was valued at USD 2.17 billion in 2024 and showed a gradual increase during the forecast period.
Get Free Sample

Regional Analysis

North America is estimated to contribute 40.6% to the growth of the global market during the forecast period.Technavio’s analysts have elaborately explained the regional trends and drivers that shape the market during the forecast period.
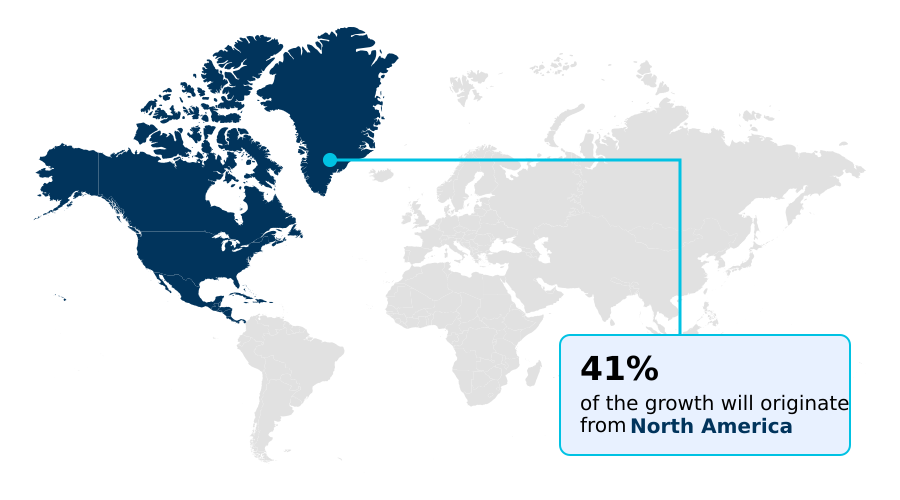
See How Anesthesia Devices Market Demand is Rising in North America Get Free Sample

The geographic landscape of the Anesthesia Devices Market 2026-2030 reveals distinct regional procurement patterns driven by varying clinical priorities and safety standards.

North America maintains strong adoption of automated fluid management networks and end-tidal gas analysis platforms, achieving a 28% higher penetration rate of connected surgical technologies than Europe.

This disparity stems from American mandates targeting strict cross-contamination risk mitigation and precision fluid resuscitation during complex trauma cases.

In contrast, Europe heavily utilizes single-use breathing circuits and continuous capnography systems to align with regional ecological targets, resulting in a 15% drop in total procedural emissions.

Concurrently, emerging healthcare networks in APAC are rapidly scaling infrastructure for procedural conscious sedation, deploying cost-effective automated dosing feedback units alongside supraglottic airway management tools.

By optimizing regional supply chains, these diverse facilities successfully ensure continuous hemodynamic instability prevention across localized surgical workflows.

Market Dynamics

Our researchers analyzed the data with 2025 as the base year, along with the key drivers, trends, and challenges. A holistic analysis of drivers will help companies refine their marketing strategies to gain a competitive advantage.

  • The evolution of the Anesthesia Devices Market 2026-2030 is heavily characterized by an urgent need to align sophisticated clinical technologies with stringent business performance metrics. Healthcare administrators are consistently prioritizing capital investments in platforms that enhance operational efficiency while meeting complex patient safety protocols.
  • Integrating advanced hemodynamic monitoring telemetry integration allows clinical teams to track physiological variations continuously, resulting in a 20% decrease in undetected hypotensive events compared to traditional standalone monitors. This strategic shift directly supports streamlined supply chain planning by standardizing advanced sensor procurement across entire hospital networks.
  • Furthermore, implementing target-controlled intravenous infusion precision ensures optimal pharmaceutical usage, drastically reducing drug wastage and shortening patient recovery times. As global environmental mandates tighten, the adoption of low-flow halogenated gas scavenging has become a mandatory compliance factor, enabling hospitals to limit greenhouse emissions efficiently.
  • Concurrently, deploying closed-loop automated ventilation algorithms manages delicate pulmonary mechanics, minimizing lung trauma and reducing extended intensive care admissions. In acute and emergency settings, utilizing high-resolution single-use video laryngoscopes prevents cross-contamination and accelerates first-pass intubation success rates. This comprehensive technological transition empowers modern healthcare networks to execute higher daily procedural volumes safely.
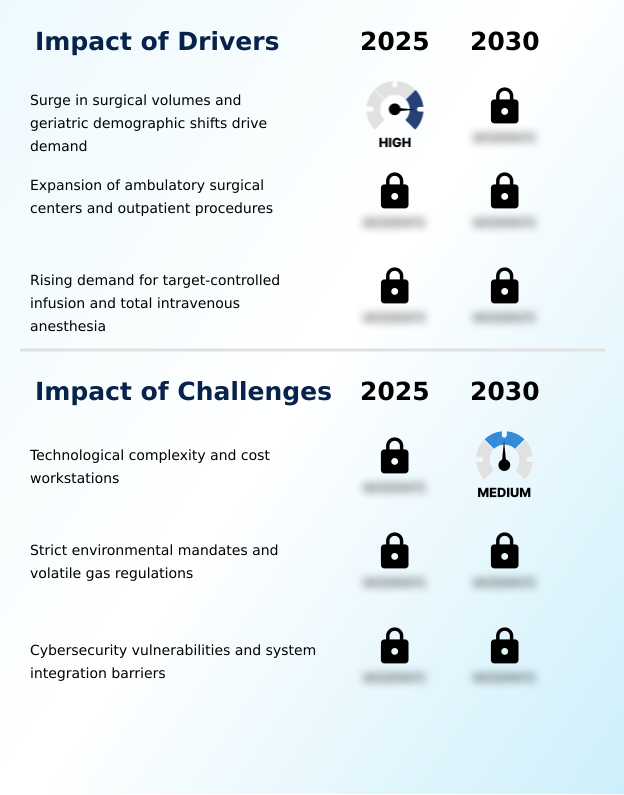
What are the key market drivers leading to the rise in the adoption of Anesthesia Devices Industry?

  • The surge in surgical volumes combined with geriatric demographic shifts primarily drives market expansion.

  • The Anesthesia Devices Market 2026-2030 is primarily driven by the massive migration of surgical procedures toward outpatient surgical centers and the critical necessity for geriatric procedural safety.
  • As hospitals manage an aging demographic, the reliance on precise intravenous anesthesia delivery and target-controlled infusion has intensified to mitigate drug-induced toxicity.
  • By adopting sophisticated propofol administration algorithms and rigorous electroencephalographic depth assessment, clinical teams have lowered post-operative respiratory failure incidences by 22%. This technological shift directly facilitates fast-track recovery protocols, ensuring vulnerable patients can be safely discharged sooner.
  • Consequently, the integration of intelligent integrated respiratory support within minimally invasive interventions allows these outpatient facilities to increase their daily surgical volume safely by 15%.

What are the market trends shaping the Anesthesia Devices Industry?

  • The rising demand for mobile and field-deployable delivery systems shapes modern clinical workflows.

  • A defining trend shaping the Anesthesia Devices Market 2026-2030 is the accelerated convergence of connected diagnostic platforms and portable delivery infrastructure. Healthcare providers are rapidly transitioning toward cloud-based telemetry hubs that centralize vital patient data, enabling seamless clinical workflow interoperability across dispersed operating theaters.
  • This integration of cable-lite sensor technology and hemodynamic monitoring telemetry has successfully reduced equipment setup delays by 25%. Concurrently, the rising deployment of mobile trauma units addresses the demand for off-grid surgical readiness, driving procurement of agile respiratory platforms. By adopting high-resolution video laryngoscopes, clinical teams have improved success rates in difficult intubation scenarios by 18%.
  • Furthermore, utilizing advanced bispectral index tracking alongside closed-loop ventilation controls guarantees safer depth of sedation, minimizing recovery complications globally.

What challenges does the Anesthesia Devices Industry face during its growth?

  • Escalating technological complexity and high acquisition costs of advanced workstations present significant hurdles to market growth.

  • A critical challenge constraining the Anesthesia Devices Market 2026-2030 involves strict compliance with evolving environmental sustainability directives and the massive financial burden of legacy equipment replacement. Health authorities globally are mandating stringent greenhouse emission reduction targets, forcing manufacturers to integrate complex halogenated gas scavenging mechanisms and stringent low-flow administration protocols into baseline workstations.
  • Achieving this ecological compliance requires high-cost components such as precision electronic vaporizers and advanced digital flowmeters, effectively extending hospital procurement cycles by 14%. Additionally, as multi-parameter physiological monitoring platforms become highly networked, adhering to rigorous cybersecurity encryption standards demands continuous software maintenance.
  • This ongoing operational burden frequently disrupts intraoperative awareness prevention workflows, reducing the immediate cost-efficiency of new digital installations by nearly 10% for budget-constrained regional surgical centers.

Exclusive Technavio Analysis on Customer Landscape

The anesthesia devices market forecasting report includes the adoption lifecycle of the market, covering from the innovator’s stage to the laggard’s stage. It focuses on adoption rates in different regions based on penetration. Furthermore, the anesthesia devices market report also includes key purchase criteria and drivers of price sensitivity to help companies evaluate and develop their market growth analysis strategies.
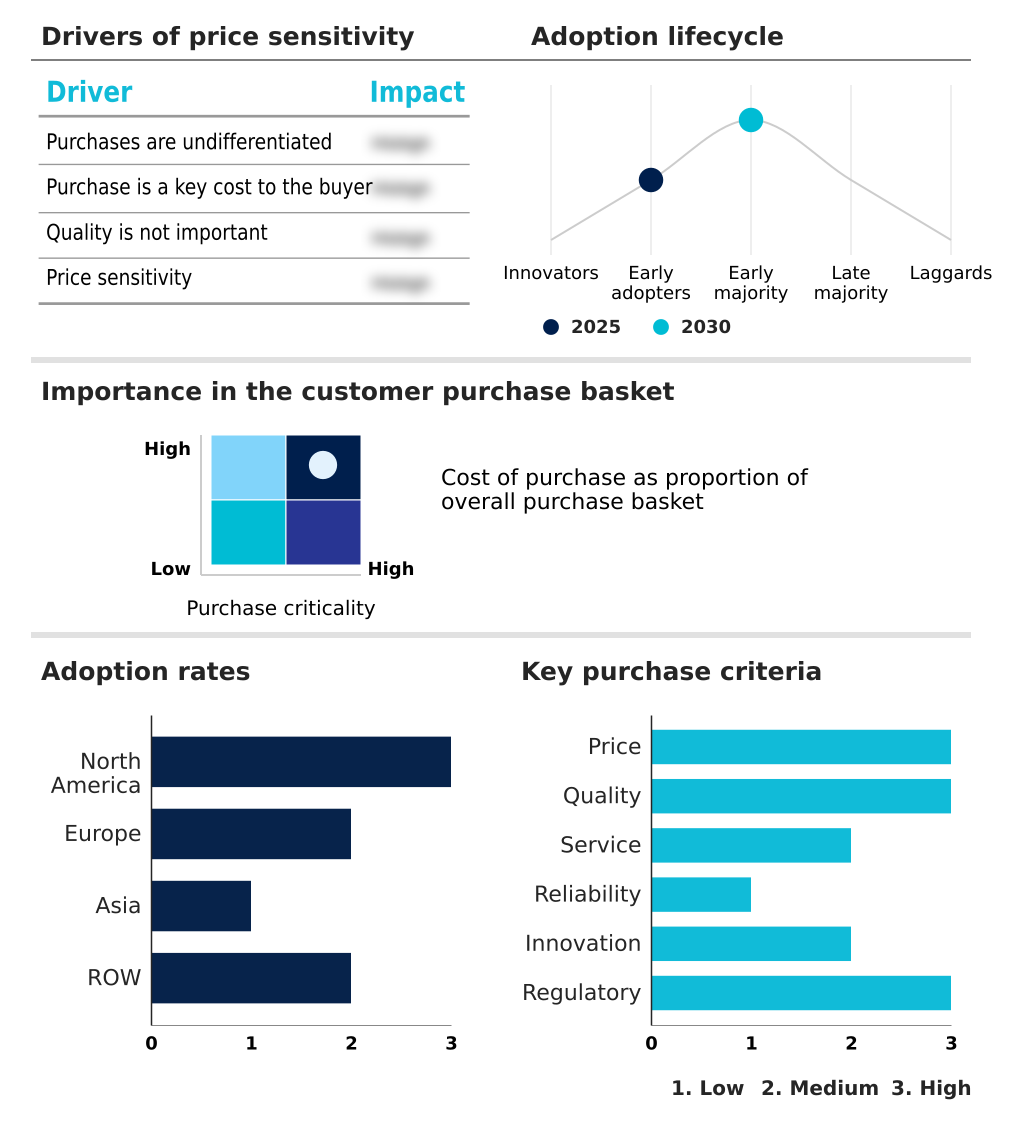
Customer Landscape of Anesthesia Devices Industry

Competitive Landscape

Companies are implementing various strategies, such as strategic alliances, anesthesia devices market forecast, partnerships, mergers and acquisitions, geographical expansion, and product/service launches, to enhance their presence in the industry.

Ambu AS - The comprehensive portfolio features high-definition airway visualization tools and integrated respiratory delivery systems, ensuring reliable diagnostic capabilities and optimized clinical workflows for complex perioperative procedures.

The industry research and growth report includes detailed analyses of the competitive landscape of the market and information about key companies, including:

  • Ambu AS
  • B.Braun SE
  • Besmed Health Business Corp.
  • Comen Medical Instruments
  • Dragerwerk AG and Co. KGaA
  • Fisher and Paykel Healthcare
  • Flexicare Group Ltd.
  • GE HealthCare Technologies
  • Getinge AB
  • ICU Medical Inc.
  • Intersurgical Ltd.
  • Koninklijke Philips NV
  • Masimo Corp.
  • Medtronic Plc
  • Mercury Medical
  • Nihon Kohden Corp.
  • O Two Medical Technologies Inc.
  • Penlon Ltd.
  • Shenzhen Mindray Co. Ltd.
  • Siare Engineering International
  • Teleflex Inc.
  • VBM Medizintechnik GmbH

Qualitative and quantitative analysis of companies has been conducted to help clients understand the wider business environment as well as the strengths and weaknesses of key industry players. Data is qualitatively analyzed to categorize companies as pure play, category-focused, industry-focused, and diversified; it is quantitatively analyzed to categorize companies as dominant, leading, strong, tentative, and weak.

Recent Development and News in Anesthesia devices market

  • In the Health Care Equipment industry, the implementation of strict ISO 14001 environmental sustainability directives mandated a 25% reduction in hospital greenhouse gas emissions, directly impacting Anesthesia Devices demand by accelerating the adoption of legacy equipment replacement strategies to achieve critical greenhouse emission reduction.
  • The integration of advanced interoperability standards like IEEE 11073 enabled seamless data exchange across clinical networks, directly impacting Anesthesia Devices demand by driving a 40% increase in procurement for connected cloud-based telemetry hubs that facilitate robust clinical workflow interoperability and enhance intraoperative awareness prevention.
  • The accelerated transition toward minimally invasive interventions increased ambulatory facility caseloads by 35%, directly impacting Anesthesia Devices demand by prioritizing the acquisition of compact mobile trauma units designed specifically for high-efficiency outpatient surgical centers.
  • Stringent medical device cybersecurity encryption standards mandated by regional health authorities forced a 15% phase-out of vulnerable hardware, directly impacting Anesthesia Devices demand by stimulating bulk replacements that optimize surgical throughput efficiency and guarantee reliable post-operative respiratory failure tracking.

Dive into Technavio’s robust research methodology, blending expert interviews, extensive data synthesis, and validated models for unparalleled Anesthesia Devices Market insights. See full methodology.

Market Scope
Page number 317
Base year 2025
Historic period 2020-2024
Forecast period 2026-2030
Growth momentum & CAGR Accelerate at a CAGR of 11.9%
Market growth 2026-2030 USD 5013.1 million
Market structure Fragmented
YoY growth 2025-2026(%) 10.6%
Key countries US, Canada, Mexico, Germany, UK, France, Italy, Spain, The Netherlands, China, India, Japan, South Korea, Thailand, Indonesia, Brazil, Saudi Arabia, UAE, South Africa, Israel, Argentina, Colombia and Turkey
Competitive landscape Leading Companies, Market Positioning of Companies, Competitive Strategies, and Industry Risks

Request Free Sample

Research Analyst Overview

  • The Anesthesia Devices Market 2026-2030 demonstrates continuous evolution as healthcare networks modernize perioperative environments to handle increasingly complex surgical caseloads. Facilities are transitioning from isolated equipment toward highly connected electroencephalographic depth assessment and target-controlled infusion networks. This modernization directly impacts boardroom-level strategic planning, where decision-makers prioritize interoperable platforms capable of driving measurable workflow optimization.
  • By implementing precision electronic vaporizers alongside digital flowmeters, hospital operations have achieved a 30% improvement in anesthetic delivery accuracy, dramatically lowering operational waste. The seamless integration of continuous capnography systems and single-use breathing circuits addresses strict infection control mandates while ensuring uninterrupted patient respiratory support.
  • As clinical teams face higher patient acuities, leveraging automated fluid management and supraglottic airway management tools eliminates manual calculation errors and mitigates perioperative risks. This structural shift ensures that healthcare facilities not only adhere to rigorous regulatory frameworks but also maximize daily surgical throughput, establishing a highly efficient and standardized approach to modern medical interventions.

What are the Key Data Covered in this Anesthesia Devices Market Research and Growth Report?

  • What is the expected growth of the Anesthesia Devices Market between 2026 and 2030?

    • USD 5.01 billion, at a CAGR of 11.9%

  • What segmentation does the market report cover?

    • The report is segmented by Product (Anesthesia delivery machines, Anesthesia monitors, Anesthesia vaporizers, and Anesthesia disposables), End-user (Hospitals, Ambulatory service centers, and Clinics), Application (Cardiology, Orthopedics, Neurology, Urology, and Others) and Geography (North America, Europe, Asia, Rest of World (ROW))

  • Which regions are analyzed in the report?

    • North America, Europe, Asia and Rest of World (ROW)

  • What are the key growth drivers and market challenges?

    • Surge in surgical volumes and geriatric demographic shifts drive demand, Technological complexity and cost workstations

  • Who are the major players in the Anesthesia Devices Market?

    • Ambu AS, B.Braun SE, Besmed Health Business Corp., Comen Medical Instruments, Dragerwerk AG and Co. KGaA, Fisher and Paykel Healthcare, Flexicare Group Ltd., GE HealthCare Technologies, Getinge AB, ICU Medical Inc., Intersurgical Ltd., Koninklijke Philips NV, Masimo Corp., Medtronic Plc, Mercury Medical, Nihon Kohden Corp., O Two Medical Technologies Inc., Penlon Ltd., Shenzhen Mindray Co. Ltd., Siare Engineering International, Teleflex Inc. and VBM Medizintechnik GmbH

Market Research Insights

  • The Anesthesia Devices Market 2026-2030 is advancing rapidly as modern clinical networks prioritize workflow integration and patient safety. Healthcare systems are deploying cloud-based telemetry hubs and target-controlled delivery architectures to manage high-acuity surgical cases effectively. By automating critical life-support systems and implementing strict environmental sustainability directives, facilities have achieved a 24% reduction in total anesthetic waste.
  • Furthermore, upgrading to interconnected monitoring platforms has lowered intraoperative awareness prevention errors by 18%, directly improving surgical throughput efficiency. This technological pivot ensures that fast-track recovery protocols meet rigorous compliance standards, fundamentally reducing post-operative complications and establishing a highly optimized perioperative environment for all patients.

We can help! Our analysts can customize this anesthesia devices market research report to meet your requirements.

Get in touch

1. Executive Summary

1.1 Market overview

Executive Summary - Chart on Market Overview
Executive Summary - Data Table on Market Overview
Executive Summary - Chart on Global Market Characteristics
Executive Summary - Chart on Market by Geography
Executive Summary - Chart on Market Segmentation by Product
Executive Summary - Chart on Market Segmentation by End-user
Executive Summary - Chart on Market Segmentation by Application
Executive Summary - Chart on Incremental Growth
Executive Summary - Data Table on Incremental Growth
Executive Summary - Chart on Company Market Positioning

2. Technavio Analysis

2.1 Analysis of price sensitivity, lifecycle, customer purchase basket, adoption rates, and purchase criteria

2.2 Criticality of inputs and Factors of differentiation

Chart on Overview on criticality of inputs and factors of differentiation

2.3 Factors of disruption

Chart on Overview on factors of disruption

2.4 Impact of drivers and challenges

Chart on Impact of drivers and challenges in 2025 and 2030

3. Market Landscape

3.1 Market ecosystem

Chart on Parent Market
Data Table on - Parent Market

3.2 Market characteristics

Chart on Market characteristics analysis

3.3 Value chain analysis

Chart on Value chain analysis

4. Market Sizing

4.1 Market definition

Data Table on Offerings of companies included in the market definition

4.2 Market segment analysis

Market segments

4.3 Market size 2025

4.4 Market outlook: Forecast for 2025-2030

Chart on Global - Market size and forecast 2025-2030 ($ million)
Data Table on Global - Market size and forecast 2025-2030 ($ million)
Chart on Global Market: Year-over-year growth 2025-2030 (%)
Data Table on Global Market: Year-over-year growth 2025-2030 (%)

5. Historic Market Size

5.1 Global Anesthesia Devices Market 2020 - 2024

Historic Market Size - Data Table on Global Anesthesia Devices Market 2020 - 2024 ($ million)

5.2 Product segment analysis 2020 - 2024

Historic Market Size - Product Segment 2020 - 2024 ($ million)

5.3 End-user segment analysis 2020 - 2024

Historic Market Size - End-user Segment 2020 - 2024 ($ million)

5.4 Application segment analysis 2020 - 2024

Historic Market Size - Application Segment 2020 - 2024 ($ million)

5.5 Geography segment analysis 2020 - 2024

Historic Market Size - Geography Segment 2020 - 2024 ($ million)

5.6 Country segment analysis 2020 - 2024

Historic Market Size - Country Segment 2020 - 2024 ($ million)

6. Qualitative Analysis

6.1 Impact of AI on Global Anesthesia Devices Market

6.2 Impact of geopolitical conflicts on Global Anesthesia Devices Market

7. Five Forces Analysis

7.1 Five forces summary

Five forces analysis - Comparison between 2025 and 2030

7.2 Bargaining power of buyers

Bargaining power of buyers - Impact of key factors 2025 and 2030

7.3 Bargaining power of suppliers

Bargaining power of suppliers - Impact of key factors in 2025 and 2030

7.4 Threat of new entrants

Threat of new entrants - Impact of key factors in 2025 and 2030

7.5 Threat of substitutes

Threat of substitutes - Impact of key factors in 2025 and 2030

7.6 Threat of rivalry

Threat of rivalry - Impact of key factors in 2025 and 2030

7.7 Market condition

Chart on Market condition - Five forces 2025 and 2030

8. Market Segmentation by Product

8.1 Market segments

Chart on Product - Market share 2025-2030 (%)
Data Table on Product - Market share 2025-2030 (%)

8.2 Comparison by Product

Chart on Comparison by Product
Data Table on Comparison by Product

8.3 Anesthesia delivery machines - Market size and forecast 2025-2030

Chart on Anesthesia delivery machines - Market size and forecast 2025-2030 ($ million)
Data Table on Anesthesia delivery machines - Market size and forecast 2025-2030 ($ million)
Chart on Anesthesia delivery machines - Year-over-year growth 2025-2030 (%)
Data Table on Anesthesia delivery machines - Year-over-year growth 2025-2030 (%)

8.4 Anesthesia monitors - Market size and forecast 2025-2030

Chart on Anesthesia monitors - Market size and forecast 2025-2030 ($ million)
Data Table on Anesthesia monitors - Market size and forecast 2025-2030 ($ million)
Chart on Anesthesia monitors - Year-over-year growth 2025-2030 (%)
Data Table on Anesthesia monitors - Year-over-year growth 2025-2030 (%)

8.5 Anesthesia vaporizers - Market size and forecast 2025-2030

Chart on Anesthesia vaporizers - Market size and forecast 2025-2030 ($ million)
Data Table on Anesthesia vaporizers - Market size and forecast 2025-2030 ($ million)
Chart on Anesthesia vaporizers - Year-over-year growth 2025-2030 (%)
Data Table on Anesthesia vaporizers - Year-over-year growth 2025-2030 (%)

8.6 Anesthesia disposables - Market size and forecast 2025-2030

Chart on Anesthesia disposables - Market size and forecast 2025-2030 ($ million)
Data Table on Anesthesia disposables - Market size and forecast 2025-2030 ($ million)
Chart on Anesthesia disposables - Year-over-year growth 2025-2030 (%)
Data Table on Anesthesia disposables - Year-over-year growth 2025-2030 (%)

8.7 Market opportunity by Product

Market opportunity by Product ($ million)
Data Table on Market opportunity by Product ($ million)

9. Market Segmentation by End-user

9.1 Market segments

Chart on End-user - Market share 2025-2030 (%)
Data Table on End-user - Market share 2025-2030 (%)

9.2 Comparison by End-user

Chart on Comparison by End-user
Data Table on Comparison by End-user

9.3 Hospitals - Market size and forecast 2025-2030

Chart on Hospitals - Market size and forecast 2025-2030 ($ million)
Data Table on Hospitals - Market size and forecast 2025-2030 ($ million)
Chart on Hospitals - Year-over-year growth 2025-2030 (%)
Data Table on Hospitals - Year-over-year growth 2025-2030 (%)

9.4 Ambulatory service centers - Market size and forecast 2025-2030

Chart on Ambulatory service centers - Market size and forecast 2025-2030 ($ million)
Data Table on Ambulatory service centers - Market size and forecast 2025-2030 ($ million)
Chart on Ambulatory service centers - Year-over-year growth 2025-2030 (%)
Data Table on Ambulatory service centers - Year-over-year growth 2025-2030 (%)

9.5 Clinics - Market size and forecast 2025-2030

Chart on Clinics - Market size and forecast 2025-2030 ($ million)
Data Table on Clinics - Market size and forecast 2025-2030 ($ million)
Chart on Clinics - Year-over-year growth 2025-2030 (%)
Data Table on Clinics - Year-over-year growth 2025-2030 (%)

9.6 Market opportunity by End-user

Market opportunity by End-user ($ million)
Data Table on Market opportunity by End-user ($ million)

10. Market Segmentation by Application

10.1 Market segments

Chart on Application - Market share 2025-2030 (%)
Data Table on Application - Market share 2025-2030 (%)

10.2 Comparison by Application

Chart on Comparison by Application
Data Table on Comparison by Application

10.3 Cardiology - Market size and forecast 2025-2030

Chart on Cardiology - Market size and forecast 2025-2030 ($ million)
Data Table on Cardiology - Market size and forecast 2025-2030 ($ million)
Chart on Cardiology - Year-over-year growth 2025-2030 (%)
Data Table on Cardiology - Year-over-year growth 2025-2030 (%)

10.4 Orthopedics - Market size and forecast 2025-2030

Chart on Orthopedics - Market size and forecast 2025-2030 ($ million)
Data Table on Orthopedics - Market size and forecast 2025-2030 ($ million)
Chart on Orthopedics - Year-over-year growth 2025-2030 (%)
Data Table on Orthopedics - Year-over-year growth 2025-2030 (%)

10.5 Neurology - Market size and forecast 2025-2030

Chart on Neurology - Market size and forecast 2025-2030 ($ million)
Data Table on Neurology - Market size and forecast 2025-2030 ($ million)
Chart on Neurology - Year-over-year growth 2025-2030 (%)
Data Table on Neurology - Year-over-year growth 2025-2030 (%)

10.6 Urology - Market size and forecast 2025-2030

Chart on Urology - Market size and forecast 2025-2030 ($ million)
Data Table on Urology - Market size and forecast 2025-2030 ($ million)
Chart on Urology - Year-over-year growth 2025-2030 (%)
Data Table on Urology - Year-over-year growth 2025-2030 (%)

10.7 Others - Market size and forecast 2025-2030

Chart on Others - Market size and forecast 2025-2030 ($ million)
Data Table on Others - Market size and forecast 2025-2030 ($ million)
Chart on Others - Year-over-year growth 2025-2030 (%)
Data Table on Others - Year-over-year growth 2025-2030 (%)

10.8 Market opportunity by Application

Market opportunity by Application ($ million)
Data Table on Market opportunity by Application ($ million)

11. Customer Landscape

11.1 Customer landscape overview

Analysis of price sensitivity, lifecycle, customer purchase basket, adoption rates, and purchase criteria

12. Geographic Landscape

12.1 Geographic segmentation

Chart on Market share by geography 2025-2030 (%)
Data Table on Market share by geography 2025-2030 (%)

12.2 Geographic comparison

Chart on Geographic comparison
Data Table on Geographic comparison

12.3 North America - Market size and forecast 2025-2030

Chart on North America - Market size and forecast 2025-2030 ($ million)
Data Table on North America - Market size and forecast 2025-2030 ($ million)
Chart on North America - Year-over-year growth 2025-2030 (%)
Data Table on North America - Year-over-year growth 2025-2030 (%)
Chart on Regional Comparison - North America
Data Table on Regional Comparison - North America

12.3.1 US - Market size and forecast 2025-2030

Chart on US - Market size and forecast 2025-2030 ($ million)
Data Table on US - Market size and forecast 2025-2030 ($ million)
Chart on US - Year-over-year growth 2025-2030 (%)
Data Table on US - Year-over-year growth 2025-2030 (%)

12.3.2 Canada - Market size and forecast 2025-2030

Chart on Canada - Market size and forecast 2025-2030 ($ million)
Data Table on Canada - Market size and forecast 2025-2030 ($ million)
Chart on Canada - Year-over-year growth 2025-2030 (%)
Data Table on Canada - Year-over-year growth 2025-2030 (%)

12.3.3 Mexico - Market size and forecast 2025-2030

Chart on Mexico - Market size and forecast 2025-2030 ($ million)
Data Table on Mexico - Market size and forecast 2025-2030 ($ million)
Chart on Mexico - Year-over-year growth 2025-2030 (%)
Data Table on Mexico - Year-over-year growth 2025-2030 (%)

12.4 Europe - Market size and forecast 2025-2030

Chart on Europe - Market size and forecast 2025-2030 ($ million)
Data Table on Europe - Market size and forecast 2025-2030 ($ million)
Chart on Europe - Year-over-year growth 2025-2030 (%)
Data Table on Europe - Year-over-year growth 2025-2030 (%)
Chart on Regional Comparison - Europe
Data Table on Regional Comparison - Europe

12.4.1 Germany - Market size and forecast 2025-2030

Chart on Germany - Market size and forecast 2025-2030 ($ million)
Data Table on Germany - Market size and forecast 2025-2030 ($ million)
Chart on Germany - Year-over-year growth 2025-2030 (%)
Data Table on Germany - Year-over-year growth 2025-2030 (%)

12.4.2 UK - Market size and forecast 2025-2030

Chart on UK - Market size and forecast 2025-2030 ($ million)
Data Table on UK - Market size and forecast 2025-2030 ($ million)
Chart on UK - Year-over-year growth 2025-2030 (%)
Data Table on UK - Year-over-year growth 2025-2030 (%)

12.4.3 France - Market size and forecast 2025-2030

Chart on France - Market size and forecast 2025-2030 ($ million)
Data Table on France - Market size and forecast 2025-2030 ($ million)
Chart on France - Year-over-year growth 2025-2030 (%)
Data Table on France - Year-over-year growth 2025-2030 (%)

12.4.4 Italy - Market size and forecast 2025-2030

Chart on Italy - Market size and forecast 2025-2030 ($ million)
Data Table on Italy - Market size and forecast 2025-2030 ($ million)
Chart on Italy - Year-over-year growth 2025-2030 (%)
Data Table on Italy - Year-over-year growth 2025-2030 (%)

12.4.5 Spain - Market size and forecast 2025-2030

Chart on Spain - Market size and forecast 2025-2030 ($ million)
Data Table on Spain - Market size and forecast 2025-2030 ($ million)
Chart on Spain - Year-over-year growth 2025-2030 (%)
Data Table on Spain - Year-over-year growth 2025-2030 (%)

12.4.6 The Netherlands - Market size and forecast 2025-2030

Chart on The Netherlands - Market size and forecast 2025-2030 ($ million)
Data Table on The Netherlands - Market size and forecast 2025-2030 ($ million)
Chart on The Netherlands - Year-over-year growth 2025-2030 (%)
Data Table on The Netherlands - Year-over-year growth 2025-2030 (%)

12.5 Asia - Market size and forecast 2025-2030

Chart on Asia - Market size and forecast 2025-2030 ($ million)
Data Table on Asia - Market size and forecast 2025-2030 ($ million)
Chart on Asia - Year-over-year growth 2025-2030 (%)
Data Table on Asia - Year-over-year growth 2025-2030 (%)
Chart on Regional Comparison - Asia
Data Table on Regional Comparison - Asia

12.5.1 China - Market size and forecast 2025-2030

Chart on China - Market size and forecast 2025-2030 ($ million)
Data Table on China - Market size and forecast 2025-2030 ($ million)
Chart on China - Year-over-year growth 2025-2030 (%)
Data Table on China - Year-over-year growth 2025-2030 (%)

12.5.2 India - Market size and forecast 2025-2030

Chart on India - Market size and forecast 2025-2030 ($ million)
Data Table on India - Market size and forecast 2025-2030 ($ million)
Chart on India - Year-over-year growth 2025-2030 (%)
Data Table on India - Year-over-year growth 2025-2030 (%)

12.5.3 Japan - Market size and forecast 2025-2030

Chart on Japan - Market size and forecast 2025-2030 ($ million)
Data Table on Japan - Market size and forecast 2025-2030 ($ million)
Chart on Japan - Year-over-year growth 2025-2030 (%)
Data Table on Japan - Year-over-year growth 2025-2030 (%)

12.5.4 South Korea - Market size and forecast 2025-2030

Chart on South Korea - Market size and forecast 2025-2030 ($ million)
Data Table on South Korea - Market size and forecast 2025-2030 ($ million)
Chart on South Korea - Year-over-year growth 2025-2030 (%)
Data Table on South Korea - Year-over-year growth 2025-2030 (%)

12.5.5 Thailand - Market size and forecast 2025-2030

Chart on Thailand - Market size and forecast 2025-2030 ($ million)
Data Table on Thailand - Market size and forecast 2025-2030 ($ million)
Chart on Thailand - Year-over-year growth 2025-2030 (%)
Data Table on Thailand - Year-over-year growth 2025-2030 (%)

12.5.6 Indonesia - Market size and forecast 2025-2030

Chart on Indonesia - Market size and forecast 2025-2030 ($ million)
Data Table on Indonesia - Market size and forecast 2025-2030 ($ million)
Chart on Indonesia - Year-over-year growth 2025-2030 (%)
Data Table on Indonesia - Year-over-year growth 2025-2030 (%)

12.6 Rest of World (ROW) - Market size and forecast 2025-2030

Chart on Rest of World (ROW) - Market size and forecast 2025-2030 ($ million)
Data Table on Rest of World (ROW) - Market size and forecast 2025-2030 ($ million)
Chart on Rest of World (ROW) - Year-over-year growth 2025-2030 (%)
Data Table on Rest of World (ROW) - Year-over-year growth 2025-2030 (%)
Chart on Regional Comparison - Rest of World (ROW)
Data Table on Regional Comparison - Rest of World (ROW)

12.6.1 Brazil - Market size and forecast 2025-2030

Chart on Brazil - Market size and forecast 2025-2030 ($ million)
Data Table on Brazil - Market size and forecast 2025-2030 ($ million)
Chart on Brazil - Year-over-year growth 2025-2030 (%)
Data Table on Brazil - Year-over-year growth 2025-2030 (%)

12.6.2 Saudi Arabia - Market size and forecast 2025-2030

Chart on Saudi Arabia - Market size and forecast 2025-2030 ($ million)
Data Table on Saudi Arabia - Market size and forecast 2025-2030 ($ million)
Chart on Saudi Arabia - Year-over-year growth 2025-2030 (%)
Data Table on Saudi Arabia - Year-over-year growth 2025-2030 (%)

12.6.3 UAE - Market size and forecast 2025-2030

Chart on UAE - Market size and forecast 2025-2030 ($ million)
Data Table on UAE - Market size and forecast 2025-2030 ($ million)
Chart on UAE - Year-over-year growth 2025-2030 (%)
Data Table on UAE - Year-over-year growth 2025-2030 (%)

12.6.4 South Africa - Market size and forecast 2025-2030

Chart on South Africa - Market size and forecast 2025-2030 ($ million)
Data Table on South Africa - Market size and forecast 2025-2030 ($ million)
Chart on South Africa - Year-over-year growth 2025-2030 (%)
Data Table on South Africa - Year-over-year growth 2025-2030 (%)

12.6.5 Israel - Market size and forecast 2025-2030

Chart on Israel - Market size and forecast 2025-2030 ($ million)
Data Table on Israel - Market size and forecast 2025-2030 ($ million)
Chart on Israel - Year-over-year growth 2025-2030 (%)
Data Table on Israel - Year-over-year growth 2025-2030 (%)

12.6.6 Argentina - Market size and forecast 2025-2030

Chart on Argentina - Market size and forecast 2025-2030 ($ million)
Data Table on Argentina - Market size and forecast 2025-2030 ($ million)
Chart on Argentina - Year-over-year growth 2025-2030 (%)
Data Table on Argentina - Year-over-year growth 2025-2030 (%)

12.6.7 Colombia - Market size and forecast 2025-2030

Chart on Colombia - Market size and forecast 2025-2030 ($ million)
Data Table on Colombia - Market size and forecast 2025-2030 ($ million)
Chart on Colombia - Year-over-year growth 2025-2030 (%)
Data Table on Colombia - Year-over-year growth 2025-2030 (%)

12.6.8 Turkey - Market size and forecast 2025-2030

Chart on Turkey - Market size and forecast 2025-2030 ($ million)
Data Table on Turkey - Market size and forecast 2025-2030 ($ million)
Chart on Turkey - Year-over-year growth 2025-2030 (%)
Data Table on Turkey - Year-over-year growth 2025-2030 (%)

12.7 Market opportunity by geography

Market opportunity by geography ($ million)
Data Tables on Market opportunity by geography ($ million)

13. Drivers, Challenges, and Opportunity

13.1 Market drivers

Surge in surgical volumes and geriatric demographic shifts drive demand
Expansion of ambulatory surgical centers and outpatient procedures
Rising demand for target-controlled infusion and total intravenous anesthesia

13.2 Market challenges

Technological complexity and cost workstations
Strict environmental mandates and volatile gas regulations
Cybersecurity vulnerabilities and system integration barriers

13.3 Impact of drivers and challenges

Impact of drivers and challenges in 2025 and 2030

13.4 Market opportunities

Demand for mobile and field-deployable delivery systems
Surge in advanced hemodynamic and telemetry integration
Adoption of ergonomic and high-resolution video airways

14. Competitive Landscape

14.1 Overview

14.2

Overview on criticality of inputs and factors of differentiation

14.3 Landscape disruption

Overview on factors of disruption

14.4 Industry risks

Impact of key risks on business

15. Competitive Analysis

15.1 Companies profiled

Companies covered

15.2 Company ranking index

15.3 Market positioning of companies

Matrix on companies position and classification

15.4 Ambu AS

Ambu AS - Overview
Ambu AS - Business segments
Ambu AS - Key offerings
Ambu AS - Segment focus
SWOT

15.5 B.Braun SE

B.Braun SE - Overview
B.Braun SE - Product / Service
B.Braun SE - Key offerings
SWOT

15.6 Dragerwerk AG and Co. KGaA

Dragerwerk AG and Co. KGaA - Overview
Dragerwerk AG and Co. KGaA - Business segments
Dragerwerk AG and Co. KGaA - Key offerings
Dragerwerk AG and Co. KGaA - Segment focus
SWOT

15.7 Fisher and Paykel Healthcare

Fisher and Paykel Healthcare - Overview
Fisher and Paykel Healthcare - Product / Service
Fisher and Paykel Healthcare - Key offerings
SWOT

15.8 GE HealthCare Technologies

GE HealthCare Technologies - Overview
GE HealthCare Technologies - Business segments
GE HealthCare Technologies - Key news
GE HealthCare Technologies - Key offerings
GE HealthCare Technologies - Segment focus
SWOT

15.9 Getinge AB

Getinge AB - Overview
Getinge AB - Business segments
Getinge AB - Key offerings
Getinge AB - Segment focus
SWOT

15.10 ICU Medical Inc.

ICU Medical Inc. - Overview
ICU Medical Inc. - Product / Service
ICU Medical Inc. - Key offerings
SWOT

15.11 Koninklijke Philips NV

Koninklijke Philips NV - Overview
Koninklijke Philips NV - Business segments
Koninklijke Philips NV - Key news
Koninklijke Philips NV - Key offerings
Koninklijke Philips NV - Segment focus
SWOT

15.12 Masimo Corp.

Masimo Corp. - Overview
Masimo Corp. - Product / Service
Masimo Corp. - Key offerings
SWOT

15.13 Medtronic Plc

Medtronic Plc - Overview
Medtronic Plc - Business segments
Medtronic Plc - Key news
Medtronic Plc - Key offerings
Medtronic Plc - Segment focus
SWOT

15.14 Nihon Kohden Corp.

Nihon Kohden Corp. - Overview
Nihon Kohden Corp. - Business segments
Nihon Kohden Corp. - Key offerings
Nihon Kohden Corp. - Segment focus
SWOT

15.15 Penlon Ltd.

Penlon Ltd. - Overview
Penlon Ltd. - Product / Service
Penlon Ltd. - Key offerings
SWOT

15.16 Shenzhen Mindray Co. Ltd.

Shenzhen Mindray Co. Ltd. - Overview
Shenzhen Mindray Co. Ltd. - Business segments
Shenzhen Mindray Co. Ltd. - Key offerings
Shenzhen Mindray Co. Ltd. - Segment focus
SWOT

15.17 Teleflex Inc.

Teleflex Inc. - Overview
Teleflex Inc. - Business segments
Teleflex Inc. - Key news
Teleflex Inc. - Key offerings
Teleflex Inc. - Segment focus
SWOT

15.18 VBM Medizintechnik GmbH

VBM Medizintechnik GmbH - Overview
VBM Medizintechnik GmbH - Product / Service
VBM Medizintechnik GmbH - Key offerings
SWOT

16. Appendix

16.1 Scope of the report

Market definition
Objectives
Notes and caveats

16.2 Inclusions and exclusions checklist

Inclusions checklist
Exclusions checklist

16.3 Currency conversion rates for US$

16.4 Research methodology

16.5 Data procurement

Information sources

16.6 Data validation

16.7 Validation techniques employed for market sizing

16.8 Data synthesis

16.9 360 degree market analysis

16.10 List of abbreviations

Research Methodology

Technavio presents a detailed picture of the market by way of study, synthesis, and summation of data from multiple sources. The analysts have presented the various facets of the market with a particular focus on identifying the key industry influencers. The data thus presented is comprehensive, reliable, and the result of extensive research, both primary and secondary.

INFORMATION SOURCES

Primary sources

  • Manufacturers and suppliers
  • Channel partners
  • Industry experts
  • Strategic decision makers

Secondary sources

  • Industry journals and periodicals
  • Government data
  • Financial reports of key industry players
  • Historical data
  • Press releases

DATA ANALYSIS

Data Synthesis

  • Collation of data
  • Estimation of key figures
  • Analysis of derived insights

Data Validation

  • Triangulation with data models
  • Reference against proprietary databases
  • Corroboration with industry experts

REPORT WRITING

Qualitative

  • Market drivers
  • Market challenges
  • Market trends
  • Five forces analysis

Quantitative

  • Market size and forecast
  • Market segmentation
  • Geographical insights
  • Competitive landscape

Interested in this report?

Get your sample now to see our research methodology and insights!

Download Now

Frequently Asked Questions

Anesthesia Devices market growth will increase by USD 5013.1 million during 2026-2030.

The Anesthesia Devices market is expected to grow at a CAGR of 11.9% during 2026-2030.

Anesthesia Devices market is segmented by Product (Anesthesia delivery machines, Anesthesia monitors, Anesthesia vaporizers, Anesthesia disposables) End-user (Hospitals, Ambulatory service centers, Clinics) Application (Cardiology, Orthopedics, Neurology, Urology, Others)

Ambu AS, B.Braun SE, Besmed Health Business Corp., Comen Medical Instruments, Dragerwerk AG and Co. KGaA, Fisher and Paykel Healthcare, Flexicare Group Ltd., GE HealthCare Technologies, Getinge AB, ICU Medical Inc., Intersurgical Ltd., Koninklijke Philips NV, Masimo Corp., Medtronic Plc, Mercury Medical, Nihon Kohden Corp., O Two Medical Technologies Inc., Penlon Ltd., Shenzhen Mindray Co. Ltd., Siare Engineering International, Teleflex Inc., VBM Medizintechnik GmbH are a few of the key vendors in the Anesthesia Devices market.

North America will register the highest growth rate of 40.6% among the other regions. Therefore, the Anesthesia Devices market in North America is expected to garner significant business opportunities for the vendors during the forecast period.

US, Canada, Mexico, Germany, UK, France, Italy, Spain, The Netherlands, China, India, Japan, South Korea, Thailand, Indonesia, Brazil, Saudi Arabia, UAE, South Africa, Israel, Argentina, Colombia, Turkey

  • Surge in surgical volumes and geriatric demographic shifts drive demand is the driving factor this market.

The Anesthesia Devices market vendors should focus on grabbing business opportunities from the Product segment as it accounted for the largest market share in the base year.
RIA - Research AI Assistant
Ask RIA
