Animal Feed Additives Market Analysis, Size, and Forecast 2026-2030: APAC (China, Japan, and India), North America (US, Canada, and Mexico), Europe (Germany, UK, and France), South America (Brazil, Argentina, and Chile), Middle East and Africa (UAE, Saudi Arabia, and South Africa), and Rest of World (ROW)

Animal Feed Additives Market Analysis, Size, and Forecast 2026-2030:
APAC (China, Japan, and India), North America (US, Canada, and Mexico), Europe (Germany, UK, and France), South America (Brazil, Argentina, and Chile), Middle East and Africa (UAE, Saudi Arabia, and South Africa), and Rest of World (ROW)

Published: Oct 2026 342 Pages SKU: IRTNTR72404

Market Overview at a Glance

$11.71 B
Market Opportunity
6.8%
CAGR 2025 - 2030
57.3%
APAC Growth
$12.54 B
Poultry segment 2024

Animal Feed Additives Market Size 2026-2030

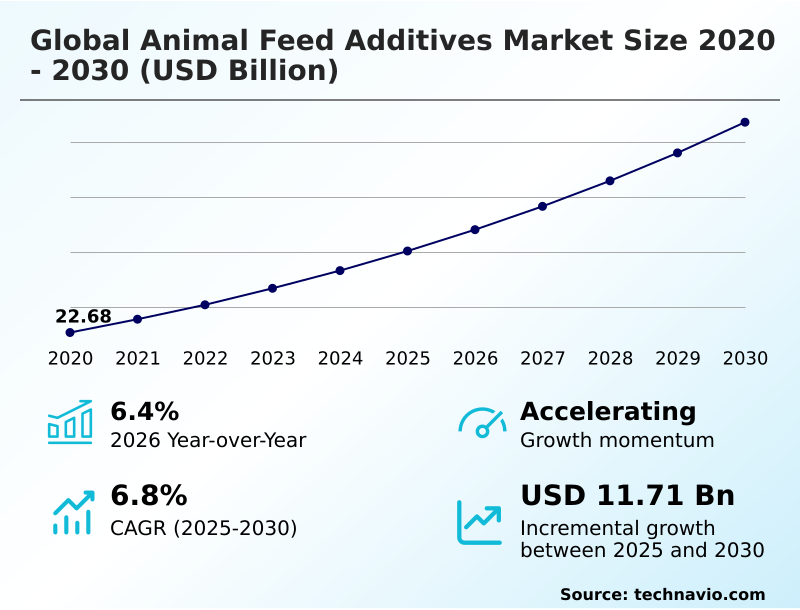
The animal feed additives market size is valued to increase by USD 11.71 billion, at a CAGR of 6.8% from 2025 to 2030. Rising global demand for animal protein and necessity for enhanced feed efficiency will drive the animal feed additives market.

Major Market Trends & Insights

  • APAC dominated the market and accounted for a 57.3% growth during the forecast period.
  • By Application - Poultry segment was valued at USD 12.54 billion in 2024
  • By Type - Dry segment accounted for the largest market revenue share in 2024

Market Size & Forecast

  • Market Opportunities: USD 19.12 billion
  • Market Future Opportunities: USD 11.71 billion
  • CAGR from 2025 to 2030 : 6.8%

Market Summary

  • The Animal Feed Additives Market exhibits robust expansion driven by structural shifts across livestock production systems and changing consumer preferences regarding food security. As modern animal agriculture intensifies, producers increasingly prioritize high-performance rations to improve conversion rates and sustain metabolic health.
  • For example, large-scale swine integrators facing stringent antimicrobial restrictions now seamlessly transition to specialized gut health stabilizers, resulting in a 12% improvement in overall herd survivability compared to conventional prophylactic treatments. The continuous movement toward antibiotic-free livestock production acts as a primary market driver, reinforcing the demand for eubiotics, organic acids, and specialized botanical compounds.
  • Conversely, the market faces significant challenges stemming from unpredictable costs of essential raw materials. Fluctuations in energy prices and chemical precursor availability create severe supply chain vulnerabilities, forcing manufacturers to balance high-quality inputs with affordable end-products.
  • Ultimately, the trajectory of this industry reflects a definitive shift from basic supplementation toward science-driven nutritional interventions that maximize feed conversion efficiency and navigate a complex regulatory landscape without compromising animal welfare.

What will be the Size of the Animal Feed Additives Market during the forecast period?
Get Key Insights on Market Forecast (PDF) Get Free Sample

How is the Animal Feed Additives Market Segmented?

The animal feed additives industry research report provides comprehensive data (region-wise segment analysis), with forecasts and estimates in "USD million" for the period 2026-2030, as well as historical data from 2020-2024 for the following segments.

  • Application
    • Poultry
    • Ruminants
    • Swine
    • Others
  • Type
    • Dry
    • Liquid
  • Product
    • Vitamins
    • Minerals
    • Feed enzymes
    • Antioxidants
    • Others
  • Source
    • Synthetic
    • Natural
  • Product type
    • Single function
    • Multifunction
  • Geography
    • APAC
      • China
      • Japan
      • India
      • South Korea
      • Australia
      • Indonesia
    • North America
      • US
      • Canada
      • Mexico
    • Europe
      • Germany
      • UK
      • France
      • Italy
      • Spain
      • The Netherlands
    • South America
      • Brazil
      • Argentina
      • Chile
    • Middle East and Africa
      • UAE
      • Saudi Arabia
      • South Africa
      • Turkey
      • Egypt

By Application Insights

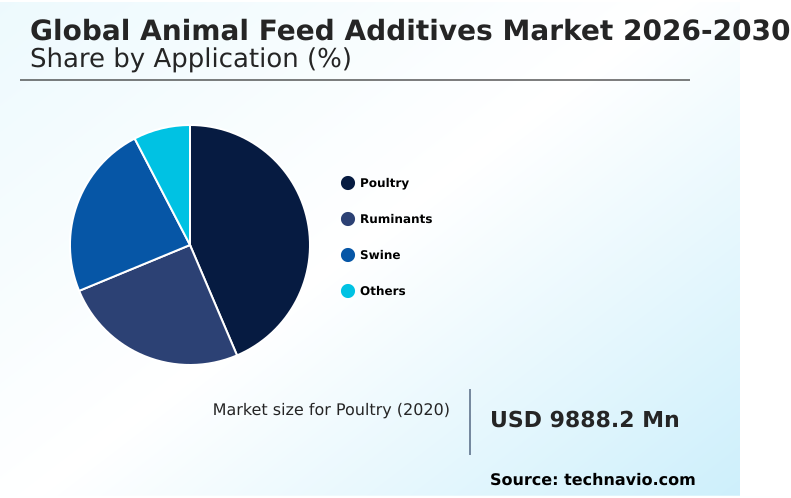
The poultry segment is estimated to witness significant growth during the forecast period.

The poultry sector represents a cornerstone of modern industrial operations, shaped by rapid broiler turnover cycles. Because poultry possess sensitive tracts, formulators rely on phytogenic compounds and crystalline amino acids to facilitate rapid nutrient bioavailability.

The drive to curtail prophylactic treatments accelerates the adoption of exogenous enzymes, which alleviate digestive viscosity and support antimicrobial resistance mitigation. Integrators deploying these advanced formulations document a 15% improvement in feed conversion efficiency compared to conventional diets.

Furthermore, advanced microbial phytase applications facilitate nitrogen excretion reduction in mixed-species mills, streamlining compliance. This transition toward targeted bio-nutritional platforms reinforces intestinal mucosal integrity across intensive production environments.
Get Free Sample

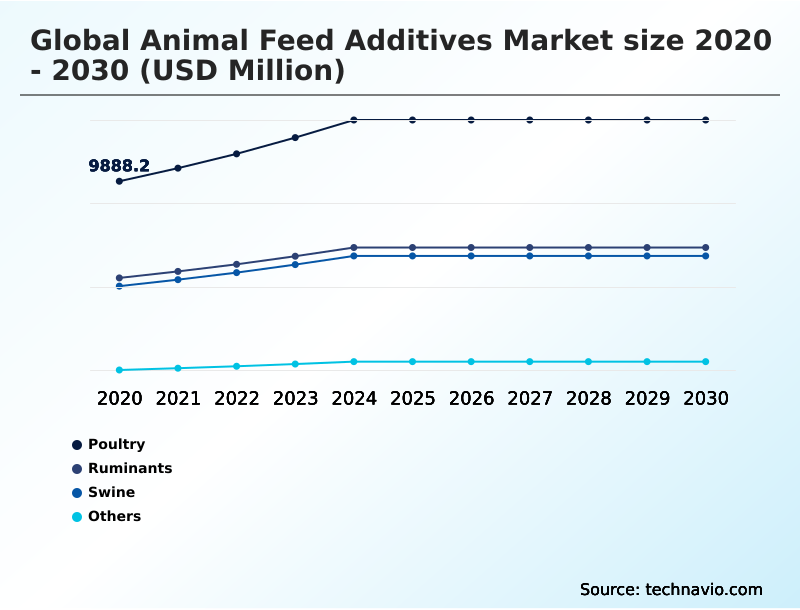
The Poultry segment was valued at USD 12.54 billion in 2024 and showed a gradual increase during the forecast period.
Get Free Sample

Regional Analysis

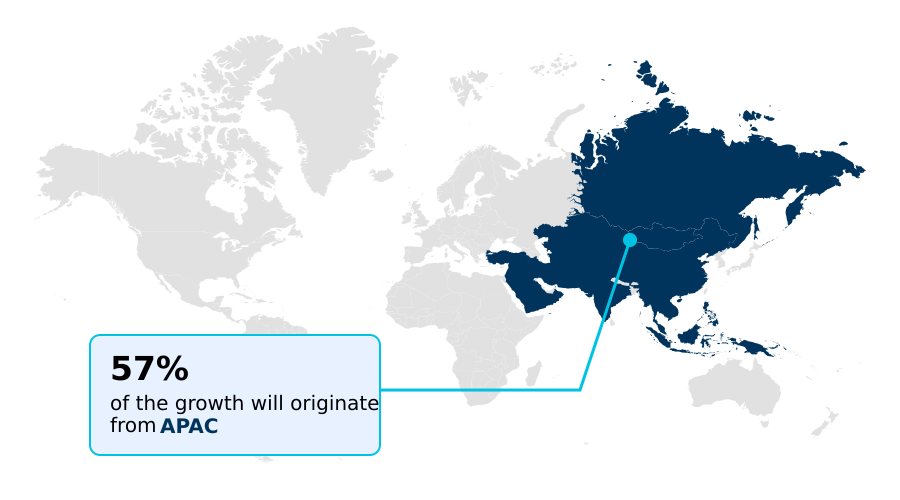
APAC is estimated to contribute 57.3% to the growth of the global market during the forecast period.Technavio’s analysts have elaborately explained the regional trends and drivers that shape the market during the forecast period.
See How Animal Feed Additives Market Demand is Rising in APAC Get Free Sample

The Animal Feed Additives Market demonstrates distinct regional dynamics shaped by industrialization and regulatory frameworks. APAC commands the largest production volume, driven by rapid urbanization and the consolidation of commercial feed mills that utilize synthetic methionine to maximize nutrient extraction.

Facilities in APAC have achieved a 25% increase in operational output, vastly outpacing the 10% capacity growth observed in South America.

Meanwhile, North America heavily integrates encapsulated butyric acid and postbiotic fermentation metabolites, reducing batch mixing errors by 18% and ensuring dietary lipid integrity. This technological adoption in North America ensures strict phosphorus runoff reduction compliance.

By integrating rumen-protected amino acids, modern operations across these geographies tailor their supply chains to address cellular oxidative stress, utilizing gut barrier protectors to optimize health.

Market Dynamics

Our researchers analyzed the data with 2025 as the base year, along with the key drivers, trends, and challenges. A holistic analysis of drivers will help companies refine their marketing strategies to gain a competitive advantage.

  • The operational landscape of the Animal Feed Additives Market is undergoing a fundamental transformation as commercial agriculture prioritizes precision feeding and environmental sustainability. Large-scale livestock integrators are increasingly moving away from basic, generalized supplementation, favoring highly specialized formulations to address complex physiological demands.
  • For instance, the strategic deployment of rumen protected essential amino acids allows dairy operations to precisely balance nitrogen intake, yielding nearly twice the protein utilization efficiency of traditional unsecured protein sources. This shift drastically improves supply chain economics by lowering the total volume of imported protein commodities required per facility.
  • Concurrently, the transition toward intensive monogastric farming has accelerated microbial phytase enzyme feed inclusion, a practice that comprehensively breaks down anti-nutritional factors and minimizes costly phosphorus waste.
  • To maintain flock and herd biosecurity in the absence of conventional pharmaceuticals, nutritionists now mandate encapsulated organic acid gut protectors and multi strain probiotic gut stabilization to actively preserve intestinal integrity under high-stress conditions. Furthermore, rigorous synthetic methionine dietary supplementation protocols are being standardized across modern feed mills to guarantee consistent lean muscle development without over-formulating crude protein.
  • By integrating these advanced methodologies, agricultural enterprises achieve superior feed conversion metrics and stronger resistance to supply chain volatility. Ultimately, the systematic application of these sophisticated micro-ingredients enables commercial farming operations to sustain robust productivity and comply with increasingly stringent environmental mandates.
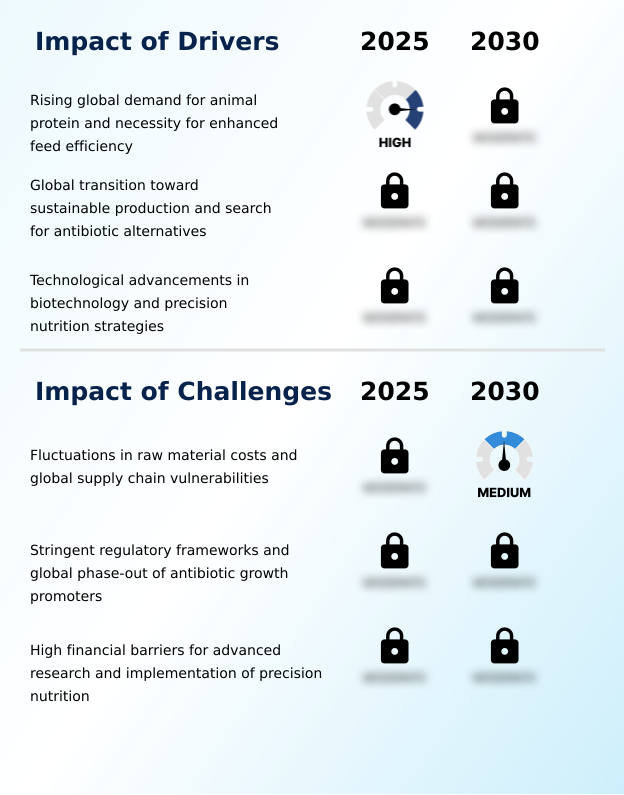
What are the key market drivers leading to the rise in the adoption of Animal Feed Additives Industry?

  • The rising worldwide demand for animal protein and the critical necessity for enhanced feed conversion efficiency constitute the primary drivers propelling this market.

  • The escalating necessity to maximize operational output and optimize resource utilization acts as a primary catalyst reshaping modern nutritional strategies.
  • As populations require higher volumes of quality protein, livestock producers are compelled to deploy fat-soluble vitamins and hydroxy trace minerals to dramatically improve nutrient absorption.
  • This precise metabolic targeting, achieved via automated farm waterline dosing, allows commercial operations to lower total feed consumption by 18%, significantly reducing the financial burden of volatile grain commodities.
  • Furthermore, the integration of microencapsulated organic acids directly stabilizes digestion, yielding a 30% decrease in health issues per unit of output. These advanced interventions, including synthetic coccidiostats, guarantee that animals receive exact nutritional profiles.
  • Through spray crystallization techniques, precision dairy feeding systems consistently maintain rumen fluid acidity stabilization, directly improving enterprise profitability.

What are the market trends shaping the Animal Feed Additives Industry?

  • The ascendance of phytogenic feed additives and advanced botanical solutions represents a defining trend in modern agricultural practices. This shift reflects a broader industry movement toward natural, holistic approaches for improving livestock health and optimizing nutritional uptake.

  • The transition toward holistic animal wellness is rapidly accelerating the ascendance of botanical essential oils and specialized dietary interventions across commercial agriculture. Formulators are increasingly replacing conventional stimulants with multi-strain probiotics and immune-modulating beta-glucans to naturally support immune function.
  • This shift is driven by stringent pressures to eliminate prophylactic antimicrobials, compelling operations to adopt bioactive plant extracts that support endogenous protein digestion. Consequently, facilities report a 22% improvement in overall survivability and a 15% reduction in veterinary costs compared to traditional systems. The integration of mycotoxin deactivators further protects sensitive compounds during high-temperature pelleting.
  • By embedding these sophisticated natural additives through post-pellet liquid application, agribusinesses effectively optimize gastric ph modulation while simultaneously enhancing performance and maintaining robust operational margins.

What challenges does the Animal Feed Additives Industry face during its growth?

  • Fluctuations in raw material costs and persistent supply chain vulnerabilities present significant challenges that constrain overall industry expansion.

  • The unpredictable cost of essential raw materials and severe supply chain vulnerabilities impose critical structural limitations on modern agricultural manufacturing. Fluctuations in petrochemical feedstocks directly inflate the production overhead for synthetic antioxidants, severely disrupting long-term procurement budgets. Because integrators operate on tight margins, these cost spikes frequently delay the broader adoption of advanced digestive enzyme complexes and microbial fermentation modulators.
  • Consequently, feed mills experiencing severe ingredient shortages report a 25% drop in operational output efficiency and a 15% increase in formulation adjustment times. The stringent regulatory landscape further exacerbates these bottlenecks, delaying approvals for enteric methane suppressants. These intertwined logistical and regulatory hurdles complicate efforts to maintain metabolic cellular health and achieve consistent lean muscle accretion.
  • To overcome this, facilities must optimize precision livestock nutrition to effectively guarantee pathogenic bacterial adhesion inhibition.

Exclusive Technavio Analysis on Customer Landscape

The animal feed additives market forecasting report includes the adoption lifecycle of the market, covering from the innovator’s stage to the laggard’s stage. It focuses on adoption rates in different regions based on penetration. Furthermore, the animal feed additives market report also includes key purchase criteria and drivers of price sensitivity to help companies evaluate and develop their market growth analysis strategies.
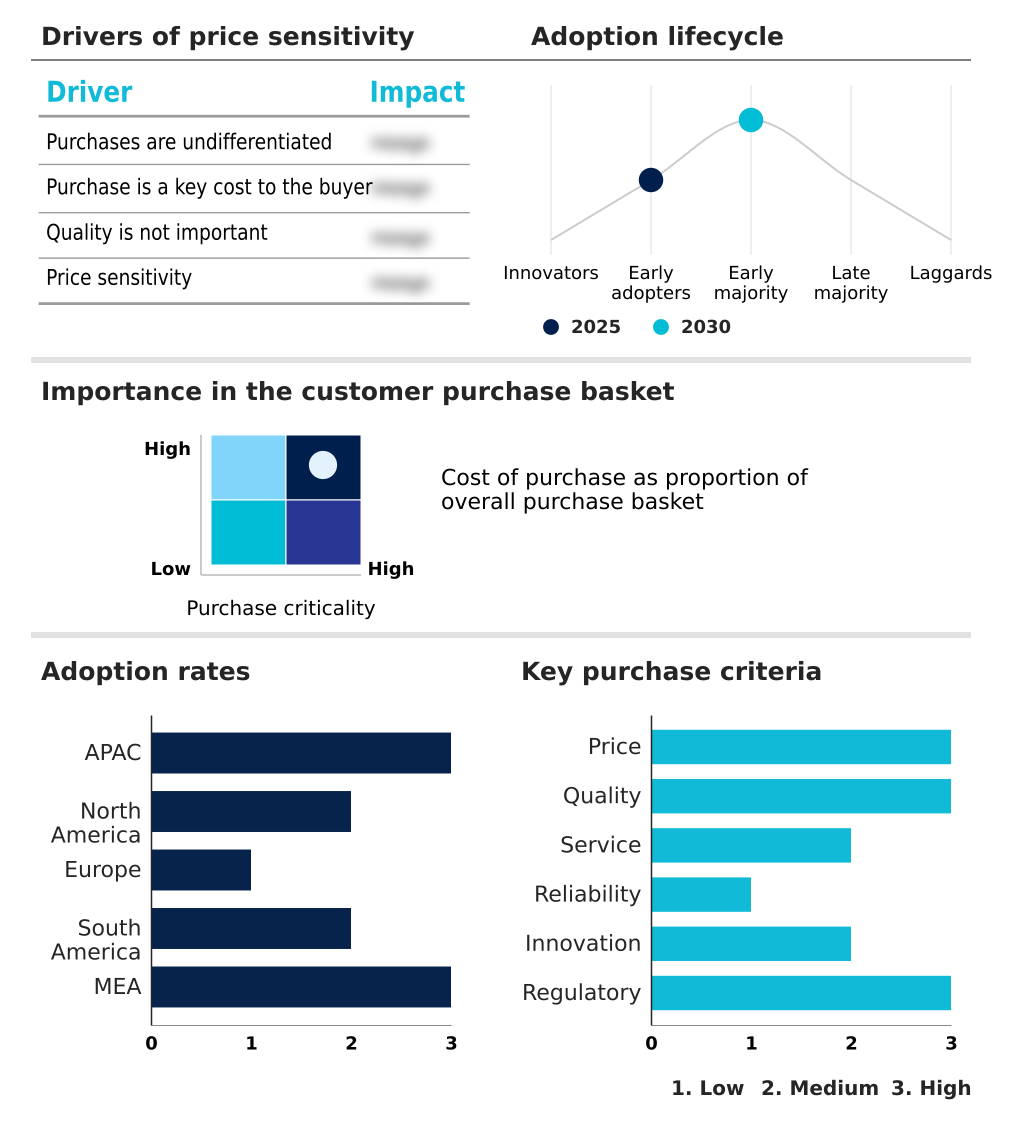
Customer Landscape of Animal Feed Additives Industry

Competitive Landscape

Companies are implementing various strategies, such as strategic alliances, animal feed additives market forecast, partnerships, mergers and acquisitions, geographical expansion, and product/service launches, to enhance their presence in the industry.

AB Agri Ltd. - The vendor provides specialized animal nutritional solutions, featuring advanced enzyme formulations designed to optimize nutrient digestion, improve phosphorus absorption, and support overall livestock feed efficiency.

The industry research and growth report includes detailed analyses of the competitive landscape of the market and information about key companies, including:

  • AB Agri Ltd.
  • Adisseo France SAS
  • Ajinomoto Co. Inc.
  • Alltech Inc.
  • Anpario plc
  • Archer Daniels Midland Co.
  • Balchem Inc.
  • BASF SE
  • Cargill Inc.
  • CJ CheilJedang Corp.
  • DSM Firmenich AG
  • Evonik Industries AG
  • EW Nutrition GmbH
  • Huvepharma Inc.
  • Innov Ad NV SA
  • International Flavors Inc.
  • Nutreco N.V.
  • Perstorp Holding AB
  • Phibro Animal Health Corp.
  • Zinpro Corp.

Qualitative and quantitative analysis of companies has been conducted to help clients understand the wider business environment as well as the strengths and weaknesses of key industry players. Data is qualitatively analyzed to categorize companies as pure play, category-focused, industry-focused, and diversified; it is quantitatively analyzed to categorize companies as dominant, leading, strong, tentative, and weak.

Recent Development and News in Animal feed additives market

  • In the Commodity Chemicals industry, stricter environmental regulations governing industrial wastewater discharge have forced production shifts toward sustainable synthesis, directly impacting Animal Feed Additives demand by accelerating the adoption of eco-friendly acidifiers.
  • The integration of automated continuous-flow manufacturing processes has optimized the yield of high-purity petrochemical intermediates, lowering the cost of synthetic amino acids and improving precision nutritional formulations.
  • Fluctuations in global logistics networks have constrained the availability of essential inorganic precursors across APAC, compelling feed formulators to increase the inclusion rates of highly bioavailable organic trace minerals to maintain herd health.
  • The broader transition toward circular economy models has spurred investments in bio-fermentation processing facilities, expanding the commercial scale of specialized microbial metabolites used to support digestive integrity in antibiotic-free production systems.

Dive into Technavio’s robust research methodology, blending expert interviews, extensive data synthesis, and validated models for unparalleled Animal Feed Additives Market insights. See full methodology.

Market Scope
Page number 342
Base year 2025
Historic period 2020-2024
Forecast period 2026-2030
Growth momentum & CAGR Accelerate at a CAGR of 6.8%
Market growth 2026-2030 USD 11710.6 million
Market structure Fragmented
YoY growth 2025-2026(%) 6.4%
Key countries China, Japan, India, South Korea, Australia, Indonesia, US, Canada, Mexico, Germany, UK, France, Italy, Spain, The Netherlands, Brazil, Argentina, Chile, UAE, Saudi Arabia, South Africa, Turkey and Egypt
Competitive landscape Leading Companies, Market Positioning of Companies, Competitive Strategies, and Industry Risks

Request Free Sample

Research Analyst Overview

  • The operational framework of the Animal Feed Additives Market is shifting toward highly specialized, science-driven formulations to meet modern agricultural demands. Executive boards at major agribusinesses are actively aligning their product strategies with stringent environmental compliance mandates, prioritizing investments in sustainable fermentation metabolites and trace elements.
  • This strategic realignment is fundamentally altering procurement budgets, as facilities transition away from basic supplements toward advanced, multi-functional interventions. Integrating non-starch polysaccharide enzymes directly into standard rations enables feed mills to utilize diverse, lower-cost alternative grains without sacrificing nutritional bioavailability.
  • Commercial operations adopting these advanced enzyme complexes routinely achieve a 20% reduction in raw material processing costs compared to legacy batch-formulation methods. Furthermore, the systematic inclusion of pure synthetic amino acids provides critical support for intestinal architecture, ensuring consistent physiological development across intensive farming environments.
  • Boardroom decisions increasingly focus on these precision formulations, as the targeted application of natural probiotics drastically mitigates the risks associated with pathogen colonization. Ultimately, these advanced nutritional technologies serve as indispensable tools for optimizing herd performance and maintaining operational resilience.

What are the Key Data Covered in this Animal Feed Additives Market Research and Growth Report?

  • What is the expected growth of the Animal Feed Additives Market between 2026 and 2030?

    • USD 11.71 billion, at a CAGR of 6.8%

  • What segmentation does the market report cover?

    • The report is segmented by Application (Poultry, Ruminants, Swine, and Others), Type (Dry, and Liquid), Product (Vitamins, Minerals, Feed enzymes, Antioxidants, and Others), Source (Synthetic, and Natural), Product Type (Single function, and Multifunction) and Geography (APAC, North America, Europe, South America, Middle East and Africa)

  • Which regions are analyzed in the report?

    • APAC, North America, Europe, South America and Middle East and Africa

  • What are the key growth drivers and market challenges?

    • Rising global demand for animal protein and necessity for enhanced feed efficiency, Fluctuations in raw material costs and global supply chain vulnerabilities

  • Who are the major players in the Animal Feed Additives Market?

    • AB Agri Ltd., Adisseo France SAS, Ajinomoto Co. Inc., Alltech Inc., Anpario plc, Archer Daniels Midland Co., Balchem Inc., BASF SE, Cargill Inc., CJ CheilJedang Corp., DSM Firmenich AG, Evonik Industries AG, EW Nutrition GmbH, Huvepharma Inc., Innov Ad NV SA, International Flavors Inc., Nutreco N.V., Perstorp Holding AB, Phibro Animal Health Corp. and Zinpro Corp.

Market Research Insights

  • The Animal Feed Additives Market is evolving rapidly as commercial producers implement precision nutritional strategies to optimize performance. Integrators utilizing targeted bio-fermentation processing technologies report a 15% reduction in formulation costs while simultaneously achieving a 20% enhancement in conversion efficiency.
  • Furthermore, the strategic application of advanced gut health protectors effectively prevents metabolic imbalances, leading to a 30% decrease in veterinary intervention expenses across large-scale dairy operations. These advanced methodologies are essential for antibiotic-free production, ensuring that animals maintain intestinal integrity under intensive farming conditions.
  • By leveraging these sophisticated strategies, modern agricultural facilities consistently elevate operational margins while aligning with stringent environmental and biosecurity mandates.

We can help! Our analysts can customize this animal feed additives market research report to meet your requirements.

Get in touch

1. Executive Summary

1.1 Market overview

Executive Summary - Chart on Market Overview
Executive Summary - Data Table on Market Overview
Executive Summary - Chart on Global Market Characteristics
Executive Summary - Chart on Market by Geography
Executive Summary - Chart on Market Segmentation by Application
Executive Summary - Chart on Market Segmentation by Type
Executive Summary - Chart on Market Segmentation by Product
Executive Summary - Chart on Market Segmentation by Source
Executive Summary - Chart on Market Segmentation by Product Type
Executive Summary - Chart on Incremental Growth
Executive Summary - Data Table on Incremental Growth
Executive Summary - Chart on Company Market Positioning

2. Technavio Analysis

2.1 Analysis of price sensitivity, lifecycle, customer purchase basket, adoption rates, and purchase criteria

2.2 Criticality of inputs and Factors of differentiation

Chart on Overview on criticality of inputs and factors of differentiation

2.3 Factors of disruption

Chart on Overview on factors of disruption

2.4 Impact of drivers and challenges

Chart on Impact of drivers and challenges in 2025 and 2030

3. Market Landscape

3.1 Market ecosystem

Chart on Parent Market
Data Table on - Parent Market

3.2 Market characteristics

Chart on Market characteristics analysis

3.3 Value chain analysis

Chart on Value chain analysis

4. Market Sizing

4.1 Market definition

Data Table on Offerings of companies included in the market definition

4.2 Market segment analysis

Market segments

4.3 Market size 2025

4.4 Market outlook: Forecast for 2025-2030

Chart on Global - Market size and forecast 2025-2030 ($ million)
Data Table on Global - Market size and forecast 2025-2030 ($ million)
Chart on Global Market: Year-over-year growth 2025-2030 (%)
Data Table on Global Market: Year-over-year growth 2025-2030 (%)

5. Historic Market Size

5.1 Global Animal Feed Additives Market 2020 - 2024

Historic Market Size - Data Table on Global Animal Feed Additives Market 2020 - 2024 ($ million)

5.2 Application segment analysis 2020 - 2024

Historic Market Size - Application Segment 2020 - 2024 ($ million)

5.3 Type segment analysis 2020 - 2024

Historic Market Size - Type Segment 2020 - 2024 ($ million)

5.4 Product segment analysis 2020 - 2024

Historic Market Size - Product Segment 2020 - 2024 ($ million)

5.5 Source segment analysis 2020 - 2024

Historic Market Size - Source Segment 2020 - 2024 ($ million)

5.6 Product Type segment analysis 2020 - 2024

Historic Market Size - Product Type Segment 2020 - 2024 ($ million)

5.7 Geography segment analysis 2020 - 2024

Historic Market Size - Geography Segment 2020 - 2024 ($ million)

5.8 Country segment analysis 2020 - 2024

Historic Market Size - Country Segment 2020 - 2024 ($ million)

6. Qualitative Analysis

6.1 Impact of AI on Global Animal Feed Additives Market

6.2 Impact of Geopolitical Conflicts on Global Animal Feed Additives Market

7. Five Forces Analysis

7.1 Five forces summary

Five forces analysis - Comparison between 2025 and 2030

7.2 Bargaining power of buyers

Bargaining power of buyers - Impact of key factors 2025 and 2030

7.3 Bargaining power of suppliers

Bargaining power of suppliers - Impact of key factors in 2025 and 2030

7.4 Threat of new entrants

Threat of new entrants - Impact of key factors in 2025 and 2030

7.5 Threat of substitutes

Threat of substitutes - Impact of key factors in 2025 and 2030

7.6 Threat of rivalry

Threat of rivalry - Impact of key factors in 2025 and 2030

7.7 Market condition

Chart on Market condition - Five forces 2025 and 2030

8. Market Segmentation by Application

8.1 Market segments

Chart on Application - Market share 2025-2030 (%)
Data Table on Application - Market share 2025-2030 (%)

8.2 Comparison by Application

Chart on Comparison by Application
Data Table on Comparison by Application

8.3 Poultry - Market size and forecast 2025-2030

Chart on Poultry - Market size and forecast 2025-2030 ($ million)
Data Table on Poultry - Market size and forecast 2025-2030 ($ million)
Chart on Poultry - Year-over-year growth 2025-2030 (%)
Data Table on Poultry - Year-over-year growth 2025-2030 (%)

8.4 Ruminants - Market size and forecast 2025-2030

Chart on Ruminants - Market size and forecast 2025-2030 ($ million)
Data Table on Ruminants - Market size and forecast 2025-2030 ($ million)
Chart on Ruminants - Year-over-year growth 2025-2030 (%)
Data Table on Ruminants - Year-over-year growth 2025-2030 (%)

8.5 Swine - Market size and forecast 2025-2030

Chart on Swine - Market size and forecast 2025-2030 ($ million)
Data Table on Swine - Market size and forecast 2025-2030 ($ million)
Chart on Swine - Year-over-year growth 2025-2030 (%)
Data Table on Swine - Year-over-year growth 2025-2030 (%)

8.6 Others - Market size and forecast 2025-2030

Chart on Others - Market size and forecast 2025-2030 ($ million)
Data Table on Others - Market size and forecast 2025-2030 ($ million)
Chart on Others - Year-over-year growth 2025-2030 (%)
Data Table on Others - Year-over-year growth 2025-2030 (%)

8.7 Market opportunity by Application

Market opportunity by Application ($ million)
Data Table on Market opportunity by Application ($ million)

9. Market Segmentation by Type

9.1 Market segments

Chart on Type - Market share 2025-2030 (%)
Data Table on Type - Market share 2025-2030 (%)

9.2 Comparison by Type

Chart on Comparison by Type
Data Table on Comparison by Type

9.3 Dry - Market size and forecast 2025-2030

Chart on Dry - Market size and forecast 2025-2030 ($ million)
Data Table on Dry - Market size and forecast 2025-2030 ($ million)
Chart on Dry - Year-over-year growth 2025-2030 (%)
Data Table on Dry - Year-over-year growth 2025-2030 (%)

9.4 Liquid - Market size and forecast 2025-2030

Chart on Liquid - Market size and forecast 2025-2030 ($ million)
Data Table on Liquid - Market size and forecast 2025-2030 ($ million)
Chart on Liquid - Year-over-year growth 2025-2030 (%)
Data Table on Liquid - Year-over-year growth 2025-2030 (%)

9.5 Market opportunity by Type

Market opportunity by Type ($ million)
Data Table on Market opportunity by Type ($ million)

10. Market Segmentation by Product

10.1 Market segments

Chart on Product - Market share 2025-2030 (%)
Data Table on Product - Market share 2025-2030 (%)

10.2 Comparison by Product

Chart on Comparison by Product
Data Table on Comparison by Product

10.3 Vitamins - Market size and forecast 2025-2030

Chart on Vitamins - Market size and forecast 2025-2030 ($ million)
Data Table on Vitamins - Market size and forecast 2025-2030 ($ million)
Chart on Vitamins - Year-over-year growth 2025-2030 (%)
Data Table on Vitamins - Year-over-year growth 2025-2030 (%)

10.4 Minerals - Market size and forecast 2025-2030

Chart on Minerals - Market size and forecast 2025-2030 ($ million)
Data Table on Minerals - Market size and forecast 2025-2030 ($ million)
Chart on Minerals - Year-over-year growth 2025-2030 (%)
Data Table on Minerals - Year-over-year growth 2025-2030 (%)

10.5 Feed enzymes - Market size and forecast 2025-2030

Chart on Feed enzymes - Market size and forecast 2025-2030 ($ million)
Data Table on Feed enzymes - Market size and forecast 2025-2030 ($ million)
Chart on Feed enzymes - Year-over-year growth 2025-2030 (%)
Data Table on Feed enzymes - Year-over-year growth 2025-2030 (%)

10.6 Antioxidants - Market size and forecast 2025-2030

Chart on Antioxidants - Market size and forecast 2025-2030 ($ million)
Data Table on Antioxidants - Market size and forecast 2025-2030 ($ million)
Chart on Antioxidants - Year-over-year growth 2025-2030 (%)
Data Table on Antioxidants - Year-over-year growth 2025-2030 (%)

10.7 Others - Market size and forecast 2025-2030

Chart on Others - Market size and forecast 2025-2030 ($ million)
Data Table on Others - Market size and forecast 2025-2030 ($ million)
Chart on Others - Year-over-year growth 2025-2030 (%)
Data Table on Others - Year-over-year growth 2025-2030 (%)

10.8 Market opportunity by Product

Market opportunity by Product ($ million)
Data Table on Market opportunity by Product ($ million)

11. Market Segmentation by Source

11.1 Market segments

Chart on Source - Market share 2025-2030 (%)
Data Table on Source - Market share 2025-2030 (%)

11.2 Comparison by Source

Chart on Comparison by Source
Data Table on Comparison by Source

11.3 Synthetic - Market size and forecast 2025-2030

Chart on Synthetic - Market size and forecast 2025-2030 ($ million)
Data Table on Synthetic - Market size and forecast 2025-2030 ($ million)
Chart on Synthetic - Year-over-year growth 2025-2030 (%)
Data Table on Synthetic - Year-over-year growth 2025-2030 (%)

11.4 Natural - Market size and forecast 2025-2030

Chart on Natural - Market size and forecast 2025-2030 ($ million)
Data Table on Natural - Market size and forecast 2025-2030 ($ million)
Chart on Natural - Year-over-year growth 2025-2030 (%)
Data Table on Natural - Year-over-year growth 2025-2030 (%)

11.5 Market opportunity by Source

Market opportunity by Source ($ million)
Data Table on Market opportunity by Source ($ million)

12. Market Segmentation by Product Type

12.1 Market segments

Chart on Product Type - Market share 2025-2030 (%)
Data Table on Product Type - Market share 2025-2030 (%)

12.2 Comparison by Product Type

Chart on Comparison by Product Type
Data Table on Comparison by Product Type

12.3 Single function - Market size and forecast 2025-2030

Chart on Single function - Market size and forecast 2025-2030 ($ million)
Data Table on Single function - Market size and forecast 2025-2030 ($ million)
Chart on Single function - Year-over-year growth 2025-2030 (%)
Data Table on Single function - Year-over-year growth 2025-2030 (%)

12.4 Multifunction - Market size and forecast 2025-2030

Chart on Multifunction - Market size and forecast 2025-2030 ($ million)
Data Table on Multifunction - Market size and forecast 2025-2030 ($ million)
Chart on Multifunction - Year-over-year growth 2025-2030 (%)
Data Table on Multifunction - Year-over-year growth 2025-2030 (%)

12.5 Market opportunity by Product Type

Market opportunity by Product Type ($ million)
Data Table on Market opportunity by Product Type ($ million)

13. Customer Landscape

13.1 Customer landscape overview

Analysis of price sensitivity, lifecycle, customer purchase basket, adoption rates, and purchase criteria

14. Geographic Landscape

14.1 Geographic segmentation

Chart on Market share by geography 2025-2030 (%)
Data Table on Market share by geography 2025-2030 (%)

14.2 Geographic comparison

Chart on Geographic comparison
Data Table on Geographic comparison

14.3 APAC - Market size and forecast 2025-2030

Chart on APAC - Market size and forecast 2025-2030 ($ million)
Data Table on APAC - Market size and forecast 2025-2030 ($ million)
Chart on APAC - Year-over-year growth 2025-2030 (%)
Data Table on APAC - Year-over-year growth 2025-2030 (%)
Chart on Regional Comparison - APAC
Data Table on Regional Comparison - APAC

14.3.1 China - Market size and forecast 2025-2030

Chart on China - Market size and forecast 2025-2030 ($ million)
Data Table on China - Market size and forecast 2025-2030 ($ million)
Chart on China - Year-over-year growth 2025-2030 (%)
Data Table on China - Year-over-year growth 2025-2030 (%)

14.3.2 Japan - Market size and forecast 2025-2030

Chart on Japan - Market size and forecast 2025-2030 ($ million)
Data Table on Japan - Market size and forecast 2025-2030 ($ million)
Chart on Japan - Year-over-year growth 2025-2030 (%)
Data Table on Japan - Year-over-year growth 2025-2030 (%)

14.3.3 India - Market size and forecast 2025-2030

Chart on India - Market size and forecast 2025-2030 ($ million)
Data Table on India - Market size and forecast 2025-2030 ($ million)
Chart on India - Year-over-year growth 2025-2030 (%)
Data Table on India - Year-over-year growth 2025-2030 (%)

14.3.4 South Korea - Market size and forecast 2025-2030

Chart on South Korea - Market size and forecast 2025-2030 ($ million)
Data Table on South Korea - Market size and forecast 2025-2030 ($ million)
Chart on South Korea - Year-over-year growth 2025-2030 (%)
Data Table on South Korea - Year-over-year growth 2025-2030 (%)

14.3.5 Australia - Market size and forecast 2025-2030

Chart on Australia - Market size and forecast 2025-2030 ($ million)
Data Table on Australia - Market size and forecast 2025-2030 ($ million)
Chart on Australia - Year-over-year growth 2025-2030 (%)
Data Table on Australia - Year-over-year growth 2025-2030 (%)

14.3.6 Indonesia - Market size and forecast 2025-2030

Chart on Indonesia - Market size and forecast 2025-2030 ($ million)
Data Table on Indonesia - Market size and forecast 2025-2030 ($ million)
Chart on Indonesia - Year-over-year growth 2025-2030 (%)
Data Table on Indonesia - Year-over-year growth 2025-2030 (%)

14.4 North America - Market size and forecast 2025-2030

Chart on North America - Market size and forecast 2025-2030 ($ million)
Data Table on North America - Market size and forecast 2025-2030 ($ million)
Chart on North America - Year-over-year growth 2025-2030 (%)
Data Table on North America - Year-over-year growth 2025-2030 (%)
Chart on Regional Comparison - North America
Data Table on Regional Comparison - North America

14.4.1 US - Market size and forecast 2025-2030

Chart on US - Market size and forecast 2025-2030 ($ million)
Data Table on US - Market size and forecast 2025-2030 ($ million)
Chart on US - Year-over-year growth 2025-2030 (%)
Data Table on US - Year-over-year growth 2025-2030 (%)

14.4.2 Canada - Market size and forecast 2025-2030

Chart on Canada - Market size and forecast 2025-2030 ($ million)
Data Table on Canada - Market size and forecast 2025-2030 ($ million)
Chart on Canada - Year-over-year growth 2025-2030 (%)
Data Table on Canada - Year-over-year growth 2025-2030 (%)

14.4.3 Mexico - Market size and forecast 2025-2030

Chart on Mexico - Market size and forecast 2025-2030 ($ million)
Data Table on Mexico - Market size and forecast 2025-2030 ($ million)
Chart on Mexico - Year-over-year growth 2025-2030 (%)
Data Table on Mexico - Year-over-year growth 2025-2030 (%)

14.5 Europe - Market size and forecast 2025-2030

Chart on Europe - Market size and forecast 2025-2030 ($ million)
Data Table on Europe - Market size and forecast 2025-2030 ($ million)
Chart on Europe - Year-over-year growth 2025-2030 (%)
Data Table on Europe - Year-over-year growth 2025-2030 (%)
Chart on Regional Comparison - Europe
Data Table on Regional Comparison - Europe

14.5.1 Germany - Market size and forecast 2025-2030

Chart on Germany - Market size and forecast 2025-2030 ($ million)
Data Table on Germany - Market size and forecast 2025-2030 ($ million)
Chart on Germany - Year-over-year growth 2025-2030 (%)
Data Table on Germany - Year-over-year growth 2025-2030 (%)

14.5.2 UK - Market size and forecast 2025-2030

Chart on UK - Market size and forecast 2025-2030 ($ million)
Data Table on UK - Market size and forecast 2025-2030 ($ million)
Chart on UK - Year-over-year growth 2025-2030 (%)
Data Table on UK - Year-over-year growth 2025-2030 (%)

14.5.3 France - Market size and forecast 2025-2030

Chart on France - Market size and forecast 2025-2030 ($ million)
Data Table on France - Market size and forecast 2025-2030 ($ million)
Chart on France - Year-over-year growth 2025-2030 (%)
Data Table on France - Year-over-year growth 2025-2030 (%)

14.5.4 Italy - Market size and forecast 2025-2030

Chart on Italy - Market size and forecast 2025-2030 ($ million)
Data Table on Italy - Market size and forecast 2025-2030 ($ million)
Chart on Italy - Year-over-year growth 2025-2030 (%)
Data Table on Italy - Year-over-year growth 2025-2030 (%)

14.5.5 Spain - Market size and forecast 2025-2030

Chart on Spain - Market size and forecast 2025-2030 ($ million)
Data Table on Spain - Market size and forecast 2025-2030 ($ million)
Chart on Spain - Year-over-year growth 2025-2030 (%)
Data Table on Spain - Year-over-year growth 2025-2030 (%)

14.5.6 The Netherlands - Market size and forecast 2025-2030

Chart on The Netherlands - Market size and forecast 2025-2030 ($ million)
Data Table on The Netherlands - Market size and forecast 2025-2030 ($ million)
Chart on The Netherlands - Year-over-year growth 2025-2030 (%)
Data Table on The Netherlands - Year-over-year growth 2025-2030 (%)

14.6 South America - Market size and forecast 2025-2030

Chart on South America - Market size and forecast 2025-2030 ($ million)
Data Table on South America - Market size and forecast 2025-2030 ($ million)
Chart on South America - Year-over-year growth 2025-2030 (%)
Data Table on South America - Year-over-year growth 2025-2030 (%)
Chart on Regional Comparison - South America
Data Table on Regional Comparison - South America

14.6.1 Brazil - Market size and forecast 2025-2030

Chart on Brazil - Market size and forecast 2025-2030 ($ million)
Data Table on Brazil - Market size and forecast 2025-2030 ($ million)
Chart on Brazil - Year-over-year growth 2025-2030 (%)
Data Table on Brazil - Year-over-year growth 2025-2030 (%)

14.6.2 Argentina - Market size and forecast 2025-2030

Chart on Argentina - Market size and forecast 2025-2030 ($ million)
Data Table on Argentina - Market size and forecast 2025-2030 ($ million)
Chart on Argentina - Year-over-year growth 2025-2030 (%)
Data Table on Argentina - Year-over-year growth 2025-2030 (%)

14.6.3 Chile - Market size and forecast 2025-2030

Chart on Chile - Market size and forecast 2025-2030 ($ million)
Data Table on Chile - Market size and forecast 2025-2030 ($ million)
Chart on Chile - Year-over-year growth 2025-2030 (%)
Data Table on Chile - Year-over-year growth 2025-2030 (%)

14.7 Middle East and Africa - Market size and forecast 2025-2030

Chart on Middle East and Africa - Market size and forecast 2025-2030 ($ million)
Data Table on Middle East and Africa - Market size and forecast 2025-2030 ($ million)
Chart on Middle East and Africa - Year-over-year growth 2025-2030 (%)
Data Table on Middle East and Africa - Year-over-year growth 2025-2030 (%)
Chart on Regional Comparison - Middle East and Africa
Data Table on Regional Comparison - Middle East and Africa

14.7.1 UAE - Market size and forecast 2025-2030

Chart on UAE - Market size and forecast 2025-2030 ($ million)
Data Table on UAE - Market size and forecast 2025-2030 ($ million)
Chart on UAE - Year-over-year growth 2025-2030 (%)
Data Table on UAE - Year-over-year growth 2025-2030 (%)

14.7.2 Saudi Arabia - Market size and forecast 2025-2030

Chart on Saudi Arabia - Market size and forecast 2025-2030 ($ million)
Data Table on Saudi Arabia - Market size and forecast 2025-2030 ($ million)
Chart on Saudi Arabia - Year-over-year growth 2025-2030 (%)
Data Table on Saudi Arabia - Year-over-year growth 2025-2030 (%)

14.7.3 South Africa - Market size and forecast 2025-2030

Chart on South Africa - Market size and forecast 2025-2030 ($ million)
Data Table on South Africa - Market size and forecast 2025-2030 ($ million)
Chart on South Africa - Year-over-year growth 2025-2030 (%)
Data Table on South Africa - Year-over-year growth 2025-2030 (%)

14.7.4 Turkey - Market size and forecast 2025-2030

Chart on Turkey - Market size and forecast 2025-2030 ($ million)
Data Table on Turkey - Market size and forecast 2025-2030 ($ million)
Chart on Turkey - Year-over-year growth 2025-2030 (%)
Data Table on Turkey - Year-over-year growth 2025-2030 (%)

14.7.5 Egypt - Market size and forecast 2025-2030

Chart on Egypt - Market size and forecast 2025-2030 ($ million)
Data Table on Egypt - Market size and forecast 2025-2030 ($ million)
Chart on Egypt - Year-over-year growth 2025-2030 (%)
Data Table on Egypt - Year-over-year growth 2025-2030 (%)

14.8 Market opportunity by geography

Market opportunity by geography ($ million)
Data Tables on Market opportunity by geography ($ million)

15. Drivers, Challenges, and Opportunity

15.1 Market drivers

Rising global demand for animal protein and necessity for enhanced feed efficiency
Global transition toward sustainable production and search for antibiotic alternatives
Technological advancements in biotechnology and precision nutrition strategies

15.2 Market challenges

Fluctuations in raw material costs and global supply chain vulnerabilities
Stringent regulatory frameworks and global phase-out of antibiotic growth promoters
High financial barriers for advanced research and implementation of precision nutrition

15.3 Impact of drivers and challenges

Impact of drivers and challenges in 2025 and 2030

15.4 Market opportunities

Ascendance of phytogenic feed additives and botanical solutions
Integration of precision nutrition and digital feed management systems
Expansion of circular economy and utilization of alternative additive sources

16. Competitive Landscape

16.1 Overview

16.2

Overview on criticality of inputs and factors of differentiation

16.3 Landscape disruption

Overview on factors of disruption

16.4 Industry risks

Impact of key risks on business

17. Competitive Analysis

17.1 Companies profiled

Companies covered

17.2 Company ranking index

17.3 Market positioning of companies

Matrix on companies position and classification

17.4 AB Agri Ltd.

AB Agri Ltd. - Overview
AB Agri Ltd. - Product / Service
AB Agri Ltd. - Key offerings
SWOT

17.5 Adisseo France SAS

Adisseo France SAS - Overview
Adisseo France SAS - Product / Service
Adisseo France SAS - Key offerings
SWOT

17.6 Ajinomoto Co. Inc.

Ajinomoto Co. Inc. - Overview
Ajinomoto Co. Inc. - Business segments
Ajinomoto Co. Inc. - Key offerings
Ajinomoto Co. Inc. - Segment focus
SWOT

17.7 Alltech Inc.

Alltech Inc. - Overview
Alltech Inc. - Product / Service
Alltech Inc. - Key offerings
SWOT

17.8 Anpario plc

Anpario plc - Overview
Anpario plc - Product / Service
Anpario plc - Key offerings
SWOT

17.9 Archer Daniels Midland Co.

Archer Daniels Midland Co. - Overview
Archer Daniels Midland Co. - Business segments
Archer Daniels Midland Co. - Key news
Archer Daniels Midland Co. - Key offerings
Archer Daniels Midland Co. - Segment focus
SWOT

17.10 Balchem Inc.

Balchem Inc. - Overview
Balchem Inc. - Business segments
Balchem Inc. - Key offerings
Balchem Inc. - Segment focus
SWOT

17.11 BASF SE

BASF SE - Overview
BASF SE - Business segments
BASF SE - Key news
BASF SE - Key offerings
BASF SE - Segment focus
SWOT

17.12 Cargill Inc.

Cargill Inc. - Overview
Cargill Inc. - Product / Service
Cargill Inc. - Key news
Cargill Inc. - Key offerings
SWOT

17.13 CJ CheilJedang Corp.

CJ CheilJedang Corp. - Overview
CJ CheilJedang Corp. - Business segments
CJ CheilJedang Corp. - Key offerings
CJ CheilJedang Corp. - Segment focus
SWOT

17.14 DSM Firmenich AG

DSM Firmenich AG - Overview
DSM Firmenich AG - Business segments
DSM Firmenich AG - Key offerings
DSM Firmenich AG - Segment focus
SWOT

17.15 Evonik Industries AG

Evonik Industries AG - Overview
Evonik Industries AG - Business segments
Evonik Industries AG - Key news
Evonik Industries AG - Key offerings
Evonik Industries AG - Segment focus
SWOT

17.16 EW Nutrition GmbH

EW Nutrition GmbH - Overview
EW Nutrition GmbH - Product / Service
EW Nutrition GmbH - Key offerings
SWOT

17.17 International Flavors Inc.

International Flavors Inc. - Overview
International Flavors Inc. - Business segments
International Flavors Inc. - Key news
International Flavors Inc. - Key offerings
International Flavors Inc. - Segment focus
SWOT

17.18 Phibro Animal Health Corp.

Phibro Animal Health Corp. - Overview
Phibro Animal Health Corp. - Business segments
Phibro Animal Health Corp. - Key offerings
Phibro Animal Health Corp. - Segment focus
SWOT

18. Appendix

18.1 Scope of the report

Market definition
Objectives
Notes and caveats

18.2 Inclusions and exclusions checklist

Inclusions checklist
Exclusions checklist

18.3 Currency conversion rates for US$

18.4 Research methodology

18.5 Data procurement

Information sources

18.6 Data validation

18.7 Validation techniques employed for market sizing

18.8 Data synthesis

18.9 360 degree market analysis

18.10 List of abbreviations

Research Methodology

Technavio presents a detailed picture of the market by way of study, synthesis, and summation of data from multiple sources. The analysts have presented the various facets of the market with a particular focus on identifying the key industry influencers. The data thus presented is comprehensive, reliable, and the result of extensive research, both primary and secondary.

INFORMATION SOURCES

Primary sources

  • Manufacturers and suppliers
  • Channel partners
  • Industry experts
  • Strategic decision makers

Secondary sources

  • Industry journals and periodicals
  • Government data
  • Financial reports of key industry players
  • Historical data
  • Press releases

DATA ANALYSIS

Data Synthesis

  • Collation of data
  • Estimation of key figures
  • Analysis of derived insights

Data Validation

  • Triangulation with data models
  • Reference against proprietary databases
  • Corroboration with industry experts

REPORT WRITING

Qualitative

  • Market drivers
  • Market challenges
  • Market trends
  • Five forces analysis

Quantitative

  • Market size and forecast
  • Market segmentation
  • Geographical insights
  • Competitive landscape

Interested in this report?

Get your sample now to see our research methodology and insights!

Download Now

Frequently Asked Questions

Animal Feed Additives market growth will increase by USD 11710.6 million during 2026-2030.

The Animal Feed Additives market is expected to grow at a CAGR of 6.8% during 2026-2030.

Animal Feed Additives market is segmented by Application (Poultry, Ruminants, Swine, Others) Type (Dry, Liquid) Product (Vitamins, Minerals, Feed enzymes, Antioxidants, Others) Source (Synthetic, Natural) Product type (Single function, Multifunction)

AB Agri Ltd., Adisseo France SAS, Ajinomoto Co. Inc., Alltech Inc., Anpario plc, Archer Daniels Midland Co., Balchem Inc., BASF SE, Cargill Inc., CJ CheilJedang Corp., DSM Firmenich AG, Evonik Industries AG, EW Nutrition GmbH, Huvepharma Inc., Innov Ad NV SA, International Flavors Inc., Nutreco N.V., Perstorp Holding AB, Phibro Animal Health Corp., Zinpro Corp. are a few of the key vendors in the Animal Feed Additives market.

APAC will register the highest growth rate of 57.3% among the other regions. Therefore, the Animal Feed Additives market in APAC is expected to garner significant business opportunities for the vendors during the forecast period.

China, Japan, India, South Korea, Australia, Indonesia, US, Canada, Mexico, Germany, UK, France, Italy, Spain, The Netherlands, Brazil, Argentina, Chile, UAE, Saudi Arabia, South Africa, Turkey, Egypt

  • Rising global demand for animal protein and necessity for enhanced feed efficiency is the driving factor this market.

The Animal Feed Additives market vendors should focus on grabbing business opportunities from the Application segment as it accounted for the largest market share in the base year.
RIA - Research AI Assistant
Ask RIA
