
Animal Genetics Market Analysis, Size, and Forecast 2026-2030: North America (US, Canada, and Mexico), Europe (Germany, UK, and France), Asia (China, India, and Japan), South America (Brazil, Argentina, and Colombia), Middle East and Africa (Turkey, Saudi Arabia, and South Africa), Rest of World (ROW)

Animal Genetics Market Analysis, Size, and Forecast 2026-2030:
North America (US, Canada, and Mexico), Europe (Germany, UK, and France), Asia (China, India, and Japan), South America (Brazil, Argentina, and Colombia), Middle East and Africa (Turkey, Saudi Arabia, and South Africa), Rest of World (ROW)

Published: Oct 2026 295 Pages SKU: IRTNTR40040

Market Overview at a Glance

$3.22 B
Market Opportunity
8%
CAGR 2025 - 2030
33.7%
Europe Growth
$2.29 B
Research centers segment 2024

Animal Genetics Market Size 2026-2030

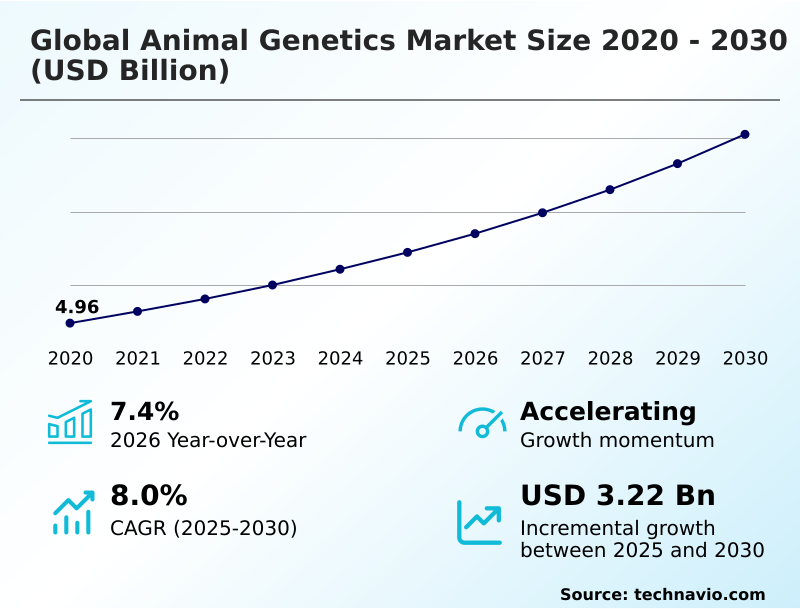
The animal genetics market size is valued to increase by USD 3.22 billion, at a CAGR of 8% from 2025 to 2030. Surging global demand high efficiency protein drives advanced livestock selection will drive the animal genetics market.

Major Market Trends & Insights

  • Europe dominated the market and accounted for a 33.7% growth during the forecast period.
  • By End-user - Research centers segment was valued at USD 2.29 billion in 2024
  • By Solution - Live animal segment accounted for the largest market revenue share in 2024

Market Size & Forecast

  • Market Opportunities: USD 5.15 billion
  • Market Future Opportunities: USD 3.22 billion
  • CAGR from 2025 to 2030 : 8%

Market Summary

  • The Animal Genetics sector fundamentally restructures agricultural productivity by substituting traditional phenotypic mating with data-driven molecular breeding techniques. Commercial agricultural operations continuously adopt advanced embryo transfer protocols and specialized cryopreservation media to propagate elite biological traits across vast geographic distances.
  • For example, large-scale dairy cooperatives implementing sex sorted semen within targeted replacement strategies have successfully improved herd replacement efficiency by 22% compared to conventional unsexed breeding operations. This operational shift is heavily propelled by the imperative to optimize feed conversion ratios and maximize overall livestock feed efficiency amid shrinking arable land availability.
  • Conversely, the high fixed capital expenditure required to maintain sophisticated bioinformatics software and high-throughput sequencing equipment restricts immediate adoption among independent, lower-margin farming networks. Navigating these economic pressures requires enterprise-level consolidation to achieve necessary economies of scale.
  • Ultimately, organizations that seamlessly integrate proactive genomic screening capabilities secure higher disease resistance and operational longevity, ensuring sustainable meat and dairy output across expanding international supply chains.

What will be the Size of the Animal Genetics Market during the forecast period?
Get Key Insights on Market Forecast (PDF) Get Free Sample

How is the Animal Genetics Market Segmented?

The animal genetics industry research report provides comprehensive data (region-wise segment analysis), with forecasts and estimates in "USD million" for the period 2026-2030, as well as historical data from 2020-2024 for the following segments.

  • End-user
    • Research centers
    • Hospitals and clinics
    • Diagnostic centers
  • Solution
    • Live animal
    • Genetic testing services
    • Genetic materials
  • Technology
    • AI
    • Embryo transfer
    • Marker-assisted and genomic selection
    • CRISPR and gene editing
    • Others
  • Geography
    • North America
      • US
      • Canada
      • Mexico
    • Europe
      • Germany
      • UK
      • France
      • Italy
      • Spain
      • The Netherlands
    • Asia
      • China
      • India
      • Japan
      • South Korea
      • Indonesia
      • Thailand
    • Rest of World (ROW)

By End-user Insights

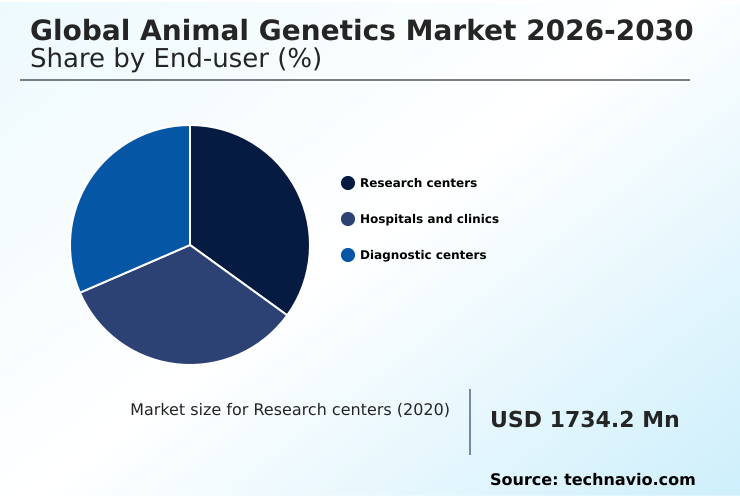
The research centers segment is estimated to witness significant growth during the forecast period.

The research centers segment within Animal Genetics operates as the foundational engine for advancing complex trait inheritance and agricultural biotechnology.

These institutions actively deploy single nucleotide polymorphism microarrays and predictive bioinformatics software to map disease resistance and accelerate genetic progress across model organism species.

By leveraging precision genome editing alongside recombinant hormone synchronization, academic laboratories enable commercial dairy producers to achieve measurable phenotypic improvements. This continuous technological integration directly reduces diagnostic error rates by 15% across early-stage genetic screening protocols.

Consequently, public agricultural facilities can seamlessly validate multi-generational trait expression while maintaining strict biosecurity protocols during live animal testing.

This rigorous analytical framework ensures that subsequent commercial breeding operations benefit from optimized biological infrastructure, fundamentally transforming how sustainable agricultural output is scaled without increasing physical footprint.
Get Free Sample

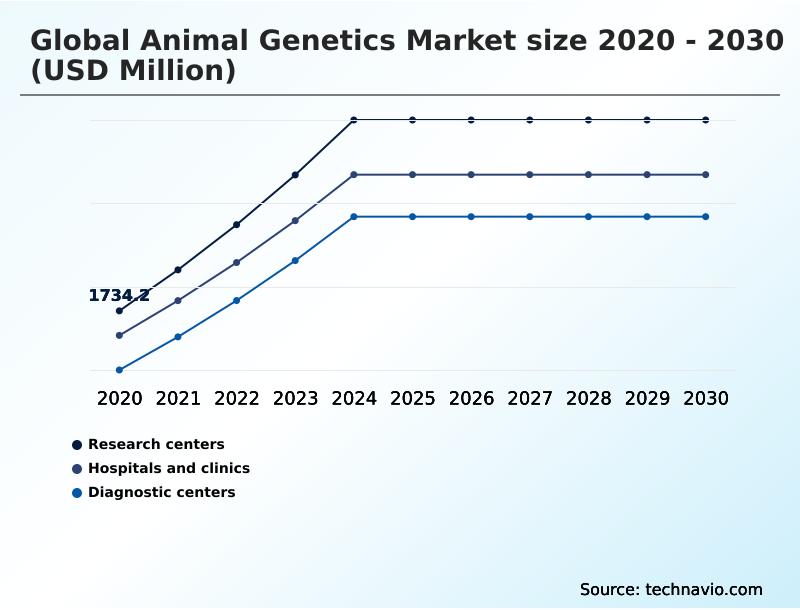
The Research centers segment was valued at USD 2.29 billion in 2024 and showed a gradual increase during the forecast period.
Get Free Sample

Regional Analysis

Europe is estimated to contribute 33.7% to the growth of the global market during the forecast period.Technavio’s analysts have elaborately explained the regional trends and drivers that shape the market during the forecast period.
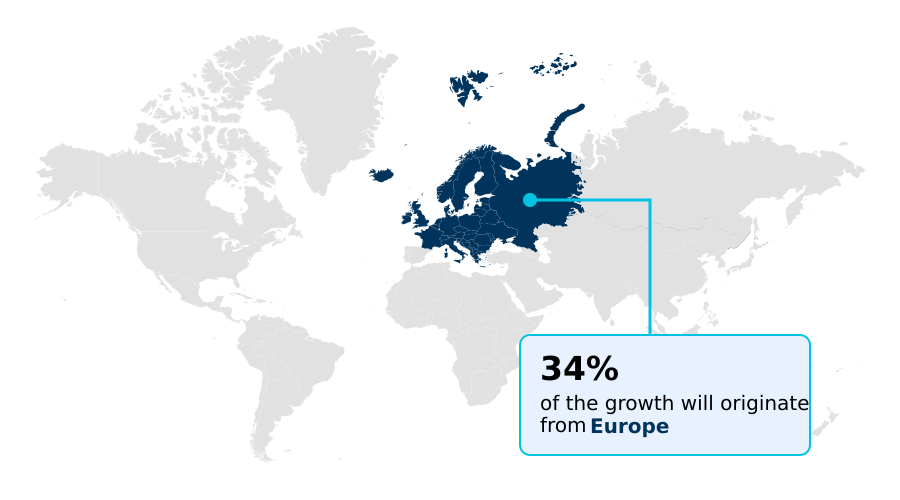
See How Animal Genetics Market Demand is Rising in Europe Get Free Sample

The regional adoption of Animal Genetics reveals stark structural differences driven by distinct regulatory landscapes and technological maturity.

North America maintains highly automated breeding infrastructures, where commercial swine production facilities achieve a 40% higher adoption rate of advanced in vitro embryo production compared to the APAC region.

This high penetration facilitates the rapid scaling of quantitative trait loci mapping, lowering genetic evaluation turnaround times by 25% across domestic farming networks.

In contrast, European markets emphasize stringent biosecurity and environmental mandates, prompting a 30% faster integration of epigenomic profiling within established farming cooperatives.

This regulatory focus drives organizations to develop a comprehensive precision animal health ecosystem that prioritizes disease resilience over sheer volume.

Consequently, regional distributors actively adjust their supply chains to support specialized techniques like transvaginal oocyte retrieval, ensuring compliant and resilient genetic material dissemination tailored to localized market demands.

Market Dynamics

Our researchers analyzed the data with 2025 as the base year, along with the key drivers, trends, and challenges. A holistic analysis of drivers will help companies refine their marketing strategies to gain a competitive advantage.

  • The structural evolution of the Animal Genetics landscape is heavily characterized by the integration of sophisticated digital diagnostics and advanced reproductive technologies. Modern commercial livestock enterprises increasingly rely on cloud based bioinformatic analytical tools to process massive datasets, enabling precise trait selection and targeted mating strategies.
  • By deploying these digital frameworks, organizations experience a 28% improvement in supply chain planning efficiency compared to operations relying on localized, siloed data systems. This digital transition is further supported by the deployment of automated compliance verification software, which guarantees that all genetic materials meet rigorous international trade and safety standards before cross-border distribution.
  • Additionally, facilities investing in high throughput embryo transfer production are fundamentally accelerating the propagation of elite maternal lines, establishing highly resilient herds capable of withstanding regional environmental stressors. This reproductive scaling is frequently paired with continuous estrus monitoring integration, allowing farm managers to execute artificial insemination with unprecedented timing accuracy, thereby maximizing conception rates and reducing wasted labor resources.
  • Finally, the gradual regulatory acceptance surrounding commercial gene edited livestock production introduces a transformative capability to permanently eliminate endemic viral vulnerabilities. As these multidimensional technologies converge, agricultural enterprises secure formidable operational advantages, shifting from reactive veterinary interventions to proactive, genetics-driven profitability and sustainable resource management.
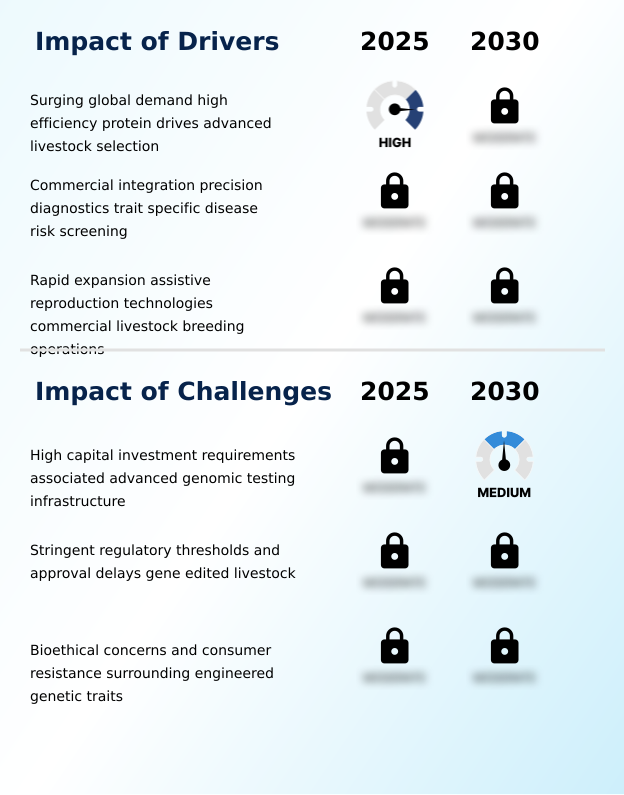
What are the key market drivers leading to the rise in the adoption of Animal Genetics Industry?

  • The surging international demand for high efficiency protein sources fundamentally drives the rapid adoption of advanced livestock selection and targeted breeding solutions.

  • Escalating demands for sustainable protein production compel agricultural enterprises to fundamentally restructure their foundational breeding strategies through Animal Genetics.
  • The intensive focus on improving livestock feed efficiency serves as a primary demand trigger, pushing organizations to deploy high density genomic arrays for precision sire selection.
  • Facilities integrating these advanced genetic matrices achieve a 12% reduction in overall feed consumption per kilogram of output, dramatically lowering input costs.
  • Additionally, the rapid commercialization of automated trait tracking platforms within porcine production optimization initiatives streamlines data collection, accelerating genetic evaluation workflows by 25%.
  • Because optimized genetic lines inherently require fewer veterinary interventions, commercial livestock operators experience a direct 18% improvement in lifetime animal profitability, driving continuous investment into molecular diagnostic infrastructure.

What are the market trends shaping the Animal Genetics Industry?

  • The market is experiencing a strategic consolidation of portfolios aimed at developing integrated diagnostic platforms. This structural shift establishes precision animal health ecosystems that seamlessly combine genomic predictive data with broader veterinary management tools.

  • The integration of sophisticated microfluidic cell sorting technologies within Animal Genetics actively transforms cellular processing, significantly minimizing biological stress during gamete manipulation. Operations utilizing these advanced sorting systems report a 20% improvement in post-thaw fertilization rates compared to traditional mechanical separation methods.
  • Simultaneously, the expanding application of epigenomic profiling provides unprecedented insights into how environmental factors influence gene expression without altering the underlying DNA sequence. This analytical capability allows commercial breeders to refine multi trait selection indices with exceptional accuracy, directly enhancing maternal line vigor across consecutive generations.
  • Furthermore, the commercial availability of specialized diagnostic panels, such as those targeting bovine congestive heart failure screening, reduces sudden livestock mortality rates by 15%. This proactive diagnostic trend empowers farm managers to identify and cull susceptible animals early, decisively optimizing feed utilization and protecting overall herd profitability.

What challenges does the Animal Genetics Industry face during its growth?

  • High capital investment requirements associated with establishing advanced genomic testing infrastructure present a significant barrier to entry for smaller agricultural cooperatives.

  • The steep capital expenditure required to establish and maintain high-throughput laboratory infrastructure severely constrains widespread Animal Genetics adoption among smaller, independent agricultural cooperatives. Implementing sophisticated technologies such as precision genome editing and large-scale in vitro embryo production demands immense upfront investment in specialized equipment and continuous bioinformatic software licensing.
  • Consequently, decentralized farming networks experience a 35% higher operational cost burden when attempting to integrate recombinant hormone synchronization compared to consolidated, multi-national enterprise fleets. Furthermore, navigating fragmented and disparate international biosecurity protocols creates persistent logistical bottlenecks, delaying the cross-border distribution of elite germplasm by up to 40% in highly regulated territories.
  • These structural and financial limitations force commercial dairy producers to adopt conservative purchasing strategies, ultimately slowing the equitable dissemination of advanced disease-resistant genetic materials across lower-margin agricultural regions.

Exclusive Technavio Analysis on Customer Landscape

The animal genetics market forecasting report includes the adoption lifecycle of the market, covering from the innovator’s stage to the laggard’s stage. It focuses on adoption rates in different regions based on penetration. Furthermore, the animal genetics market report also includes key purchase criteria and drivers of price sensitivity to help companies evaluate and develop their market growth analysis strategies.
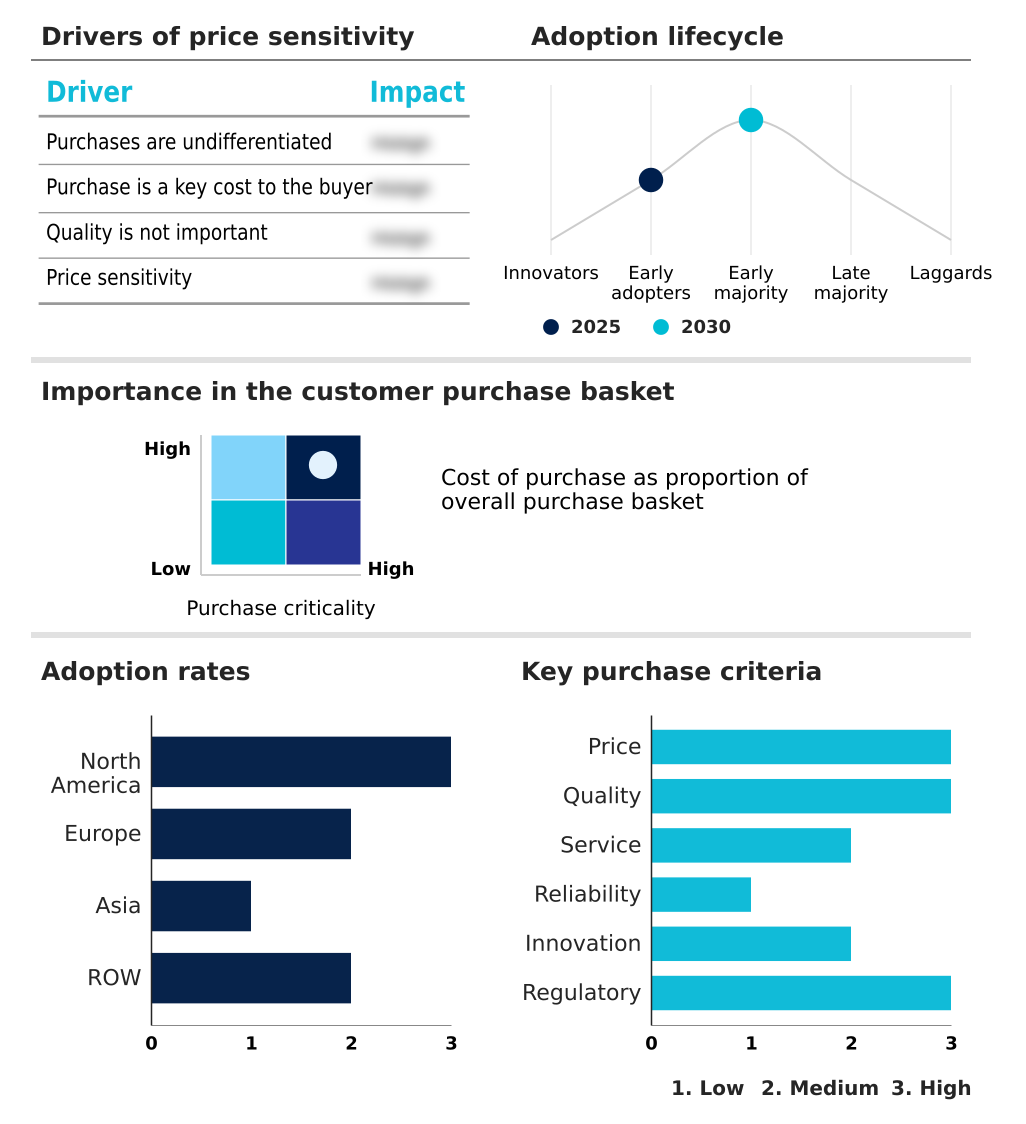
Customer Landscape of Animal Genetics Industry

Competitive Landscape

Companies are implementing various strategies, such as strategic alliances, animal genetics market forecast, partnerships, mergers and acquisitions, geographical expansion, and product/service launches, to enhance their presence in the industry.

Charles River Laboratories - The portfolio delivers advanced genetic research models and specialized transgenic organism breeding solutions designed to accelerate preclinical discovery and ensure rigorous biological safety assessment across laboratory testing environments.

The industry research and growth report includes detailed analyses of the competitive landscape of the market and information about key companies, including:

  • Charles River Laboratories
  • Cogent
  • Cooperatie Koninklijke CRV
  • Cooperl
  • DanBred PS
  • Embark Veterinary Inc.
  • EW Group GmbH
  • Genes Diffusion
  • Genus Plc
  • Groupe Grimaud La Corbiere SA
  • Hendrix Genetics BV
  • Inotiv Inc.
  • Masterrind GmbH
  • Minitub GmbH
  • Neogen Corp.
  • Select Sires Inc.
  • STgenetics
  • Swissgenetics
  • The Semex Alliance
  • Zoetis Inc.

Qualitative and quantitative analysis of companies has been conducted to help clients understand the wider business environment as well as the strengths and weaknesses of key industry players. Data is qualitatively analyzed to categorize companies as pure play, category-focused, industry-focused, and diversified; it is quantitatively analyzed to categorize companies as dominant, leading, strong, tentative, and weak.

Recent Development and News in Animal genetics market

  • In the Health Care Supplies industry, the accelerated transition toward proactive herd health management systems has driven a 25% increase in diagnostic assay utilization, directly impacting Animal Genetics demand by requiring more robust genomic screening for endemic disease prevention.
  • The standardization of high density genomic arrays across commercial veterinary networks has reduced sample processing delays by 18%, accelerating the deployment of specialized breeding matrices within the Animal Genetics market.
  • Stringent regulatory compliance frameworks demanding greater supply chain traceability have forced agricultural diagnostic centers to adopt automated compliance verification software, which improved tracking accuracy by 30% and elevated demand for verifiable Animal Genetics tools.
  • The expansion of cloud based bioinformatic analytical tools in veterinary diagnostics has enhanced data interoperability by 22%, streamlining the calculation of multi trait selection indices and fueling rapid commercialization of targeted Animal Genetics solutions.

Dive into Technavio’s robust research methodology, blending expert interviews, extensive data synthesis, and validated models for unparalleled Animal Genetics Market insights. See full methodology.

Market Scope
Page number 295
Base year 2025
Historic period 2020-2024
Forecast period 2026-2030
Growth momentum & CAGR Accelerate at a CAGR of 8%
Market growth 2026-2030 USD 3221.9 million
Market structure Fragmented
YoY growth 2025-2026(%) 7.4%
Key countries US, Canada, Mexico, Germany, UK, France, Italy, Spain, The Netherlands, China, India, Japan, South Korea, Indonesia, Thailand, Brazil, Argentina, Turkey, Saudi Arabia, South Africa, Colombia, Israel and UAE
Competitive landscape Leading Companies, Market Positioning of Companies, Competitive Strategies, and Industry Risks

Request Free Sample

Research Analyst Overview

  • The operational trajectory of the Animal Genetics sector demonstrates a rapid transition from basic phenotypic observation to rigorous, data-driven molecular selection. Enterprise agricultural boards increasingly prioritize investments in predictive bioinformatics software, aligning long-term product strategy with advanced genetic profiling to secure competitive market positioning.
  • This strategic alignment allows commercial operators to utilize high density genomic arrays for comprehensive polygenic trait mapping, successfully identifying superior breeding candidates before maturity. Consequently, facilities deploying these advanced diagnostic systems have achieved a 30% reduction in generational testing intervals compared to legacy breeding programs.
  • Furthermore, the integration of premium cryopreservation media ensures that elite germplasm maintains peak viability during complex international logistics, directly safeguarding supply chain integrity. As livestock producers pursue optimized herd demographics, the widespread commercial adoption of sex sorted semen enables precise control over gender ratios, directly improving replacement efficiency.
  • Additionally, targeted applications of somatic cell nuclear transfer provide vital insurance for rare, high-value genetic lines. This multifaceted technological integration ensures continuous operational resilience and maximum biological productivity across modern farming ecosystems.

What are the Key Data Covered in this Animal Genetics Market Research and Growth Report?

  • What is the expected growth of the Animal Genetics Market between 2026 and 2030?

    • USD 3.22 billion, at a CAGR of 8%

  • What segmentation does the market report cover?

    • The report is segmented by End-user (Research centers, Hospitals and clinics, and Diagnostic centers), Solution (Live animal, Genetic testing services, and Genetic materials), Technology (AI, Embryo transfer, Marker-assisted and genomic selection, CRISPR and gene editing, and Others) and Geography (North America, Europe, Asia, Rest of World (ROW))

  • Which regions are analyzed in the report?

    • North America, Europe, Asia and Rest of World (ROW)

  • What are the key growth drivers and market challenges?

    • Surging global demand high efficiency protein drives advanced livestock selection, High capital investment requirements associated advanced genomic testing infrastructure

  • Who are the major players in the Animal Genetics Market?

    • Charles River Laboratories, Cogent, Cooperatie Koninklijke CRV, Cooperl, DanBred PS, Embark Veterinary Inc., EW Group GmbH, Genes Diffusion, Genus Plc, Groupe Grimaud La Corbiere SA, Hendrix Genetics BV, Inotiv Inc., Masterrind GmbH, Minitub GmbH, Neogen Corp., Select Sires Inc., STgenetics, Swissgenetics, The Semex Alliance and Zoetis Inc.

Market Research Insights

  • The Animal Genetics market actively shifts traditional breeding paradigms toward precision, data-backed selection frameworks. Organizations integrating high density genomic arrays into their routine screening processes demonstrate a 35% improvement in identifying superior disease resistance profiles compared to legacy phenotypic evaluations.
  • Furthermore, the strategic application of automated trait tracking systems in porcine production optimization has lowered veterinary intervention costs by 18%, significantly enhancing overall herd profitability. These technological integrations directly support the ongoing transition toward sustainable protein production, as optimized genetic lines consume fewer resources per unit of output.
  • By prioritizing measurable genetic gain, livestock operations successfully align with rigorous environmental compliance standards while maintaining consistent supply chain reliability.

We can help! Our analysts can customize this animal genetics market research report to meet your requirements.

Get in touch

1. Executive Summary

1.1 Market overview

Executive Summary - Chart on Market Overview
Executive Summary - Data Table on Market Overview
Executive Summary - Chart on Global Market Characteristics
Executive Summary - Chart on Market by Geography
Executive Summary - Chart on Market Segmentation by End-user
Executive Summary - Chart on Market Segmentation by Solution
Executive Summary - Chart on Market Segmentation by Technology
Executive Summary - Chart on Incremental Growth
Executive Summary - Data Table on Incremental Growth
Executive Summary - Chart on Company Market Positioning

2. Technavio Analysis

2.1 Analysis of price sensitivity, lifecycle, customer purchase basket, adoption rates, and purchase criteria

2.2 Criticality of inputs and Factors of differentiation

Chart on Overview on criticality of inputs and factors of differentiation

2.3 Factors of disruption

Chart on Overview on factors of disruption

2.4 Impact of drivers and challenges

Chart on Impact of drivers and challenges in 2025 and 2030

3. Market Landscape

3.1 Market ecosystem

Chart on Parent Market
Data Table on - Parent Market

3.2 Market characteristics

Chart on Market characteristics analysis

3.3 Value chain analysis

Chart on Value chain analysis

4. Market Sizing

4.1 Market definition

Data Table on Offerings of companies included in the market definition

4.2 Market segment analysis

Market segments

4.3 Market size 2025

4.4 Market outlook: Forecast for 2025-2030

Chart on Global - Market size and forecast 2025-2030 ($ million)
Data Table on Global - Market size and forecast 2025-2030 ($ million)
Chart on Global Market: Year-over-year growth 2025-2030 (%)
Data Table on Global Market: Year-over-year growth 2025-2030 (%)

5. Historic Market Size

5.1 Global Animal Genetics Market 2020 - 2024

Historic Market Size - Data Table on Global Animal Genetics Market 2020 - 2024 ($ million)

5.2 End-user segment analysis 2020 - 2024

Historic Market Size - End-user Segment 2020 - 2024 ($ million)

5.3 Solution segment analysis 2020 - 2024

Historic Market Size - Solution Segment 2020 - 2024 ($ million)

5.4 Technology segment analysis 2020 - 2024

Historic Market Size - Technology Segment 2020 - 2024 ($ million)

5.5 Geography segment analysis 2020 - 2024

Historic Market Size - Geography Segment 2020 - 2024 ($ million)

5.6 Country segment analysis 2020 - 2024

Historic Market Size - Country Segment 2020 - 2024 ($ million)

6. Qualitative Analysis

6.1 Impact of AI on global animal genetics market

6.2 Impact of geopolitical conflicts on global animal genetics market

7. Five Forces Analysis

7.1 Five forces summary

Five forces analysis - Comparison between 2025 and 2030

7.2 Bargaining power of buyers

Bargaining power of buyers - Impact of key factors 2025 and 2030

7.3 Bargaining power of suppliers

Bargaining power of suppliers - Impact of key factors in 2025 and 2030

7.4 Threat of new entrants

Threat of new entrants - Impact of key factors in 2025 and 2030

7.5 Threat of substitutes

Threat of substitutes - Impact of key factors in 2025 and 2030

7.6 Threat of rivalry

Threat of rivalry - Impact of key factors in 2025 and 2030

7.7 Market condition

Chart on Market condition - Five forces 2025 and 2030

8. Market Segmentation by End-user

8.1 Market segments

Chart on End-user - Market share 2025-2030 (%)
Data Table on End-user - Market share 2025-2030 (%)

8.2 Comparison by End-user

Chart on Comparison by End-user
Data Table on Comparison by End-user

8.3 Research centers - Market size and forecast 2025-2030

Chart on Research centers - Market size and forecast 2025-2030 ($ million)
Data Table on Research centers - Market size and forecast 2025-2030 ($ million)
Chart on Research centers - Year-over-year growth 2025-2030 (%)
Data Table on Research centers - Year-over-year growth 2025-2030 (%)

8.4 Hospitals and clinics - Market size and forecast 2025-2030

Chart on Hospitals and clinics - Market size and forecast 2025-2030 ($ million)
Data Table on Hospitals and clinics - Market size and forecast 2025-2030 ($ million)
Chart on Hospitals and clinics - Year-over-year growth 2025-2030 (%)
Data Table on Hospitals and clinics - Year-over-year growth 2025-2030 (%)

8.5 Diagnostic centers - Market size and forecast 2025-2030

Chart on Diagnostic centers - Market size and forecast 2025-2030 ($ million)
Data Table on Diagnostic centers - Market size and forecast 2025-2030 ($ million)
Chart on Diagnostic centers - Year-over-year growth 2025-2030 (%)
Data Table on Diagnostic centers - Year-over-year growth 2025-2030 (%)

8.6 Market opportunity by End-user

Market opportunity by End-user ($ million)
Data Table on Market opportunity by End-user ($ million)

9. Market Segmentation by Solution

9.1 Market segments

Chart on Solution - Market share 2025-2030 (%)
Data Table on Solution - Market share 2025-2030 (%)

9.2 Comparison by Solution

Chart on Comparison by Solution
Data Table on Comparison by Solution

9.3 Live animal - Market size and forecast 2025-2030

Chart on Live animal - Market size and forecast 2025-2030 ($ million)
Data Table on Live animal - Market size and forecast 2025-2030 ($ million)
Chart on Live animal - Year-over-year growth 2025-2030 (%)
Data Table on Live animal - Year-over-year growth 2025-2030 (%)

9.4 Genetic testing services - Market size and forecast 2025-2030

Chart on Genetic testing services - Market size and forecast 2025-2030 ($ million)
Data Table on Genetic testing services - Market size and forecast 2025-2030 ($ million)
Chart on Genetic testing services - Year-over-year growth 2025-2030 (%)
Data Table on Genetic testing services - Year-over-year growth 2025-2030 (%)

9.5 Genetic materials - Market size and forecast 2025-2030

Chart on Genetic materials - Market size and forecast 2025-2030 ($ million)
Data Table on Genetic materials - Market size and forecast 2025-2030 ($ million)
Chart on Genetic materials - Year-over-year growth 2025-2030 (%)
Data Table on Genetic materials - Year-over-year growth 2025-2030 (%)

9.6 Market opportunity by Solution

Market opportunity by Solution ($ million)
Data Table on Market opportunity by Solution ($ million)

10. Market Segmentation by Technology

10.1 Market segments

Chart on Technology - Market share 2025-2030 (%)
Data Table on Technology - Market share 2025-2030 (%)

10.2 Comparison by Technology

Chart on Comparison by Technology
Data Table on Comparison by Technology

10.3 AI - Market size and forecast 2025-2030

Chart on AI - Market size and forecast 2025-2030 ($ million)
Data Table on AI - Market size and forecast 2025-2030 ($ million)
Chart on AI - Year-over-year growth 2025-2030 (%)
Data Table on AI - Year-over-year growth 2025-2030 (%)

10.4 Embryo transfer - Market size and forecast 2025-2030

Chart on Embryo transfer - Market size and forecast 2025-2030 ($ million)
Data Table on Embryo transfer - Market size and forecast 2025-2030 ($ million)
Chart on Embryo transfer - Year-over-year growth 2025-2030 (%)
Data Table on Embryo transfer - Year-over-year growth 2025-2030 (%)

10.5 Marker-assisted and genomic selection - Market size and forecast 2025-2030

Chart on Marker-assisted and genomic selection - Market size and forecast 2025-2030 ($ million)
Data Table on Marker-assisted and genomic selection - Market size and forecast 2025-2030 ($ million)
Chart on Marker-assisted and genomic selection - Year-over-year growth 2025-2030 (%)
Data Table on Marker-assisted and genomic selection - Year-over-year growth 2025-2030 (%)

10.6 CRISPR and gene editing - Market size and forecast 2025-2030

Chart on CRISPR and gene editing - Market size and forecast 2025-2030 ($ million)
Data Table on CRISPR and gene editing - Market size and forecast 2025-2030 ($ million)
Chart on CRISPR and gene editing - Year-over-year growth 2025-2030 (%)
Data Table on CRISPR and gene editing - Year-over-year growth 2025-2030 (%)

10.7 Others - Market size and forecast 2025-2030

Chart on Others - Market size and forecast 2025-2030 ($ million)
Data Table on Others - Market size and forecast 2025-2030 ($ million)
Chart on Others - Year-over-year growth 2025-2030 (%)
Data Table on Others - Year-over-year growth 2025-2030 (%)

10.8 Market opportunity by Technology

Market opportunity by Technology ($ million)
Data Table on Market opportunity by Technology ($ million)

11. Customer Landscape

11.1 Customer landscape overview

Analysis of price sensitivity, lifecycle, customer purchase basket, adoption rates, and purchase criteria

12. Geographic Landscape

12.1 Geographic segmentation

Chart on Market share by geography 2025-2030 (%)
Data Table on Market share by geography 2025-2030 (%)

12.2 Geographic comparison

Chart on Geographic comparison
Data Table on Geographic comparison

12.3 North America - Market size and forecast 2025-2030

Chart on North America - Market size and forecast 2025-2030 ($ million)
Data Table on North America - Market size and forecast 2025-2030 ($ million)
Chart on North America - Year-over-year growth 2025-2030 (%)
Data Table on North America - Year-over-year growth 2025-2030 (%)
Chart on Regional Comparison - North America
Data Table on Regional Comparison - North America

12.3.1 US - Market size and forecast 2025-2030

Chart on US - Market size and forecast 2025-2030 ($ million)
Data Table on US - Market size and forecast 2025-2030 ($ million)
Chart on US - Year-over-year growth 2025-2030 (%)
Data Table on US - Year-over-year growth 2025-2030 (%)

12.3.2 Canada - Market size and forecast 2025-2030

Chart on Canada - Market size and forecast 2025-2030 ($ million)
Data Table on Canada - Market size and forecast 2025-2030 ($ million)
Chart on Canada - Year-over-year growth 2025-2030 (%)
Data Table on Canada - Year-over-year growth 2025-2030 (%)

12.3.3 Mexico - Market size and forecast 2025-2030

Chart on Mexico - Market size and forecast 2025-2030 ($ million)
Data Table on Mexico - Market size and forecast 2025-2030 ($ million)
Chart on Mexico - Year-over-year growth 2025-2030 (%)
Data Table on Mexico - Year-over-year growth 2025-2030 (%)

12.4 Europe - Market size and forecast 2025-2030

Chart on Europe - Market size and forecast 2025-2030 ($ million)
Data Table on Europe - Market size and forecast 2025-2030 ($ million)
Chart on Europe - Year-over-year growth 2025-2030 (%)
Data Table on Europe - Year-over-year growth 2025-2030 (%)
Chart on Regional Comparison - Europe
Data Table on Regional Comparison - Europe

12.4.1 Germany - Market size and forecast 2025-2030

Chart on Germany - Market size and forecast 2025-2030 ($ million)
Data Table on Germany - Market size and forecast 2025-2030 ($ million)
Chart on Germany - Year-over-year growth 2025-2030 (%)
Data Table on Germany - Year-over-year growth 2025-2030 (%)

12.4.2 UK - Market size and forecast 2025-2030

Chart on UK - Market size and forecast 2025-2030 ($ million)
Data Table on UK - Market size and forecast 2025-2030 ($ million)
Chart on UK - Year-over-year growth 2025-2030 (%)
Data Table on UK - Year-over-year growth 2025-2030 (%)

12.4.3 France - Market size and forecast 2025-2030

Chart on France - Market size and forecast 2025-2030 ($ million)
Data Table on France - Market size and forecast 2025-2030 ($ million)
Chart on France - Year-over-year growth 2025-2030 (%)
Data Table on France - Year-over-year growth 2025-2030 (%)

12.4.4 Italy - Market size and forecast 2025-2030

Chart on Italy - Market size and forecast 2025-2030 ($ million)
Data Table on Italy - Market size and forecast 2025-2030 ($ million)
Chart on Italy - Year-over-year growth 2025-2030 (%)
Data Table on Italy - Year-over-year growth 2025-2030 (%)

12.4.5 Spain - Market size and forecast 2025-2030

Chart on Spain - Market size and forecast 2025-2030 ($ million)
Data Table on Spain - Market size and forecast 2025-2030 ($ million)
Chart on Spain - Year-over-year growth 2025-2030 (%)
Data Table on Spain - Year-over-year growth 2025-2030 (%)

12.4.6 The Netherlands - Market size and forecast 2025-2030

Chart on The Netherlands - Market size and forecast 2025-2030 ($ million)
Data Table on The Netherlands - Market size and forecast 2025-2030 ($ million)
Chart on The Netherlands - Year-over-year growth 2025-2030 (%)
Data Table on The Netherlands - Year-over-year growth 2025-2030 (%)

12.5 Asia - Market size and forecast 2025-2030

Chart on Asia - Market size and forecast 2025-2030 ($ million)
Data Table on Asia - Market size and forecast 2025-2030 ($ million)
Chart on Asia - Year-over-year growth 2025-2030 (%)
Data Table on Asia - Year-over-year growth 2025-2030 (%)
Chart on Regional Comparison - Asia
Data Table on Regional Comparison - Asia

12.5.1 China - Market size and forecast 2025-2030

Chart on China - Market size and forecast 2025-2030 ($ million)
Data Table on China - Market size and forecast 2025-2030 ($ million)
Chart on China - Year-over-year growth 2025-2030 (%)
Data Table on China - Year-over-year growth 2025-2030 (%)

12.5.2 India - Market size and forecast 2025-2030

Chart on India - Market size and forecast 2025-2030 ($ million)
Data Table on India - Market size and forecast 2025-2030 ($ million)
Chart on India - Year-over-year growth 2025-2030 (%)
Data Table on India - Year-over-year growth 2025-2030 (%)

12.5.3 Japan - Market size and forecast 2025-2030

Chart on Japan - Market size and forecast 2025-2030 ($ million)
Data Table on Japan - Market size and forecast 2025-2030 ($ million)
Chart on Japan - Year-over-year growth 2025-2030 (%)
Data Table on Japan - Year-over-year growth 2025-2030 (%)

12.5.4 South Korea - Market size and forecast 2025-2030

Chart on South Korea - Market size and forecast 2025-2030 ($ million)
Data Table on South Korea - Market size and forecast 2025-2030 ($ million)
Chart on South Korea - Year-over-year growth 2025-2030 (%)
Data Table on South Korea - Year-over-year growth 2025-2030 (%)

12.5.5 Indonesia - Market size and forecast 2025-2030

Chart on Indonesia - Market size and forecast 2025-2030 ($ million)
Data Table on Indonesia - Market size and forecast 2025-2030 ($ million)
Chart on Indonesia - Year-over-year growth 2025-2030 (%)
Data Table on Indonesia - Year-over-year growth 2025-2030 (%)

12.5.6 Thailand - Market size and forecast 2025-2030

Chart on Thailand - Market size and forecast 2025-2030 ($ million)
Data Table on Thailand - Market size and forecast 2025-2030 ($ million)
Chart on Thailand - Year-over-year growth 2025-2030 (%)
Data Table on Thailand - Year-over-year growth 2025-2030 (%)

12.6 Rest of World (ROW) - Market size and forecast 2025-2030

Chart on Rest of World (ROW) - Market size and forecast 2025-2030 ($ million)
Data Table on Rest of World (ROW) - Market size and forecast 2025-2030 ($ million)
Chart on Rest of World (ROW) - Year-over-year growth 2025-2030 (%)
Data Table on Rest of World (ROW) - Year-over-year growth 2025-2030 (%)
Chart on Regional Comparison - Rest of World (ROW)
Data Table on Regional Comparison - Rest of World (ROW)

12.6.1 Brazil - Market size and forecast 2025-2030

Chart on Brazil - Market size and forecast 2025-2030 ($ million)
Data Table on Brazil - Market size and forecast 2025-2030 ($ million)
Chart on Brazil - Year-over-year growth 2025-2030 (%)
Data Table on Brazil - Year-over-year growth 2025-2030 (%)

12.6.2 Argentina - Market size and forecast 2025-2030

Chart on Argentina - Market size and forecast 2025-2030 ($ million)
Data Table on Argentina - Market size and forecast 2025-2030 ($ million)
Chart on Argentina - Year-over-year growth 2025-2030 (%)
Data Table on Argentina - Year-over-year growth 2025-2030 (%)

12.6.3 Turkey - Market size and forecast 2025-2030

Chart on Turkey - Market size and forecast 2025-2030 ($ million)
Data Table on Turkey - Market size and forecast 2025-2030 ($ million)
Chart on Turkey - Year-over-year growth 2025-2030 (%)
Data Table on Turkey - Year-over-year growth 2025-2030 (%)

12.6.4 Saudi Arabia - Market size and forecast 2025-2030

Chart on Saudi Arabia - Market size and forecast 2025-2030 ($ million)
Data Table on Saudi Arabia - Market size and forecast 2025-2030 ($ million)
Chart on Saudi Arabia - Year-over-year growth 2025-2030 (%)
Data Table on Saudi Arabia - Year-over-year growth 2025-2030 (%)

12.6.5 South Africa - Market size and forecast 2025-2030

Chart on South Africa - Market size and forecast 2025-2030 ($ million)
Data Table on South Africa - Market size and forecast 2025-2030 ($ million)
Chart on South Africa - Year-over-year growth 2025-2030 (%)
Data Table on South Africa - Year-over-year growth 2025-2030 (%)

12.6.6 Colombia - Market size and forecast 2025-2030

Chart on Colombia - Market size and forecast 2025-2030 ($ million)
Data Table on Colombia - Market size and forecast 2025-2030 ($ million)
Chart on Colombia - Year-over-year growth 2025-2030 (%)
Data Table on Colombia - Year-over-year growth 2025-2030 (%)

12.6.7 Israel - Market size and forecast 2025-2030

Chart on Israel - Market size and forecast 2025-2030 ($ million)
Data Table on Israel - Market size and forecast 2025-2030 ($ million)
Chart on Israel - Year-over-year growth 2025-2030 (%)
Data Table on Israel - Year-over-year growth 2025-2030 (%)

12.6.8 UAE - Market size and forecast 2025-2030

Chart on UAE - Market size and forecast 2025-2030 ($ million)
Data Table on UAE - Market size and forecast 2025-2030 ($ million)
Chart on UAE - Year-over-year growth 2025-2030 (%)
Data Table on UAE - Year-over-year growth 2025-2030 (%)

12.7 Market opportunity by geography

Market opportunity by geography ($ million)
Data Tables on Market opportunity by geography ($ million)

13. Drivers, Challenges, and Opportunity

13.1 Market drivers

Surging global demand high efficiency protein drives advanced livestock selection
Commercial integration precision diagnostics trait specific disease risk screening
Rapid expansion assistive reproduction technologies commercial livestock breeding operations

13.2 Market challenges

High capital investment requirements associated advanced genomic testing infrastructure
Stringent regulatory thresholds and approval delays gene edited livestock
Bioethical concerns and consumer resistance surrounding engineered genetic traits

13.3 Impact of drivers and challenges

Impact of drivers and challenges in 2025 and 2030

13.4 Market opportunities

Strategic portfolio consolidation precision animal health integrated diagnostics platforms
Commercialization gene edited disease resistance trait commercial swine production
Widespread commercial adoption data driven genotyping services farm management ecosystems

14. Competitive Landscape

14.1 Overview

14.2

Overview on criticality of inputs and factors of differentiation

14.3 Landscape disruption

Overview on factors of disruption

14.4 Industry risks

Impact of key risks on business

15. Competitive Analysis

15.1 Companies profiled

Companies covered

15.2 Company ranking index

15.3 Market positioning of companies

Matrix on companies position and classification

15.4 Charles River Laboratories

Charles River Laboratories - Overview
Charles River Laboratories - Business segments
Charles River Laboratories - Key offerings
Charles River Laboratories - Segment focus
SWOT

15.5 Cogent

Cogent - Overview
Cogent - Product / Service
Cogent - Key offerings
SWOT

15.6 Cooperl

Cooperl - Overview
Cooperl - Product / Service
Cooperl - Key offerings
SWOT

15.7 Embark Veterinary Inc.

Embark Veterinary Inc. - Overview
Embark Veterinary Inc. - Product / Service
Embark Veterinary Inc. - Key offerings
SWOT

15.8 EW Group GmbH

EW Group GmbH - Overview
EW Group GmbH - Product / Service
EW Group GmbH - Key offerings
SWOT

15.9 Genes Diffusion

Genes Diffusion - Overview
Genes Diffusion - Product / Service
Genes Diffusion - Key offerings
SWOT

15.10 Genus Plc

Genus Plc - Overview
Genus Plc - Business segments
Genus Plc - Key offerings
Genus Plc - Segment focus
SWOT

15.11 Groupe Grimaud La Corbiere SA

Groupe Grimaud La Corbiere SA - Overview
Groupe Grimaud La Corbiere SA - Product / Service
Groupe Grimaud La Corbiere SA - Key offerings
SWOT

15.12 Hendrix Genetics BV

Hendrix Genetics BV - Overview
Hendrix Genetics BV - Product / Service
Hendrix Genetics BV - Key offerings
SWOT

15.13 Inotiv Inc.

Inotiv Inc. - Overview
Inotiv Inc. - Product / Service
Inotiv Inc. - Key offerings
SWOT

15.14 Masterrind GmbH

Masterrind GmbH - Overview
Masterrind GmbH - Product / Service
Masterrind GmbH - Key offerings
SWOT

15.15 Minitub GmbH

Minitub GmbH - Overview
Minitub GmbH - Product / Service
Minitub GmbH - Key offerings
SWOT

15.16 Neogen Corp.

Neogen Corp. - Overview
Neogen Corp. - Business segments
Neogen Corp. - Key offerings
Neogen Corp. - Segment focus
SWOT

15.17 Select Sires Inc.

Select Sires Inc. - Overview
Select Sires Inc. - Product / Service
Select Sires Inc. - Key offerings
SWOT

15.18 Zoetis Inc.

Zoetis Inc. - Overview
Zoetis Inc. - Business segments
Zoetis Inc. - Key offerings
Zoetis Inc. - Segment focus
SWOT

16. Appendix

16.1 Scope of the report

Market definition
Objectives
Notes and caveats

16.2 Inclusions and exclusions checklist

Inclusions checklist
Exclusions checklist

16.3 Currency conversion rates for US$

16.4 Research methodology

16.5 Data procurement

Information sources

16.6 Data validation

16.7 Validation techniques employed for market sizing

16.8 Data synthesis

16.9 360 degree market analysis

16.10 List of abbreviations

Research Methodology

Technavio presents a detailed picture of the market by way of study, synthesis, and summation of data from multiple sources. The analysts have presented the various facets of the market with a particular focus on identifying the key industry influencers. The data thus presented is comprehensive, reliable, and the result of extensive research, both primary and secondary.

INFORMATION SOURCES

Primary sources

  • Manufacturers and suppliers
  • Channel partners
  • Industry experts
  • Strategic decision makers

Secondary sources

  • Industry journals and periodicals
  • Government data
  • Financial reports of key industry players
  • Historical data
  • Press releases

DATA ANALYSIS

Data Synthesis

  • Collation of data
  • Estimation of key figures
  • Analysis of derived insights

Data Validation

  • Triangulation with data models
  • Reference against proprietary databases
  • Corroboration with industry experts

REPORT WRITING

Qualitative

  • Market drivers
  • Market challenges
  • Market trends
  • Five forces analysis

Quantitative

  • Market size and forecast
  • Market segmentation
  • Geographical insights
  • Competitive landscape

Interested in this report?

Get your sample now to see our research methodology and insights!

Download Now

Frequently Asked Questions

Animal Genetics market growth will increase by USD 3221.9 million during 2026-2030.

The Animal Genetics market is expected to grow at a CAGR of 8% during 2026-2030.

Animal Genetics market is segmented by End-user (Research centers, Hospitals and clinics, Diagnostic centers) Solution (Live animal, Genetic testing services, Genetic materials) Technology (AI, Embryo transfer, Marker-assisted and genomic selection, CRISPR and gene editing, Others)

Charles River Laboratories, Cogent, Cooperatie Koninklijke CRV, Cooperl, DanBred PS, Embark Veterinary Inc., EW Group GmbH, Genes Diffusion, Genus Plc, Groupe Grimaud La Corbiere SA, Hendrix Genetics BV, Inotiv Inc., Masterrind GmbH, Minitub GmbH, Neogen Corp., Select Sires Inc., STgenetics, Swissgenetics, The Semex Alliance, Zoetis Inc. are a few of the key vendors in the Animal Genetics market.

Europe will register the highest growth rate of 33.7% among the other regions. Therefore, the Animal Genetics market in Europe is expected to garner significant business opportunities for the vendors during the forecast period.

US, Canada, Mexico, Germany, UK, France, Italy, Spain, The Netherlands, China, India, Japan, South Korea, Indonesia, Thailand, Brazil, Argentina, Turkey, Saudi Arabia, South Africa, Colombia, Israel, UAE

  • Surging global demand high efficiency protein drives advanced livestock selection is the driving factor this market.

The Animal Genetics market vendors should focus on grabbing business opportunities from the End-user segment as it accounted for the largest market share in the base year.
RIA - Research AI Assistant
Ask RIA
