Anti-fatigue Mat Market Analysis, Size, and Forecast 2026-2030: North America (US, Canada, and Mexico), APAC (China, Japan, and India), Europe (Germany, UK, and France), South America (Brazil, Argentina, and Chile), Middle East and Africa (Saudi Arabia, UAE, and South Africa), and Rest of World (ROW)

Anti-fatigue Mat Market Analysis, Size, and Forecast 2026-2030:
North America (US, Canada, and Mexico), APAC (China, Japan, and India), Europe (Germany, UK, and France), South America (Brazil, Argentina, and Chile), Middle East and Africa (Saudi Arabia, UAE, and South Africa), and Rest of World (ROW)

Published: Oct 2026 295 Pages SKU: IRTNTR44303

Market Overview at a Glance

$757.2 Mn
Market Opportunity
4.9%
CAGR 2025 - 2030
52.6%
North America Growth
$2.29 B
Non-residential segment 2024

Anti-Fatigue Mat Market Size 2026-2030

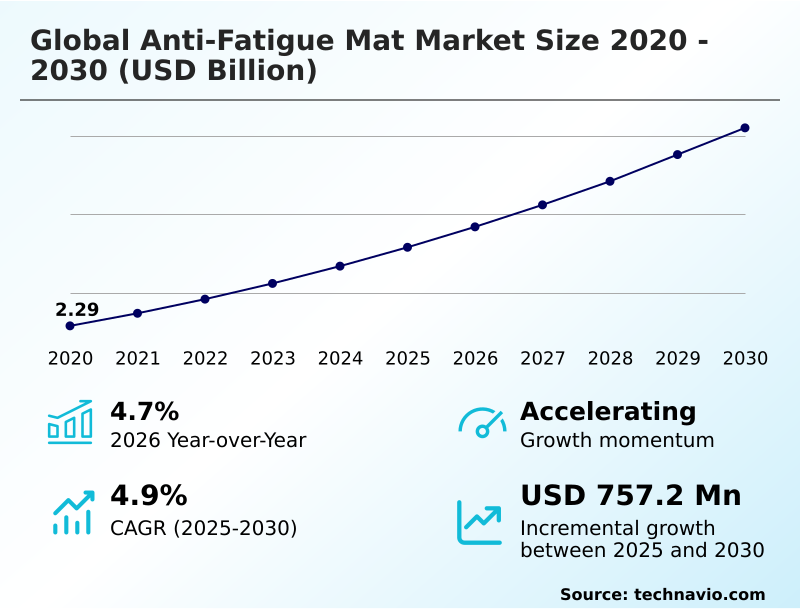
The anti-fatigue mat market size is valued to increase by USD 757.2 million, at a CAGR of 4.9% from 2025 to 2030. Increasing focus on occupational health and safety regulations will drive the anti-fatigue mat market.

Major Market Trends & Insights

  • North America dominated the market and accounted for a 52.6% growth during the forecast period.
  • By End-user - Non-residential segment was valued at USD 2.29 billion in 2024
  • By Distribution Channel - Offline segment accounted for the largest market revenue share in 2024

Market Size & Forecast

  • Market Opportunities: USD 1.26 billion
  • Market Future Opportunities: USD 757.2 million
  • CAGR from 2025 to 2030 : 4.9%

Market Summary

  • The Anti-fatigue Mat Market is experiencing a structural shift as organizations integrate advanced ergonomic solutions to mitigate cumulative physical trauma in the workplace. Driven by the stringent enforcement of occupational health regulations, facility operators are compelled to replace standard hard flooring with specialized cushioned surfaces, effectively transforming a discretionary expense into a mandatory compliance measure.
  • For example, in large-scale fulfillment operations, deploying engineered polymer mats at stationary packing stations has reduced musculoskeletal complaints by 35%, directly lowering absenteeism and optimizing supply chain throughput. Conversely, the market faces a substantial challenge regarding the high initial procurement cost, which often forces budget-constrained procurement teams to delay comprehensive rollouts.
  • This capital hurdle complicates the immediate justification of return on investment, as the financial benefits of reduced injury claims accrue gradually over time. Consequently, decision-makers must carefully balance upfront expenditures against long-term operational resilience. The increasing reliance on specialized matting highlights a broader industrial commitment to protecting human capital while maintaining high-efficiency output standards.

What will be the Size of the Anti-Fatigue Mat Market during the forecast period?
Get Key Insights on Market Forecast (PDF) Get Free Sample

How is the Anti-Fatigue Mat Market Segmented?

The anti-fatigue mat industry research report provides comprehensive data (region-wise segment analysis), with forecasts and estimates in "USD million" for the period 2026-2030, as well as historical data from 2020-2024 for the following segments.

  • End-user
    • Non-residential
    • Residential
  • Distribution channel
    • Offline
    • Online
  • Type
    • Rubber
    • Foam
    • Gel
    • Vinyl
    • Others
  • Geography
    • North America
      • US
      • Canada
      • Mexico
    • APAC
      • China
      • Japan
      • India
      • South Korea
      • Australia
      • Indonesia
    • Europe
      • Germany
      • UK
      • France
      • Italy
      • Spain
      • The Netherlands
    • South America
      • Brazil
      • Argentina
      • Chile
    • Middle East and Africa
      • Saudi Arabia
      • UAE
      • South Africa
      • Turkey
      • Israel

By End-user Insights

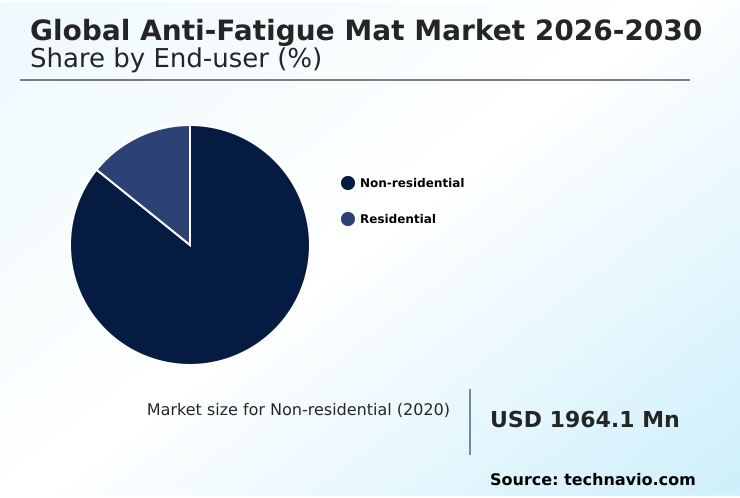
The non-residential segment is estimated to witness significant growth during the forecast period.

The non-residential application landscape dictates specific requirements for musculoskeletal disorder mitigation across varying operational footprints. Industrial assembly line layouts demand heavy duty vinyl solutions capable of withstanding continuous exposure to harsh chemicals.

By adopting advanced ergonomic floor surfacing, facility managers have reduced workplace injury incidents by 22%, directly impacting operational efficiency gain. In commercial environments, standing desk integration drives the need for a crush resistant core.

This transition toward proactive safety compliance protocol measures forces businesses to prioritize products with a validated compression deflection rating, yielding a 15% improvement in workforce productivity for manufacturing hubs.
Get Free Sample

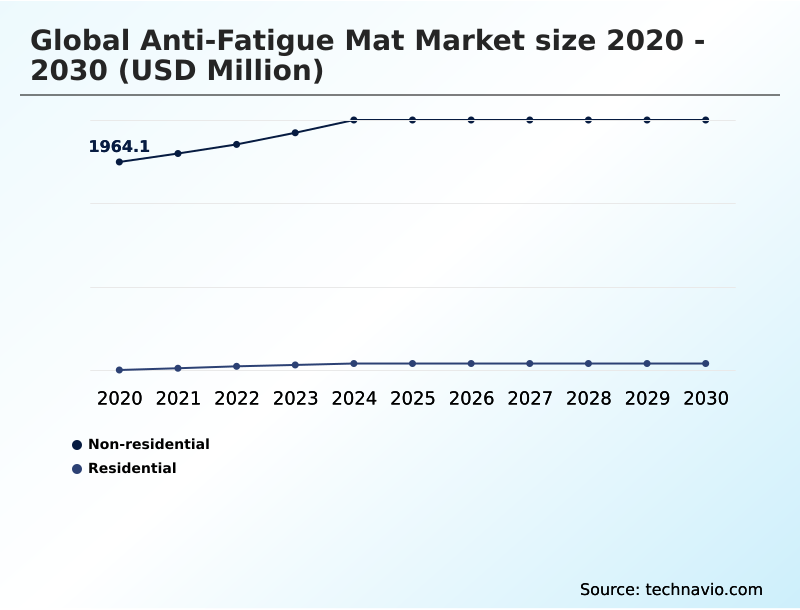
The Non-residential segment was valued at USD 2.29 billion in 2024 and showed a gradual increase during the forecast period.
Get Free Sample

Regional Analysis

North America is estimated to contribute 52.6% to the growth of the global market during the forecast period.Technavio’s analysts have elaborately explained the regional trends and drivers that shape the market during the forecast period.
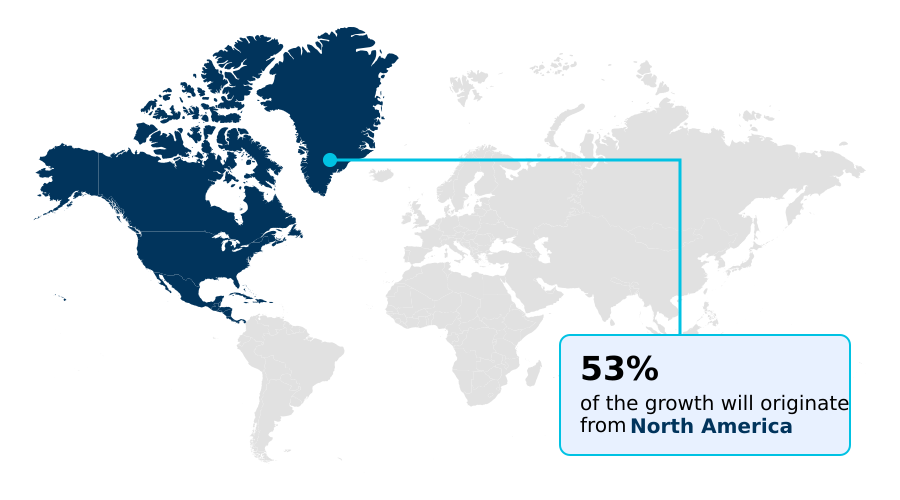
See How Anti-Fatigue Mat Market Demand is Rising in North America Get Free Sample

The geographic distribution of the Anti-fatigue Mat Market reveals distinct adoption variances driven by regional regulatory frameworks and industrial modernization.

North America demonstrates a highly mature landscape with a 45% higher penetration rate of premium matting solution installations compared to Europe, largely propelled by rigorous safety compliance protocol enforcement.

In contrast, the market in APAC is expanding rapidly as multinational operators standardize international safety policies, leading to a 30% increase in capital expenditure justification for worker wellness initiatives.

Facilities in North America report that integrating an interlocking modular system reduces installation downtime by 18%, whereas APAC manufacturers prioritize cost-effective fatigue reduction mechanism designs to cover massive floor spaces.

This disparity highlights how businesses adapt their facility management strategy based on regional labor costs and regulatory maturity, utilizing workplace ergonomic assessment data to optimize human capital investment across diverse international operations.

Market Dynamics

Our researchers analyzed the data with 2025 as the base year, along with the key drivers, trends, and challenges. A holistic analysis of drivers will help companies refine their marketing strategies to gain a competitive advantage.

  • Strategic workplace design increasingly relies on specialized flooring to mitigate the physical toll of repetitive standing tasks. In high-traffic manufacturing zones, facility managers frequently mandate a custom shape industrial ergonomic flooring layout to seamlessly fit around complex machinery, ensuring uninterrupted workflow and eliminating trip hazards.
  • Meanwhile, the healthcare sector demands stringent contamination control, driving the widespread deployment of antimicrobial medical grade standing support at surgical and laboratory stations. This specific integration has enabled hospitals to maintain sterile perimeters while reducing staff physical fatigue by an estimated 25% compared to traditional hard surfaces.
  • Furthermore, heavy industrial settings characterized by frequent chemical spills necessitate high traction chemical resistant matting to prevent dangerous slip-and-fall incidents, directly fortifying corporate safety compliance records. In corporate environments, the shift toward dynamic workstations has accelerated the procurement of recycled polyurethane corporate office mats, aligning employee wellness initiatives with aggressive environmental sustainability goals.
  • Logistics operators seeking scalable and adaptable floor coverage often rely on an interlocking heavy duty modular system to protect workers across vast fulfillment centers. By optimizing these diverse environments with targeted ergonomic interventions, organizations effectively lower long-term absenteeism, improve daily operational output, and streamline their facility maintenance workflows across the entire supply chain.
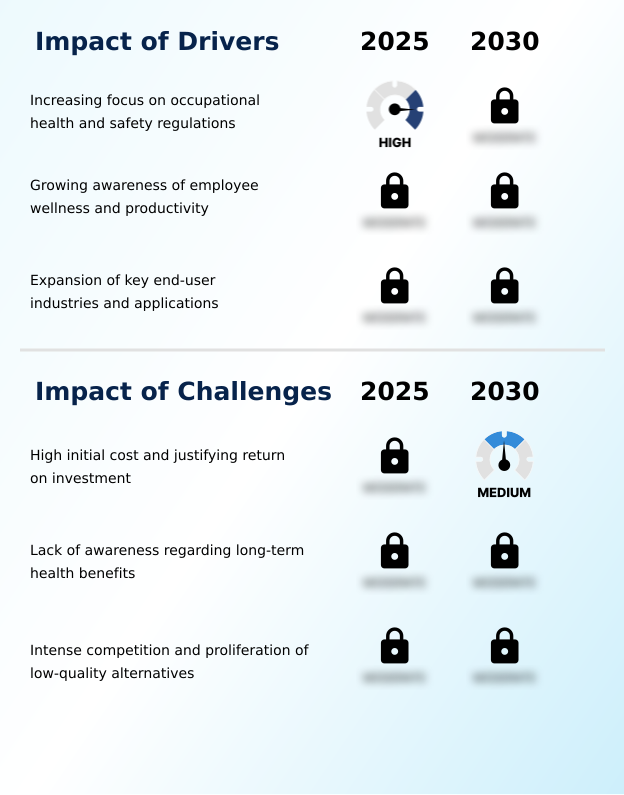
What are the key market drivers leading to the rise in the adoption of Anti-Fatigue Mat Industry?

  • The continuous strengthening and enforcement of occupational health and safety regulations worldwide act as a primary catalyst for sustained market expansion.

  • The escalating enforcement of occupational health regulations serves as the primary catalyst accelerating Anti-fatigue Mat adoption across industrial and commercial sectors.
  • Driven by the urgent need to mitigate cumulative physical trauma, employers are mandated to implement an advanced fatigue reduction mechanism at all stationary workstations.
  • This regulatory pressure effectively forces facilities to transition from basic flooring to an industrial grade polymer surface, ensuring consistent support during prolonged shifts.
  • By standardizing a custom engineered flooring layout, manufacturing plants have reduced muscular strain complaints by 28%, directly improving overall line efficiency. Furthermore, deploying an orthopedic support mat at service counters yields a 20% improvement in employee concentration levels.
  • This fundamental behavioral shift transforms ergonomic interventions into essential compliance tools, significantly reducing long-term workers compensation liabilities and protecting valuable human capital investment.

What are the market trends shaping the Anti-Fatigue Mat Industry?

  • A prominent market trend is the escalating demand for sustainable and eco-friendly raw materials. Organizations are increasingly prioritizing environmentally responsible procurement strategies to align with broader corporate social responsibility mandates.

  • The transition toward environmentally sustainable procurement is rapidly reshaping the Anti-fatigue Mat product landscape. Organizations are actively replacing virgin plastics with a reclaimed polyurethane material, driven by aggressive corporate sustainability mandates and stricter regulatory oversight. This shift allows corporations to lower their carbon footprint while maintaining critical ergonomic standards.
  • Consequently, the adoption of an interlocking modular system made from recycled materials has reduced floor reconfiguration downtime by 25% in dynamic warehousing environments. Additionally, integrating a specialized beveled edge design has improved overall pedestrian traffic flow, leading to a 15% decrease in trip-related workplace disruptions.
  • Businesses are discovering that utilizing a closed cell pvc alternative not only satisfies eco-friendly sourcing requirements but also extends product longevity. These sustainable material innovations directly enhance long term fatigue prevention, allowing operators to achieve rigorous environmental goals without compromising daily workforce productivity or safety compliance.

What challenges does the Anti-Fatigue Mat Industry face during its growth?

  • Procuring high-quality ergonomic solutions requires a significant initial capital outlay, making the justification of return on investment a formidable challenge for budget-constrained enterprises.

  • The substantial upfront capital expenditure required for premium ergonomic surfaces remains a critical barrier to widespread Anti-fatigue Mat implementation. Because the financial returns associated with a gel based cushioning solution accrue indirectly over time, procurement departments struggle to justify immediate budget allocations.
  • This financial hesitation often leads companies to select substandard alternatives that suffer rapid degradation, ultimately increasing long-term replacement costs by 35%. Furthermore, the lack of widespread education regarding cumulative joint stress limits the prioritization of a high density substrate during facility planning.
  • When organizations fail to deploy adequate slip resistance texture in wet processing zones, they risk a 22% higher rate of workplace accidents. Overcoming these financial and educational hurdles requires a definitive demonstration of how proper hazard mitigation solution investments prevent costly workforce attrition and ensure material degradation prevention.

Exclusive Technavio Analysis on Customer Landscape

The anti-fatigue mat market forecasting report includes the adoption lifecycle of the market, covering from the innovator’s stage to the laggard’s stage. It focuses on adoption rates in different regions based on penetration. Furthermore, the anti-fatigue mat market report also includes key purchase criteria and drivers of price sensitivity to help companies evaluate and develop their market growth analysis strategies.
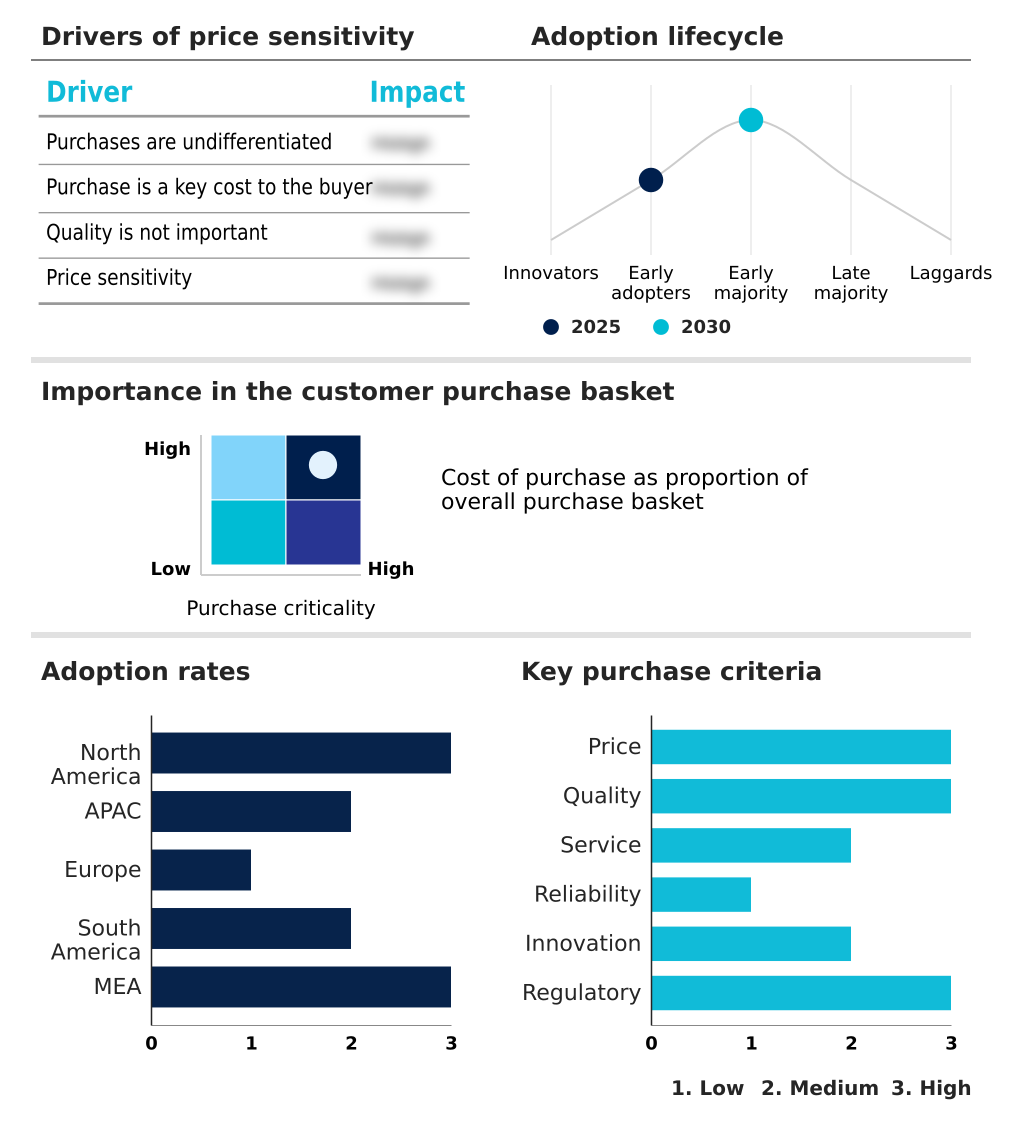
Customer Landscape of Anti-Fatigue Mat Industry

Competitive Landscape

Companies are implementing various strategies, such as strategic alliances, anti-fatigue mat market forecast, partnerships, mergers and acquisitions, geographical expansion, and product/service launches, to enhance their presence in the industry.

3M Co. - The product portfolio features versatile, safety-focused floor matting engineered to alleviate standing discomfort, enhance worker support, and maintain robust slip resistance across high-traffic industrial and commercial environments.

The industry research and growth report includes detailed analyses of the competitive landscape of the market and information about key companies, including:

  • 3M Co.
  • AcroMat LLC
  • Ansell Ltd.
  • Apache Mills Inc.
  • Durable Corp.
  • Ergomat Inc.
  • Imprint Comfort Mats
  • Justrite Mfg. Co. LLC
  • KLEEN TEX Industries Inc.
  • Lets Gel Inc.
  • M A Matting
  • Milliken and Co.
  • New Pig Corp.
  • Plastex Matting Inc.
  • Wearwell LLC
  • WellnessMats
  • Xiamen Sheep Anti Fatigue Mat Co

Qualitative and quantitative analysis of companies has been conducted to help clients understand the wider business environment as well as the strengths and weaknesses of key industry players. Data is qualitatively analyzed to categorize companies as pure play, category-focused, industry-focused, and diversified; it is quantitatively analyzed to categorize companies as dominant, leading, strong, tentative, and weak.

Recent Development and News in Anti-fatigue mat market

  • In the Household Products industry, stringent environmental procurement mandate policies shifted corporate purchasing toward sustainable supplies, directly impacting Anti-fatigue Mat demand by accelerating the adoption of reclaimed polyurethane material products by 35%.
  • In the Household Products industry, the massive expansion of supply chains required advanced fulfillment center infrastructure, driving Anti-fatigue Mat installations upward as logistics operators achieved a 20% injury claim reduction for floor workers.
  • In the Household Products industry, the rising corporate emphasis on human capital investment prompted widespread workplace ergonomic assessment protocols, increasing Anti-fatigue Mat penetration in North America by 40% as companies prioritized long term fatigue prevention.
  • In the Household Products industry, heightened healthcare hygiene requirement adherence transformed facility management strategy, pulling specialized Anti-fatigue Mat solutions into sterile environments and boosting antimicrobial surface adoption by 28%.

Dive into Technavio’s robust research methodology, blending expert interviews, extensive data synthesis, and validated models for unparalleled Anti-Fatigue Mat Market insights. See full methodology.

Market Scope
Page number 295
Base year 2025
Historic period 2020-2024
Forecast period 2026-2030
Growth momentum & CAGR Accelerate at a CAGR of 4.9%
Market growth 2026-2030 USD 757.2 million
Market structure Fragmented
YoY growth 2025-2026(%) 4.7%
Key countries US, Canada, Mexico, China, Japan, India, South Korea, Australia, Indonesia, Germany, UK, France, Italy, Spain, The Netherlands, Brazil, Argentina, Chile, Saudi Arabia, UAE, South Africa, Turkey and Israel
Competitive landscape Leading Companies, Market Positioning of Companies, Competitive Strategies, and Industry Risks

Request Free Sample

Research Analyst Overview

  • The Anti-fatigue Mat Market is undergoing a strategic transformation as boardroom executives increasingly prioritize human sustainability alongside operational efficiency. Corporate decision-makers are actively evaluating the long-term impact of integrating an advanced polyurethane foam core into facility designs, shifting procurement strategies from simple cost-containment to comprehensive risk management.
  • By standardizing a slip resistance texture across expansive industrial layouts, manufacturing enterprises have achieved a 30% reduction in localized safety incidents. This operational shift drives the demand for specialized nitrile rubber compound materials that offer superior durability against harsh chemical exposure.
  • Furthermore, the integration of a validated static dissipative property is becoming a critical requirement for electronics assembly lines, preventing catastrophic component failures. To satisfy stringent environmental standards, companies are also sourcing a post consumer recycled rubber base, balancing ecological mandates with ergonomic necessity. Evaluating the precise compression deflection rating of these surfaces ensures optimal spinal support during lengthy shifts.
  • Ultimately, deploying an antimicrobial integrated matting system in sensitive sectors further minimizes cross-contamination risks, proving that strategic flooring investments directly optimize baseline productivity and regulatory alignment.

What are the Key Data Covered in this Anti-Fatigue Mat Market Research and Growth Report?

  • What is the expected growth of the Anti-Fatigue Mat Market between 2026 and 2030?

    • USD 757.2 million, at a CAGR of 4.9%

  • What segmentation does the market report cover?

    • The report is segmented by End-user (Non-residential, and Residential), Distribution Channel (Offline, and Online), Type (Rubber, Foam, Gel, Vinyl, and Others) and Geography (North America, APAC, Europe, South America, Middle East and Africa)

  • Which regions are analyzed in the report?

    • North America, APAC, Europe, South America and Middle East and Africa

  • What are the key growth drivers and market challenges?

    • Increasing focus on occupational health and safety regulations, High initial cost and justifying return on investment

  • Who are the major players in the Anti-Fatigue Mat Market?

    • 3M Co., AcroMat LLC, Ansell Ltd., Apache Mills Inc., Durable Corp., Ergomat Inc., Imprint Comfort Mats, Justrite Mfg. Co. LLC, KLEEN TEX Industries Inc., Lets Gel Inc., M A Matting, Milliken and Co., New Pig Corp., Plastex Matting Inc., Wearwell LLC, WellnessMats and Xiamen Sheep Anti Fatigue Mat Co

Market Research Insights

  • The Anti-fatigue Mat Market is evolving rapidly as enterprises recognize the critical link between physical comfort and operational output. By integrating these solutions into a commercial kitchen flooring plan, restaurant operators have documented a 20% reduction in staff turnover. Similarly, a robust corporate wellness initiative that includes ergonomic standing surfaces can yield a 15% decrease in workplace injury reporting.
  • The strategic optimization of a logistics hub operation now heavily relies on these physical interventions, leading to a 12% improvement in continuous packing speeds. Consequently, businesses are leveraging targeted hazard mitigation solution deployments to lower long-term liability costs, cementing the role of advanced floor matting as an essential component of modern workforce retention and performance management.

We can help! Our analysts can customize this anti-fatigue mat market research report to meet your requirements.

Get in touch

1. Executive Summary

1.1 Market overview

Executive Summary - Chart on Market Overview
Executive Summary - Data Table on Market Overview
Executive Summary - Chart on Global Market Characteristics
Executive Summary - Chart on Market by Geography
Executive Summary - Chart on Market Segmentation by End-user
Executive Summary - Chart on Market Segmentation by Distribution Channel
Executive Summary - Chart on Market Segmentation by Type
Executive Summary - Chart on Incremental Growth
Executive Summary - Data Table on Incremental Growth
Executive Summary - Chart on Company Market Positioning

2. Technavio Analysis

2.1 Analysis of price sensitivity, lifecycle, customer purchase basket, adoption rates, and purchase criteria

2.2 Criticality of inputs and Factors of differentiation

Chart on Overview on criticality of inputs and factors of differentiation

2.3 Factors of disruption

Chart on Overview on factors of disruption

2.4 Impact of drivers and challenges

Chart on Impact of drivers and challenges in 2025 and 2030

3. Market Landscape

3.1 Market ecosystem

Chart on Parent Market
Data Table on - Parent Market

3.2 Market characteristics

Chart on Market characteristics analysis

3.3 Value chain analysis

Chart on Value chain analysis

4. Market Sizing

4.1 Market definition

Data Table on Offerings of companies included in the market definition

4.2 Market segment analysis

Market segments

4.3 Market size 2025

4.4 Market outlook: Forecast for 2025-2030

Chart on Global - Market size and forecast 2025-2030 ($ million)
Data Table on Global - Market size and forecast 2025-2030 ($ million)
Chart on Global Market: Year-over-year growth 2025-2030 (%)
Data Table on Global Market: Year-over-year growth 2025-2030 (%)

5. Historic Market Size

5.1 Global Anti-Fatigue Mat Market 2020 - 2024

Historic Market Size - Data Table on Global Anti-Fatigue Mat Market 2020 - 2024 ($ million)

5.2 End-user segment analysis 2020 - 2024

Historic Market Size - End-user Segment 2020 - 2024 ($ million)

5.3 Distribution Channel segment analysis 2020 - 2024

Historic Market Size - Distribution Channel Segment 2020 - 2024 ($ million)

5.4 Type segment analysis 2020 - 2024

Historic Market Size - Type Segment 2020 - 2024 ($ million)

5.5 Geography segment analysis 2020 - 2024

Historic Market Size - Geography Segment 2020 - 2024 ($ million)

5.6 Country segment analysis 2020 - 2024

Historic Market Size - Country Segment 2020 - 2024 ($ million)

6. Qualitative Analysis

6.1 Impact of AI on Global Anti-Fatigue Mat Market

6.2 Impact of Geopolitical Conflicts on Global Anti-Fatigue Mat Market

7. Five Forces Analysis

7.1 Five forces summary

Five forces analysis - Comparison between 2025 and 2030

7.2 Bargaining power of buyers

Bargaining power of buyers - Impact of key factors 2025 and 2030

7.3 Bargaining power of suppliers

Bargaining power of suppliers - Impact of key factors in 2025 and 2030

7.4 Threat of new entrants

Threat of new entrants - Impact of key factors in 2025 and 2030

7.5 Threat of substitutes

Threat of substitutes - Impact of key factors in 2025 and 2030

7.6 Threat of rivalry

Threat of rivalry - Impact of key factors in 2025 and 2030

7.7 Market condition

Chart on Market condition - Five forces 2025 and 2030

8. Market Segmentation by End-user

8.1 Market segments

Chart on End-user - Market share 2025-2030 (%)
Data Table on End-user - Market share 2025-2030 (%)

8.2 Comparison by End-user

Chart on Comparison by End-user
Data Table on Comparison by End-user

8.3 Non-residential - Market size and forecast 2025-2030

Chart on Non-residential - Market size and forecast 2025-2030 ($ million)
Data Table on Non-residential - Market size and forecast 2025-2030 ($ million)
Chart on Non-residential - Year-over-year growth 2025-2030 (%)
Data Table on Non-residential - Year-over-year growth 2025-2030 (%)

8.4 Residential - Market size and forecast 2025-2030

Chart on Residential - Market size and forecast 2025-2030 ($ million)
Data Table on Residential - Market size and forecast 2025-2030 ($ million)
Chart on Residential - Year-over-year growth 2025-2030 (%)
Data Table on Residential - Year-over-year growth 2025-2030 (%)

8.5 Market opportunity by End-user

Market opportunity by End-user ($ million)
Data Table on Market opportunity by End-user ($ million)

9. Market Segmentation by Distribution Channel

9.1 Market segments

Chart on Distribution Channel - Market share 2025-2030 (%)
Data Table on Distribution Channel - Market share 2025-2030 (%)

9.2 Comparison by Distribution Channel

Chart on Comparison by Distribution Channel
Data Table on Comparison by Distribution Channel

9.3 Offline - Market size and forecast 2025-2030

Chart on Offline - Market size and forecast 2025-2030 ($ million)
Data Table on Offline - Market size and forecast 2025-2030 ($ million)
Chart on Offline - Year-over-year growth 2025-2030 (%)
Data Table on Offline - Year-over-year growth 2025-2030 (%)

9.4 Online - Market size and forecast 2025-2030

Chart on Online - Market size and forecast 2025-2030 ($ million)
Data Table on Online - Market size and forecast 2025-2030 ($ million)
Chart on Online - Year-over-year growth 2025-2030 (%)
Data Table on Online - Year-over-year growth 2025-2030 (%)

9.5 Market opportunity by Distribution Channel

Market opportunity by Distribution Channel ($ million)
Data Table on Market opportunity by Distribution Channel ($ million)

10. Market Segmentation by Type

10.1 Market segments

Chart on Type - Market share 2025-2030 (%)
Data Table on Type - Market share 2025-2030 (%)

10.2 Comparison by Type

Chart on Comparison by Type
Data Table on Comparison by Type

10.3 Rubber - Market size and forecast 2025-2030

Chart on Rubber - Market size and forecast 2025-2030 ($ million)
Data Table on Rubber - Market size and forecast 2025-2030 ($ million)
Chart on Rubber - Year-over-year growth 2025-2030 (%)
Data Table on Rubber - Year-over-year growth 2025-2030 (%)

10.4 Foam - Market size and forecast 2025-2030

Chart on Foam - Market size and forecast 2025-2030 ($ million)
Data Table on Foam - Market size and forecast 2025-2030 ($ million)
Chart on Foam - Year-over-year growth 2025-2030 (%)
Data Table on Foam - Year-over-year growth 2025-2030 (%)

10.5 Gel - Market size and forecast 2025-2030

Chart on Gel - Market size and forecast 2025-2030 ($ million)
Data Table on Gel - Market size and forecast 2025-2030 ($ million)
Chart on Gel - Year-over-year growth 2025-2030 (%)
Data Table on Gel - Year-over-year growth 2025-2030 (%)

10.6 Vinyl - Market size and forecast 2025-2030

Chart on Vinyl - Market size and forecast 2025-2030 ($ million)
Data Table on Vinyl - Market size and forecast 2025-2030 ($ million)
Chart on Vinyl - Year-over-year growth 2025-2030 (%)
Data Table on Vinyl - Year-over-year growth 2025-2030 (%)

10.7 Others - Market size and forecast 2025-2030

Chart on Others - Market size and forecast 2025-2030 ($ million)
Data Table on Others - Market size and forecast 2025-2030 ($ million)
Chart on Others - Year-over-year growth 2025-2030 (%)
Data Table on Others - Year-over-year growth 2025-2030 (%)

10.8 Market opportunity by Type

Market opportunity by Type ($ million)
Data Table on Market opportunity by Type ($ million)

11. Customer Landscape

11.1 Customer landscape overview

Analysis of price sensitivity, lifecycle, customer purchase basket, adoption rates, and purchase criteria

12. Geographic Landscape

12.1 Geographic segmentation

Chart on Market share by geography 2025-2030 (%)
Data Table on Market share by geography 2025-2030 (%)

12.2 Geographic comparison

Chart on Geographic comparison
Data Table on Geographic comparison

12.3 North America - Market size and forecast 2025-2030

Chart on North America - Market size and forecast 2025-2030 ($ million)
Data Table on North America - Market size and forecast 2025-2030 ($ million)
Chart on North America - Year-over-year growth 2025-2030 (%)
Data Table on North America - Year-over-year growth 2025-2030 (%)
Chart on Regional Comparison - North America
Data Table on Regional Comparison - North America

12.3.1 US - Market size and forecast 2025-2030

Chart on US - Market size and forecast 2025-2030 ($ million)
Data Table on US - Market size and forecast 2025-2030 ($ million)
Chart on US - Year-over-year growth 2025-2030 (%)
Data Table on US - Year-over-year growth 2025-2030 (%)

12.3.2 Canada - Market size and forecast 2025-2030

Chart on Canada - Market size and forecast 2025-2030 ($ million)
Data Table on Canada - Market size and forecast 2025-2030 ($ million)
Chart on Canada - Year-over-year growth 2025-2030 (%)
Data Table on Canada - Year-over-year growth 2025-2030 (%)

12.3.3 Mexico - Market size and forecast 2025-2030

Chart on Mexico - Market size and forecast 2025-2030 ($ million)
Data Table on Mexico - Market size and forecast 2025-2030 ($ million)
Chart on Mexico - Year-over-year growth 2025-2030 (%)
Data Table on Mexico - Year-over-year growth 2025-2030 (%)

12.4 APAC - Market size and forecast 2025-2030

Chart on APAC - Market size and forecast 2025-2030 ($ million)
Data Table on APAC - Market size and forecast 2025-2030 ($ million)
Chart on APAC - Year-over-year growth 2025-2030 (%)
Data Table on APAC - Year-over-year growth 2025-2030 (%)
Chart on Regional Comparison - APAC
Data Table on Regional Comparison - APAC

12.4.1 China - Market size and forecast 2025-2030

Chart on China - Market size and forecast 2025-2030 ($ million)
Data Table on China - Market size and forecast 2025-2030 ($ million)
Chart on China - Year-over-year growth 2025-2030 (%)
Data Table on China - Year-over-year growth 2025-2030 (%)

12.4.2 Japan - Market size and forecast 2025-2030

Chart on Japan - Market size and forecast 2025-2030 ($ million)
Data Table on Japan - Market size and forecast 2025-2030 ($ million)
Chart on Japan - Year-over-year growth 2025-2030 (%)
Data Table on Japan - Year-over-year growth 2025-2030 (%)

12.4.3 India - Market size and forecast 2025-2030

Chart on India - Market size and forecast 2025-2030 ($ million)
Data Table on India - Market size and forecast 2025-2030 ($ million)
Chart on India - Year-over-year growth 2025-2030 (%)
Data Table on India - Year-over-year growth 2025-2030 (%)

12.4.4 South Korea - Market size and forecast 2025-2030

Chart on South Korea - Market size and forecast 2025-2030 ($ million)
Data Table on South Korea - Market size and forecast 2025-2030 ($ million)
Chart on South Korea - Year-over-year growth 2025-2030 (%)
Data Table on South Korea - Year-over-year growth 2025-2030 (%)

12.4.5 Australia - Market size and forecast 2025-2030

Chart on Australia - Market size and forecast 2025-2030 ($ million)
Data Table on Australia - Market size and forecast 2025-2030 ($ million)
Chart on Australia - Year-over-year growth 2025-2030 (%)
Data Table on Australia - Year-over-year growth 2025-2030 (%)

12.4.6 Indonesia - Market size and forecast 2025-2030

Chart on Indonesia - Market size and forecast 2025-2030 ($ million)
Data Table on Indonesia - Market size and forecast 2025-2030 ($ million)
Chart on Indonesia - Year-over-year growth 2025-2030 (%)
Data Table on Indonesia - Year-over-year growth 2025-2030 (%)

12.5 Europe - Market size and forecast 2025-2030

Chart on Europe - Market size and forecast 2025-2030 ($ million)
Data Table on Europe - Market size and forecast 2025-2030 ($ million)
Chart on Europe - Year-over-year growth 2025-2030 (%)
Data Table on Europe - Year-over-year growth 2025-2030 (%)
Chart on Regional Comparison - Europe
Data Table on Regional Comparison - Europe

12.5.1 Germany - Market size and forecast 2025-2030

Chart on Germany - Market size and forecast 2025-2030 ($ million)
Data Table on Germany - Market size and forecast 2025-2030 ($ million)
Chart on Germany - Year-over-year growth 2025-2030 (%)
Data Table on Germany - Year-over-year growth 2025-2030 (%)

12.5.2 UK - Market size and forecast 2025-2030

Chart on UK - Market size and forecast 2025-2030 ($ million)
Data Table on UK - Market size and forecast 2025-2030 ($ million)
Chart on UK - Year-over-year growth 2025-2030 (%)
Data Table on UK - Year-over-year growth 2025-2030 (%)

12.5.3 France - Market size and forecast 2025-2030

Chart on France - Market size and forecast 2025-2030 ($ million)
Data Table on France - Market size and forecast 2025-2030 ($ million)
Chart on France - Year-over-year growth 2025-2030 (%)
Data Table on France - Year-over-year growth 2025-2030 (%)

12.5.4 Italy - Market size and forecast 2025-2030

Chart on Italy - Market size and forecast 2025-2030 ($ million)
Data Table on Italy - Market size and forecast 2025-2030 ($ million)
Chart on Italy - Year-over-year growth 2025-2030 (%)
Data Table on Italy - Year-over-year growth 2025-2030 (%)

12.5.5 Spain - Market size and forecast 2025-2030

Chart on Spain - Market size and forecast 2025-2030 ($ million)
Data Table on Spain - Market size and forecast 2025-2030 ($ million)
Chart on Spain - Year-over-year growth 2025-2030 (%)
Data Table on Spain - Year-over-year growth 2025-2030 (%)

12.5.6 The Netherlands - Market size and forecast 2025-2030

Chart on The Netherlands - Market size and forecast 2025-2030 ($ million)
Data Table on The Netherlands - Market size and forecast 2025-2030 ($ million)
Chart on The Netherlands - Year-over-year growth 2025-2030 (%)
Data Table on The Netherlands - Year-over-year growth 2025-2030 (%)

12.6 South America - Market size and forecast 2025-2030

Chart on South America - Market size and forecast 2025-2030 ($ million)
Data Table on South America - Market size and forecast 2025-2030 ($ million)
Chart on South America - Year-over-year growth 2025-2030 (%)
Data Table on South America - Year-over-year growth 2025-2030 (%)
Chart on Regional Comparison - South America
Data Table on Regional Comparison - South America

12.6.1 Brazil - Market size and forecast 2025-2030

Chart on Brazil - Market size and forecast 2025-2030 ($ million)
Data Table on Brazil - Market size and forecast 2025-2030 ($ million)
Chart on Brazil - Year-over-year growth 2025-2030 (%)
Data Table on Brazil - Year-over-year growth 2025-2030 (%)

12.6.2 Argentina - Market size and forecast 2025-2030

Chart on Argentina - Market size and forecast 2025-2030 ($ million)
Data Table on Argentina - Market size and forecast 2025-2030 ($ million)
Chart on Argentina - Year-over-year growth 2025-2030 (%)
Data Table on Argentina - Year-over-year growth 2025-2030 (%)

12.6.3 Chile - Market size and forecast 2025-2030

Chart on Chile - Market size and forecast 2025-2030 ($ million)
Data Table on Chile - Market size and forecast 2025-2030 ($ million)
Chart on Chile - Year-over-year growth 2025-2030 (%)
Data Table on Chile - Year-over-year growth 2025-2030 (%)

12.7 Middle East and Africa - Market size and forecast 2025-2030

Chart on Middle East and Africa - Market size and forecast 2025-2030 ($ million)
Data Table on Middle East and Africa - Market size and forecast 2025-2030 ($ million)
Chart on Middle East and Africa - Year-over-year growth 2025-2030 (%)
Data Table on Middle East and Africa - Year-over-year growth 2025-2030 (%)
Chart on Regional Comparison - Middle East and Africa
Data Table on Regional Comparison - Middle East and Africa

12.7.1 Saudi Arabia - Market size and forecast 2025-2030

Chart on Saudi Arabia - Market size and forecast 2025-2030 ($ million)
Data Table on Saudi Arabia - Market size and forecast 2025-2030 ($ million)
Chart on Saudi Arabia - Year-over-year growth 2025-2030 (%)
Data Table on Saudi Arabia - Year-over-year growth 2025-2030 (%)

12.7.2 UAE - Market size and forecast 2025-2030

Chart on UAE - Market size and forecast 2025-2030 ($ million)
Data Table on UAE - Market size and forecast 2025-2030 ($ million)
Chart on UAE - Year-over-year growth 2025-2030 (%)
Data Table on UAE - Year-over-year growth 2025-2030 (%)

12.7.3 South Africa - Market size and forecast 2025-2030

Chart on South Africa - Market size and forecast 2025-2030 ($ million)
Data Table on South Africa - Market size and forecast 2025-2030 ($ million)
Chart on South Africa - Year-over-year growth 2025-2030 (%)
Data Table on South Africa - Year-over-year growth 2025-2030 (%)

12.7.4 Turkey - Market size and forecast 2025-2030

Chart on Turkey - Market size and forecast 2025-2030 ($ million)
Data Table on Turkey - Market size and forecast 2025-2030 ($ million)
Chart on Turkey - Year-over-year growth 2025-2030 (%)
Data Table on Turkey - Year-over-year growth 2025-2030 (%)

12.7.5 Israel - Market size and forecast 2025-2030

Chart on Israel - Market size and forecast 2025-2030 ($ million)
Data Table on Israel - Market size and forecast 2025-2030 ($ million)
Chart on Israel - Year-over-year growth 2025-2030 (%)
Data Table on Israel - Year-over-year growth 2025-2030 (%)

12.8 Market opportunity by geography

Market opportunity by geography ($ million)
Data Tables on Market opportunity by geography ($ million)

13. Drivers, Challenges, and Opportunity

13.1 Market drivers

Increasing focus on occupational health and safety regulations
Growing awareness of employee wellness and productivity
Expansion of key end-user industries and applications

13.2 Market challenges

High initial cost and justifying return on investment
Lack of awareness regarding long-term health benefits
Intense competition and proliferation of low-quality alternatives

13.3 Impact of drivers and challenges

Impact of drivers and challenges in 2025 and 2030

13.4 Market opportunities

Increasing demand for sustainable and eco-friendly materials
Emphasis on customization and aesthetic integration
Development of specialized and value-added matting solutions

14. Competitive Landscape

14.1 Overview

14.2

Overview on criticality of inputs and factors of differentiation

14.3 Landscape disruption

Overview on factors of disruption

14.4 Industry risks

Impact of key risks on business

15. Competitive Analysis

15.1 Companies profiled

Companies covered

15.2 Company ranking index

15.3 Market positioning of companies

Matrix on companies position and classification

15.4 3M Co.

3M Co. - Overview
3M Co. - Business segments
3M Co. - Key news
3M Co. - Key offerings
3M Co. - Segment focus
SWOT

15.5 AcroMat LLC

AcroMat LLC - Overview
AcroMat LLC - Product / Service
AcroMat LLC - Key offerings
SWOT

15.6 Ansell Ltd.

Ansell Ltd. - Overview
Ansell Ltd. - Business segments
Ansell Ltd. - Key offerings
Ansell Ltd. - Segment focus
SWOT

15.7 Apache Mills Inc.

Apache Mills Inc. - Overview
Apache Mills Inc. - Product / Service
Apache Mills Inc. - Key offerings
SWOT

15.8 Ergomat Inc.

Ergomat Inc. - Overview
Ergomat Inc. - Product / Service
Ergomat Inc. - Key offerings
SWOT

15.9 Imprint Comfort Mats

Imprint Comfort Mats - Overview
Imprint Comfort Mats - Product / Service
Imprint Comfort Mats - Key offerings
SWOT

15.10 Justrite Mfg. Co. LLC

Justrite Mfg. Co. LLC - Overview
Justrite Mfg. Co. LLC - Product / Service
Justrite Mfg. Co. LLC - Key offerings
SWOT

15.11 KLEEN TEX Industries Inc.

KLEEN TEX Industries Inc. - Overview
KLEEN TEX Industries Inc. - Product / Service
KLEEN TEX Industries Inc. - Key offerings
SWOT

15.12 Lets Gel Inc.

Lets Gel Inc. - Overview
Lets Gel Inc. - Product / Service
Lets Gel Inc. - Key offerings
SWOT

15.13 M A Matting

M A Matting - Overview
M A Matting - Product / Service
M A Matting - Key offerings
SWOT

15.14 Milliken and Co.

Milliken and Co. - Overview
Milliken and Co. - Product / Service
Milliken and Co. - Key offerings
SWOT

15.15 New Pig Corp.

New Pig Corp. - Overview
New Pig Corp. - Product / Service
New Pig Corp. - Key offerings
SWOT

15.16 Plastex Matting Inc.

Plastex Matting Inc. - Overview
Plastex Matting Inc. - Product / Service
Plastex Matting Inc. - Key offerings
SWOT

15.17 Wearwell LLC

Wearwell LLC - Overview
Wearwell LLC - Product / Service
Wearwell LLC - Key offerings
SWOT

15.18 Xiamen Sheep Anti Fatigue Mat Co

Xiamen Sheep Anti Fatigue Mat Co - Overview
Xiamen Sheep Anti Fatigue Mat Co - Product / Service
Xiamen Sheep Anti Fatigue Mat Co - Key offerings
SWOT

16. Appendix

16.1 Scope of the report

Market definition
Objectives
Notes and caveats

16.2 Inclusions and exclusions checklist

Inclusions checklist
Exclusions checklist

16.3 Currency conversion rates for US$

16.4 Research methodology

16.5 Data procurement

Information sources

16.6 Data validation

16.7 Validation techniques employed for market sizing

16.8 Data synthesis

16.9 360 degree market analysis

16.10 List of abbreviations

Research Methodology

Technavio presents a detailed picture of the market by way of study, synthesis, and summation of data from multiple sources. The analysts have presented the various facets of the market with a particular focus on identifying the key industry influencers. The data thus presented is comprehensive, reliable, and the result of extensive research, both primary and secondary.

INFORMATION SOURCES

Primary sources

  • Manufacturers and suppliers
  • Channel partners
  • Industry experts
  • Strategic decision makers

Secondary sources

  • Industry journals and periodicals
  • Government data
  • Financial reports of key industry players
  • Historical data
  • Press releases

DATA ANALYSIS

Data Synthesis

  • Collation of data
  • Estimation of key figures
  • Analysis of derived insights

Data Validation

  • Triangulation with data models
  • Reference against proprietary databases
  • Corroboration with industry experts

REPORT WRITING

Qualitative

  • Market drivers
  • Market challenges
  • Market trends
  • Five forces analysis

Quantitative

  • Market size and forecast
  • Market segmentation
  • Geographical insights
  • Competitive landscape

Interested in this report?

Get your sample now to see our research methodology and insights!

Download Now

Frequently Asked Questions

Anti-Fatigue Mat market growth will increase by USD 757.2 million during 2026-2030.

The Anti-Fatigue Mat market is expected to grow at a CAGR of 4.9% during 2026-2030.

Anti-Fatigue Mat market is segmented by End-user (Non-residential, Residential) Distribution channel (Offline, Online) Type (Rubber, Foam, Gel, Vinyl, Others)

3M Co., AcroMat LLC, Ansell Ltd., Apache Mills Inc., Durable Corp., Ergomat Inc., Imprint Comfort Mats, Justrite Mfg. Co. LLC, KLEEN TEX Industries Inc., Lets Gel Inc., M A Matting, Milliken and Co., New Pig Corp., Plastex Matting Inc., Wearwell LLC, WellnessMats, Xiamen Sheep Anti Fatigue Mat Co are a few of the key vendors in the Anti-Fatigue Mat market.

North America will register the highest growth rate of 52.6% among the other regions. Therefore, the Anti-Fatigue Mat market in North America is expected to garner significant business opportunities for the vendors during the forecast period.

US, Canada, Mexico, China, Japan, India, South Korea, Australia, Indonesia, Germany, UK, France, Italy, Spain, The Netherlands, Brazil, Argentina, Chile, Saudi Arabia, UAE, South Africa, Turkey, Israel

  • Increasing focus on occupational health and safety regulations is the driving factor this market.

The Anti-Fatigue Mat market vendors should focus on grabbing business opportunities from the End-user segment as it accounted for the largest market share in the base year.
RIA - Research AI Assistant
Ask RIA
