Antioxidant Market Analysis, Size, and Forecast 2026-2030: APAC (China, Japan, and India), North America (US, Canada, and Mexico), Europe (Germany, France, and UK), Middle East and Africa (Saudi Arabia, South Africa, and UAE), South America (Brazil, Argentina, and Chile), and Rest of World (ROW)

Antioxidant Market Analysis, Size, and Forecast 2026-2030:
APAC (China, Japan, and India), North America (US, Canada, and Mexico), Europe (Germany, France, and UK), Middle East and Africa (Saudi Arabia, South Africa, and UAE), South America (Brazil, Argentina, and Chile), and Rest of World (ROW)

Published: Oct 2026 312 Pages SKU: IRTNTR74686

Market Overview at a Glance

$1.68 B
Market Opportunity
6.4%
CAGR 2025 - 2030
49.5%
APAC Growth
$1.43 B
Food and beverages segment 2024

Antioxidant Market Size 2026-2030

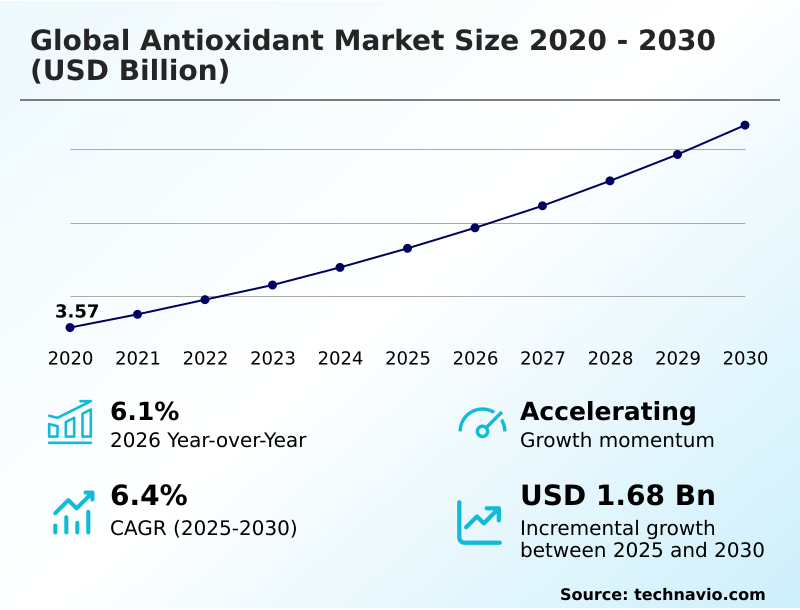
The antioxidant market size is valued to increase by USD 1.68 billion, at a CAGR of 6.4% from 2025 to 2030. Rising consumer preference clean label products accelerates botanical antioxidant demand will drive the antioxidant market.

Major Market Trends & Insights

  • APAC dominated the market and accounted for a 49.5% growth during the forecast period.
  • By Application - Food and beverages segment was valued at USD 1.43 billion in 2024
  • By Type - Vitamin C-based segment accounted for the largest market revenue share in 2024

Market Size & Forecast

  • Market Opportunities: USD 2.76 billion
  • Market Future Opportunities: USD 1.68 billion
  • CAGR from 2025 to 2030 : 6.4%

Market Summary

  • The Antioxidant Market exhibits robust expansion as industrial processors and consumer goods formulators prioritize advanced rancidity delay mechanisms to maintain product integrity. In modern commercial baking operations, manufacturers are systematically replacing artificial preservatives with natural botanical extracts to stabilize unsaturated fats during high-temperature processing.
  • This operational shift enables companies to achieve a 28% improvement in shelf life extension while satisfying rigorous clean-label retail compliance standards. The primary driver propelling this transition is the escalating consumer demand for transparent, health-focused dietary profiles, which forces ingredient suppliers to scale sustainable botanical extraction infrastructure.
  • Conversely, severe supply chain volatility regarding natural agricultural inputs creates a significant structural challenge, as unexpected climate shifts cause raw material shortages that directly compress manufacturing profit margins. Furthermore, formulation scientists face ongoing technical hurdles regarding cutaneous bioavailability optimization when integrating these delicate plant derivatives into premium personal care cosmetics.
  • By balancing advanced delivery technologies with sustainable sourcing protocols, market participants can successfully navigate raw material constraints and deliver high-performance preservation systems across global distribution networks.

What will be the Size of the Antioxidant Market during the forecast period?
Get Key Insights on Market Forecast (PDF) Get Free Sample

How is the Antioxidant Market Segmented?

The antioxidant industry research report provides comprehensive data (region-wise segment analysis), with forecasts and estimates in "USD million" for the period 2026-2030, as well as historical data from 2020-2024 for the following segments.

  • Application
    • Food and beverages
    • Pharmaceuticals
    • Personal care
    • Animal feeds
  • Type
    • Vitamin C-based
    • Vitamin E-based
    • Polyphenols-based
    • Carotenoids-based
  • Source
    • Synthetic
    • Natural
  • Geography
    • APAC
      • China
      • Japan
      • India
      • South Korea
      • Australia
      • Indonesia
    • North America
      • US
      • Canada
      • Mexico
    • Europe
      • Germany
      • France
      • UK
      • Italy
      • Spain
      • The Netherlands
    • Middle East and Africa
      • Saudi Arabia
      • South Africa
      • UAE
      • Turkey
      • Egypt
    • South America
      • Brazil
      • Argentina
      • Chile

By Application Insights

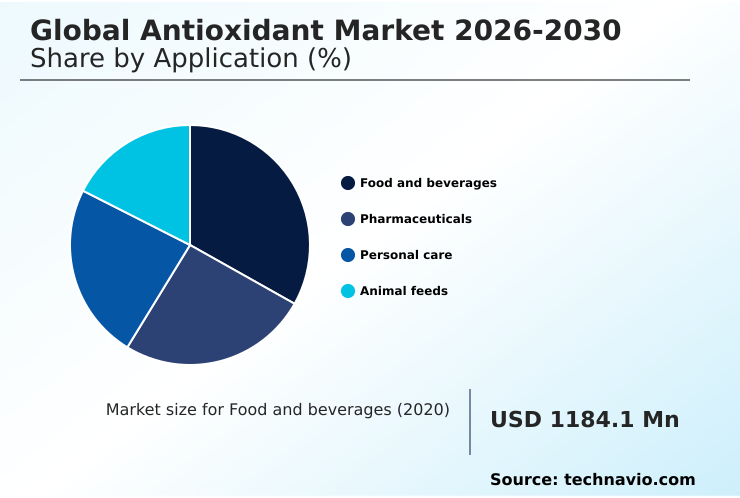
The food and beverages segment is estimated to witness significant growth during the forecast period.

The food and beverage segment commands substantial share in the Antioxidant Market as processors seek robust lipid peroxidation inhibition to prevent oxidative rancidity.

Manufacturers are actively replacing artificial additives with clean label preservatives to meet stringent regulatory standards and shifting consumer health preferences. This transition relies heavily on advanced botanical polyphenol extraction techniques, which ensure optimal food matrix stabilization during manufacturing.

Processors utilizing natural mixed compounds report sensory quality defect reductions of up to 42% compared to unfortified baselines. By neutralizing oxidative compounds effectively, these formulations maintain critical flavor profiles and ensure nutrient density preservation over extended distribution cycles.

Consequently, the adoption of specialized preservation systems remains essential for commercial bakeries and edible oil producers subjected to high heat processing.
Get Free Sample

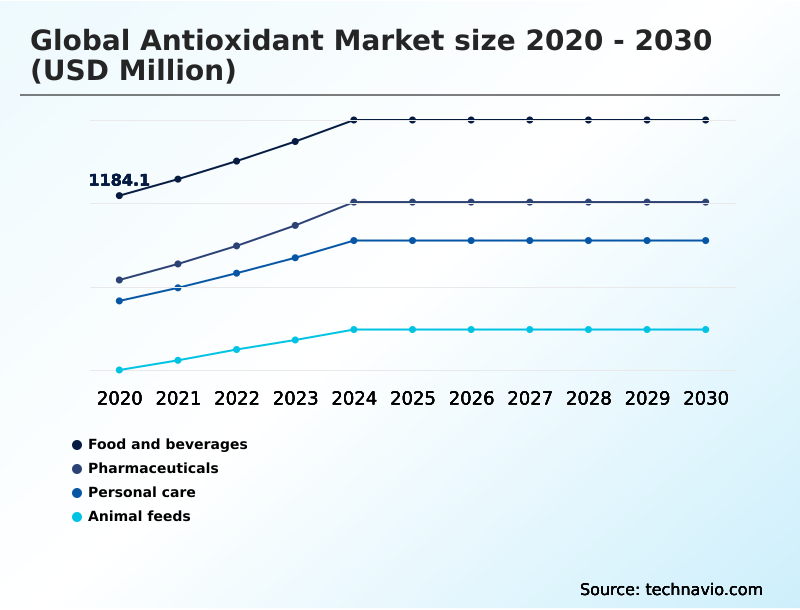
The Food and beverages segment was valued at USD 1.43 billion in 2024 and showed a gradual increase during the forecast period.
Get Free Sample

Regional Analysis

APAC is estimated to contribute 49.5% to the growth of the global market during the forecast period.Technavio’s analysts have elaborately explained the regional trends and drivers that shape the market during the forecast period.
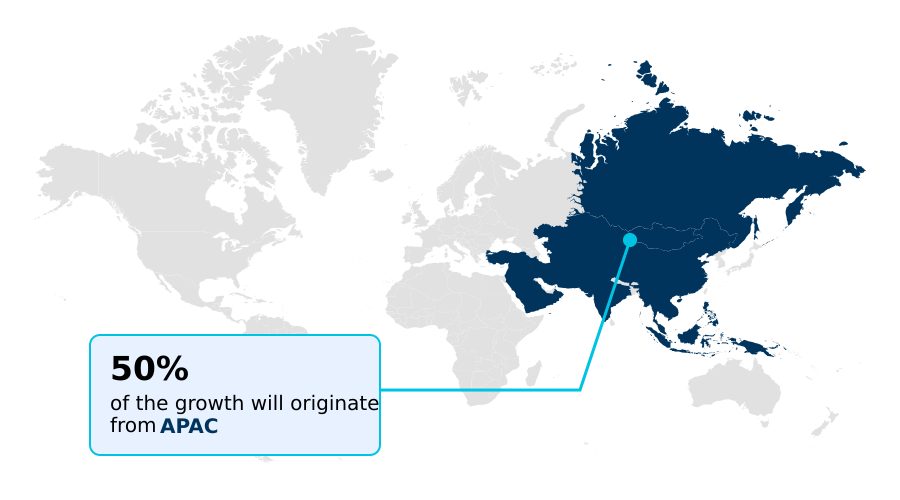
See How Antioxidant Market Demand is Rising in APAC Get Free Sample

The geographic distribution of the Antioxidant Market reveals stark strategic differences between APAC and North America. APAC operations prioritize high-volume synthetic stabilization additives, achieving production efficiency gains of 28% through scaled manufacturing of hindered phenolic antioxidants for industrial applications.

Conversely, North American processors favor microencapsulated delivery systems and plant derived alternatives, experiencing a 15% reduction in compliance costs by aligning with strict clean-label mandates.

This regional divergence stems from varied industrial requirements; while Asian facilities demand robust atmospheric oxidation delay for bulk polymer exports, American formulators focus heavily on premium anti aging formulations and functional nutrition.

Furthermore, European markets report a 22% increase in the utilization of secondary phosphite stabilizers to optimize polymer longevity without compromising environmental benchmarks. These distinct regulatory and consumer environments compel global suppliers to maintain highly adaptable regional supply chains.

Market Dynamics

Our researchers analyzed the data with 2025 as the base year, along with the key drivers, trends, and challenges. A holistic analysis of drivers will help companies refine their marketing strategies to gain a competitive advantage.

  • The continuous evolution of the Antioxidant Market is heavily influenced by the critical requirement to maintain product integrity and safety across diverse commercial sectors. Formulators are increasingly prioritizing clean label natural antioxidant extraction methods to secure high-purity active ingredients that align with modern consumer transparency demands.
  • In the animal nutrition sector, mitigating lipid peroxidation in pet food remains a primary operational focus, as rancid fats rapidly degrade essential nutrients and diminish feed conversion efficiency. To address these vulnerabilities, manufacturers are aggressively deploying shelf life extension botanical blends that provide superior thermal stability during extreme extrusion processes.
  • Furthermore, the cosmetic industry heavily leverages advanced plant derivatives for reactive oxygen species skin defense, developing premium topical formulations that shield cellular structures from environmental pollution and ultraviolet degradation. In human nutrition, the integration of microencapsulated natural tocopherol food stabilization technologies allows processors to protect delicate lipid matrices without compromising sensory attributes.
  • Industrial bakeries utilizing these advanced encapsulation systems report a 35% reduction in premature product spoilage compared to standard unfortified baselines, directly improving retail supply chain economics. By continuously optimizing extraction yields and refining synergistic delivery platforms, ingredient suppliers can successfully address the complex functional requirements of food, feed, and personal care manufacturers while driving long-term sectoral innovation.
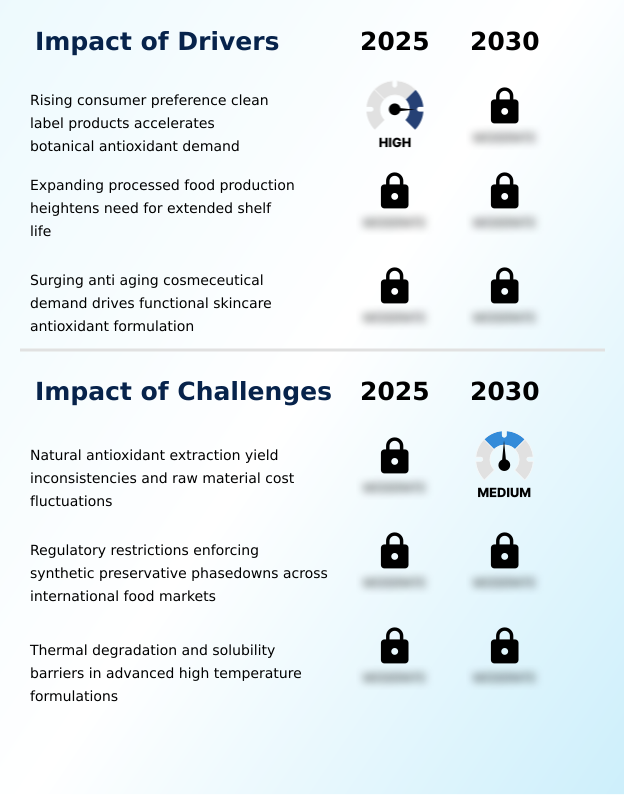
What are the key market drivers leading to the rise in the adoption of Antioxidant Industry?

  • The escalating consumer preference for clean label products and transparent ingredient sourcing acts as a primary catalyst accelerating the commercial demand for botanical preservation solutions.

  • The primary catalyst propelling the Antioxidant Market is the rapid consumer transition toward transparent ingredient tracing and clean label compliance across commercial retail sectors.
  • Modern health-conscious demographics actively reject synthetic chemical preservatives, forcing manufacturers to implement synergistic preservation systems that combat cellular oxidative stress. This formulation shift directly addresses the need for sensory quality maintenance in packaged goods subjected to extended transit times.
  • By integrating advanced lipophilic dispersion agents and botanical chelation agents, food processors and cosmetic brands can reduce product spoilage rates by up to 34%.
  • This operational advantage ensures that delicate unsaturated fats and active biological compounds remain intact, enabling commercial enterprises to capture higher profit margins while delivering the natural, health-focused product profiles demanded by contemporary global consumers.

What are the market trends shaping the Antioxidant Industry?

  • The strategic adoption of upcycled botanical side streams for sustainable production has emerged as a defining market trend. This circular economy approach allows manufacturers to capture high-value active compounds while minimizing agricultural waste.

  • A defining technological shift in the Antioxidant Market involves the strategic monetization of agricultural byproducts for sustainable active sourcing. Specialty chemical processors are moving away from traditional extraction methods to embrace organic waste valorization, capturing high-purity phytochemicals from discarded fruit peels and seed pomace.
  • This circular economy approach directly enhances multi functional protection capabilities while reducing raw material procurement costs by an estimated 18%. By isolating potent free radical scavenging compounds from these waste streams, ingredient formulators effectively mitigate thermo oxidative degradation in sensitive commercial products.
  • Consequently, consumer packaged goods manufacturers integrating these natural mixed tocopherols report shelf-life stability improvements of nearly 25% without utilizing synthetic additives. This strategic pivot allows multinational brands to achieve premium market positioning while satisfying aggressive corporate sustainability mandates across global supply networks.

What challenges does the Antioxidant Industry face during its growth?

  • Inconsistent extraction yields and severe raw material cost fluctuations associated with natural agricultural inputs represent substantial structural challenges constraining overall industry expansion.

  • Supply chain volatility and inconsistent extraction yields present substantial operational friction for participants in the Antioxidant Market. Transitioning toward non synthetic preservation requires massive capital investment in advanced raw material processing infrastructure, including expensive supercritical fluid extraction technologies.
  • These complex manufacturing methods often suffer from variable input quality caused by seasonal climate shifts, which directly complicates ingredient heat stability planning for end-users. Consequently, mid-tier formulators experience raw material cost spikes of up to 45% during agricultural shortages, delaying commercial product rollouts.
  • Furthermore, ensuring environmental stress mitigation and maintaining a functional skin barrier in natural cosmetics often fails if the active compounds cannot properly disrupt the autoxidation chain reaction under thermal stress. These structural formulation limitations force manufacturers to continually balance premium ingredient efficacy against narrow operational profit margins.

Exclusive Technavio Analysis on Customer Landscape

The antioxidant market forecasting report includes the adoption lifecycle of the market, covering from the innovator’s stage to the laggard’s stage. It focuses on adoption rates in different regions based on penetration. Furthermore, the antioxidant market report also includes key purchase criteria and drivers of price sensitivity to help companies evaluate and develop their market growth analysis strategies.
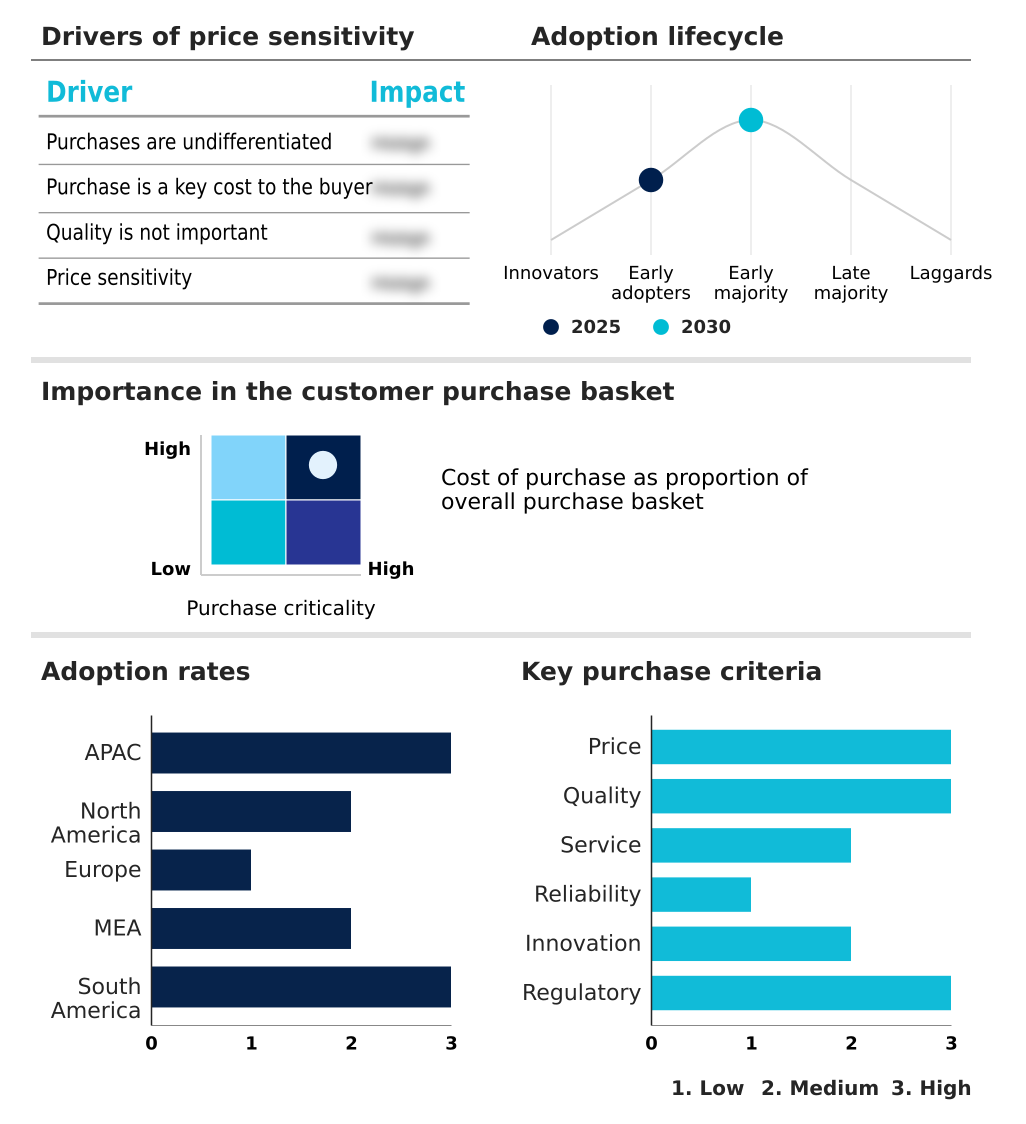
Customer Landscape of Antioxidant Industry

Competitive Landscape

Companies are implementing various strategies, such as strategic alliances, antioxidant market forecast, partnerships, mergers and acquisitions, geographical expansion, and product/service launches, to enhance their presence in the industry.

ADEKA Corp. - A prominent chemical supplier provides advanced stabilization solutions, delivering high-performance protective additives designed to prevent thermal degradation and extend the operational lifespan of industrial polymer materials.

The industry research and growth report includes detailed analyses of the competitive landscape of the market and information about key companies, including:

  • ADEKA Corp.
  • Archer Daniels Midland Co.
  • Barentz International BV
  • BASF SE
  • Cargill Inc.
  • Clariant International Ltd.
  • DSM Firmenich AG
  • Eastman Chemical Co.
  • Evonik Industries AG
  • Givaudan SA
  • Indena S.p.A.
  • International Flavors Inc.
  • Kerry Group Plc
  • Lanxess AG
  • Northeast Pharmaceutical Group
  • Sigma Aldrich Chemicals Ltd.
  • Solvay SA
  • Symrise Group
  • Synthite Industries Pvt. Ltd.
  • The Lubrizol Corp.

Qualitative and quantitative analysis of companies has been conducted to help clients understand the wider business environment as well as the strengths and weaknesses of key industry players. Data is qualitatively analyzed to categorize companies as pure play, category-focused, industry-focused, and diversified; it is quantitatively analyzed to categorize companies as dominant, leading, strong, tentative, and weak.

Recent Development and News in Antioxidant market

  • In the Diversified Chemicals industry, the European Union enforcement of the Packaging and Packaging Waste Regulation has accelerated the adoption of mechanical polymer recycling, driving a 25% increase in demand for hindered phenolic additives within the Antioxidant market to prevent thermal degradation during secondary extrusion.
  • The global transition toward bio-based aviation fuels driven by the Carbon Offsetting and Reduction Scheme for International Aviation has necessitated the development of novel lipophilic stabilization agents, expanding the Antioxidant market by 15% to prevent atmospheric oxidation in sustainable fuel matrices.
  • The implementation of advanced supercritical fluid extraction technologies across APAC manufacturing hubs has improved the yield of high-purity phytochemicals by 18%, significantly lowering procurement costs for botanical extracts within the Antioxidant market.
  • Stringent limits on synthetic food additives imposed by the European Food Safety Authority have accelerated the phase-out of legacy preservatives, increasing the adoption of clean label alternatives within the Antioxidant market by an estimated 30% across processed food sectors.

Dive into Technavio’s robust research methodology, blending expert interviews, extensive data synthesis, and validated models for unparalleled Antioxidant Market insights. See full methodology.

Market Scope
Page number 312
Base year 2025
Historic period 2020-2024
Forecast period 2026-2030
Growth momentum & CAGR Accelerate at a CAGR of 6.4%
Market growth 2026-2030 USD 1681.4 million
Market structure Fragmented
YoY growth 2025-2026(%) 6.1%
Key countries China, Japan, India, South Korea, Australia, Indonesia, US, Canada, Mexico, Germany, France, UK, Italy, Spain, The Netherlands, Saudi Arabia, South Africa, UAE, Turkey, Egypt, Brazil, Argentina and Chile
Competitive landscape Leading Companies, Market Positioning of Companies, Competitive Strategies, and Industry Risks

Request Free Sample

Research Analyst Overview

  • The Antioxidant Market is undergoing a rapid technological transformation driven by strict regulatory mandates and the complex stabilization requirements of modern manufacturing ecosystems. Chemical processors are heavily investing in green chemistry processing to optimize phenolic compound isolation, yielding high-purity active ingredients that eliminate reliance on petrochemical derivatives.
  • This strategic product evolution directly supports advanced dietary lipid protection, allowing food manufacturers to safeguard delicate fat matrices against rapid atmospheric degradation. Operational data indicates that facilities utilizing synergistic botanical blends achieve a 45% greater peroxide value reduction in processed oils compared to legacy preservation methods.
  • In the industrial sector, maintaining oxygen barrier integrity during high-heat polymer molding requires specialized stabilization additives with exceptional thermal extrusion tolerance. Plant managers leveraging these advanced anti-degradation molecules experience significantly lower mechanical defect rates, directly aligning with boardroom-level initiatives to reduce material waste and enhance overall supply chain resilience.
  • By continuously refining active delivery systems and expanding sustainable agricultural sourcing networks, ingredient suppliers successfully address the multifaceted oxidative challenges present across both heavy industrial and consumer-facing end markets.

What are the Key Data Covered in this Antioxidant Market Research and Growth Report?

  • What is the expected growth of the Antioxidant Market between 2026 and 2030?

    • USD 1.68 billion, at a CAGR of 6.4%

  • What segmentation does the market report cover?

    • The report is segmented by Application (Food and beverages, Pharmaceuticals, Personal care, and Animal feeds), Type (Vitamin C-based, Vitamin E-based, Polyphenols-based, and Carotenoids-based), Source (Synthetic, and Natural) and Geography (APAC, North America, Europe, Middle East and Africa, South America)

  • Which regions are analyzed in the report?

    • APAC, North America, Europe, Middle East and Africa and South America

  • What are the key growth drivers and market challenges?

    • Rising consumer preference clean label products accelerates botanical antioxidant demand, Natural antioxidant extraction yield inconsistencies and raw material cost fluctuations

  • Who are the major players in the Antioxidant Market?

    • ADEKA Corp., Archer Daniels Midland Co., Barentz International BV, BASF SE, Cargill Inc., Clariant International Ltd., DSM Firmenich AG, Eastman Chemical Co., Evonik Industries AG, Givaudan SA, Indena S.p.A., International Flavors Inc., Kerry Group Plc, Lanxess AG, Northeast Pharmaceutical Group, Sigma Aldrich Chemicals Ltd., Solvay SA, Symrise Group, Synthite Industries Pvt. Ltd. and The Lubrizol Corp.

Market Research Insights

  • The Antioxidant Market serves as a critical stabilization engine across industrial manufacturing and functional nutrition sectors. Chemical formulators are rapidly executing synthetic preservative replacement initiatives, utilizing advanced botanical extracts to improve nutritional profile retention in demanding lipid continuous systems. Facilities integrating these advanced natural formulations report a 22% reduction in premature oxidative spoilage during extended retail transit.
  • Furthermore, industrial polymer manufacturers deploy high-performance specialty additives to ensure structural material longevity under extreme thermal stress, achieving a 15% decrease in mechanical failure rates for engineering plastics. These measurable efficiency gains demonstrate the vital role of optimized oxidative protection in lowering operational waste and maintaining commercial product integrity across complex supply chains.

We can help! Our analysts can customize this antioxidant market research report to meet your requirements.

Get in touch

1. Executive Summary

1.1 Market overview

Executive Summary - Chart on Market Overview
Executive Summary - Data Table on Market Overview
Executive Summary - Chart on Global Market Characteristics
Executive Summary - Chart on Market by Geography
Executive Summary - Chart on Market Segmentation by Application
Executive Summary - Chart on Market Segmentation by Type
Executive Summary - Chart on Market Segmentation by Source
Executive Summary - Chart on Incremental Growth
Executive Summary - Data Table on Incremental Growth
Executive Summary - Chart on Company Market Positioning

2. Technavio Analysis

2.1 Analysis of price sensitivity, lifecycle, customer purchase basket, adoption rates, and purchase criteria

2.2 Criticality of inputs and Factors of differentiation

Chart on Overview on criticality of inputs and factors of differentiation

2.3 Factors of disruption

Chart on Overview on factors of disruption

2.4 Impact of drivers and challenges

Chart on Impact of drivers and challenges in 2025 and 2030

3. Market Landscape

3.1 Market ecosystem

Chart on Parent Market
Data Table on - Parent Market

3.2 Market characteristics

Chart on Market characteristics analysis

3.3 Value chain analysis

Chart on Value chain analysis

4. Market Sizing

4.1 Market definition

Data Table on Offerings of companies included in the market definition

4.2 Market segment analysis

Market segments

4.3 Market size 2025

4.4 Market outlook: Forecast for 2025-2030

Chart on Global - Market size and forecast 2025-2030 ($ million)
Data Table on Global - Market size and forecast 2025-2030 ($ million)
Chart on Global Market: Year-over-year growth 2025-2030 (%)
Data Table on Global Market: Year-over-year growth 2025-2030 (%)

5. Historic Market Size

5.1 Global Antioxidant Market 2020 - 2024

Historic Market Size - Data Table on Global Antioxidant Market 2020 - 2024 ($ million)

5.2 Application segment analysis 2020 - 2024

Historic Market Size - Application Segment 2020 - 2024 ($ million)

5.3 Type segment analysis 2020 - 2024

Historic Market Size - Type Segment 2020 - 2024 ($ million)

5.4 Source segment analysis 2020 - 2024

Historic Market Size - Source Segment 2020 - 2024 ($ million)

5.5 Geography segment analysis 2020 - 2024

Historic Market Size - Geography Segment 2020 - 2024 ($ million)

5.6 Country segment analysis 2020 - 2024

Historic Market Size - Country Segment 2020 - 2024 ($ million)

6. Qualitative Analysis

6.1 Impact of AI on global antioxidant market

6.2 Impact of geopolitical conflicts on global antioxidant market

7. Five Forces Analysis

7.1 Five forces summary

Five forces analysis - Comparison between 2025 and 2030

7.2 Bargaining power of buyers

Bargaining power of buyers - Impact of key factors 2025 and 2030

7.3 Bargaining power of suppliers

Bargaining power of suppliers - Impact of key factors in 2025 and 2030

7.4 Threat of new entrants

Threat of new entrants - Impact of key factors in 2025 and 2030

7.5 Threat of substitutes

Threat of substitutes - Impact of key factors in 2025 and 2030

7.6 Threat of rivalry

Threat of rivalry - Impact of key factors in 2025 and 2030

7.7 Market condition

Chart on Market condition - Five forces 2025 and 2030

8. Market Segmentation by Application

8.1 Market segments

Chart on Application - Market share 2025-2030 (%)
Data Table on Application - Market share 2025-2030 (%)

8.2 Comparison by Application

Chart on Comparison by Application
Data Table on Comparison by Application

8.3 Food and beverages - Market size and forecast 2025-2030

Chart on Food and beverages - Market size and forecast 2025-2030 ($ million)
Data Table on Food and beverages - Market size and forecast 2025-2030 ($ million)
Chart on Food and beverages - Year-over-year growth 2025-2030 (%)
Data Table on Food and beverages - Year-over-year growth 2025-2030 (%)

8.4 Pharmaceuticals - Market size and forecast 2025-2030

Chart on Pharmaceuticals - Market size and forecast 2025-2030 ($ million)
Data Table on Pharmaceuticals - Market size and forecast 2025-2030 ($ million)
Chart on Pharmaceuticals - Year-over-year growth 2025-2030 (%)
Data Table on Pharmaceuticals - Year-over-year growth 2025-2030 (%)

8.5 Personal care - Market size and forecast 2025-2030

Chart on Personal care - Market size and forecast 2025-2030 ($ million)
Data Table on Personal care - Market size and forecast 2025-2030 ($ million)
Chart on Personal care - Year-over-year growth 2025-2030 (%)
Data Table on Personal care - Year-over-year growth 2025-2030 (%)

8.6 Animal feeds - Market size and forecast 2025-2030

Chart on Animal feeds - Market size and forecast 2025-2030 ($ million)
Data Table on Animal feeds - Market size and forecast 2025-2030 ($ million)
Chart on Animal feeds - Year-over-year growth 2025-2030 (%)
Data Table on Animal feeds - Year-over-year growth 2025-2030 (%)

8.7 Market opportunity by Application

Market opportunity by Application ($ million)
Data Table on Market opportunity by Application ($ million)

9. Market Segmentation by Type

9.1 Market segments

Chart on Type - Market share 2025-2030 (%)
Data Table on Type - Market share 2025-2030 (%)

9.2 Comparison by Type

Chart on Comparison by Type
Data Table on Comparison by Type

9.3 Vitamin C-based - Market size and forecast 2025-2030

Chart on Vitamin C-based - Market size and forecast 2025-2030 ($ million)
Data Table on Vitamin C-based - Market size and forecast 2025-2030 ($ million)
Chart on Vitamin C-based - Year-over-year growth 2025-2030 (%)
Data Table on Vitamin C-based - Year-over-year growth 2025-2030 (%)

9.4 Vitamin E-based - Market size and forecast 2025-2030

Chart on Vitamin E-based - Market size and forecast 2025-2030 ($ million)
Data Table on Vitamin E-based - Market size and forecast 2025-2030 ($ million)
Chart on Vitamin E-based - Year-over-year growth 2025-2030 (%)
Data Table on Vitamin E-based - Year-over-year growth 2025-2030 (%)

9.5 Polyphenols-based - Market size and forecast 2025-2030

Chart on Polyphenols-based - Market size and forecast 2025-2030 ($ million)
Data Table on Polyphenols-based - Market size and forecast 2025-2030 ($ million)
Chart on Polyphenols-based - Year-over-year growth 2025-2030 (%)
Data Table on Polyphenols-based - Year-over-year growth 2025-2030 (%)

9.6 Carotenoids-based - Market size and forecast 2025-2030

Chart on Carotenoids-based - Market size and forecast 2025-2030 ($ million)
Data Table on Carotenoids-based - Market size and forecast 2025-2030 ($ million)
Chart on Carotenoids-based - Year-over-year growth 2025-2030 (%)
Data Table on Carotenoids-based - Year-over-year growth 2025-2030 (%)

9.7 Market opportunity by Type

Market opportunity by Type ($ million)
Data Table on Market opportunity by Type ($ million)

10. Market Segmentation by Source

10.1 Market segments

Chart on Source - Market share 2025-2030 (%)
Data Table on Source - Market share 2025-2030 (%)

10.2 Comparison by Source

Chart on Comparison by Source
Data Table on Comparison by Source

10.3 Synthetic - Market size and forecast 2025-2030

Chart on Synthetic - Market size and forecast 2025-2030 ($ million)
Data Table on Synthetic - Market size and forecast 2025-2030 ($ million)
Chart on Synthetic - Year-over-year growth 2025-2030 (%)
Data Table on Synthetic - Year-over-year growth 2025-2030 (%)

10.4 Natural - Market size and forecast 2025-2030

Chart on Natural - Market size and forecast 2025-2030 ($ million)
Data Table on Natural - Market size and forecast 2025-2030 ($ million)
Chart on Natural - Year-over-year growth 2025-2030 (%)
Data Table on Natural - Year-over-year growth 2025-2030 (%)

10.5 Market opportunity by Source

Market opportunity by Source ($ million)
Data Table on Market opportunity by Source ($ million)

11. Customer Landscape

11.1 Customer landscape overview

Analysis of price sensitivity, lifecycle, customer purchase basket, adoption rates, and purchase criteria

12. Geographic Landscape

12.1 Geographic segmentation

Chart on Market share by geography 2025-2030 (%)
Data Table on Market share by geography 2025-2030 (%)

12.2 Geographic comparison

Chart on Geographic comparison
Data Table on Geographic comparison

12.3 APAC - Market size and forecast 2025-2030

Chart on APAC - Market size and forecast 2025-2030 ($ million)
Data Table on APAC - Market size and forecast 2025-2030 ($ million)
Chart on APAC - Year-over-year growth 2025-2030 (%)
Data Table on APAC - Year-over-year growth 2025-2030 (%)
Chart on Regional Comparison - APAC
Data Table on Regional Comparison - APAC

12.3.1 China - Market size and forecast 2025-2030

Chart on China - Market size and forecast 2025-2030 ($ million)
Data Table on China - Market size and forecast 2025-2030 ($ million)
Chart on China - Year-over-year growth 2025-2030 (%)
Data Table on China - Year-over-year growth 2025-2030 (%)

12.3.2 Japan - Market size and forecast 2025-2030

Chart on Japan - Market size and forecast 2025-2030 ($ million)
Data Table on Japan - Market size and forecast 2025-2030 ($ million)
Chart on Japan - Year-over-year growth 2025-2030 (%)
Data Table on Japan - Year-over-year growth 2025-2030 (%)

12.3.3 India - Market size and forecast 2025-2030

Chart on India - Market size and forecast 2025-2030 ($ million)
Data Table on India - Market size and forecast 2025-2030 ($ million)
Chart on India - Year-over-year growth 2025-2030 (%)
Data Table on India - Year-over-year growth 2025-2030 (%)

12.3.4 South Korea - Market size and forecast 2025-2030

Chart on South Korea - Market size and forecast 2025-2030 ($ million)
Data Table on South Korea - Market size and forecast 2025-2030 ($ million)
Chart on South Korea - Year-over-year growth 2025-2030 (%)
Data Table on South Korea - Year-over-year growth 2025-2030 (%)

12.3.5 Australia - Market size and forecast 2025-2030

Chart on Australia - Market size and forecast 2025-2030 ($ million)
Data Table on Australia - Market size and forecast 2025-2030 ($ million)
Chart on Australia - Year-over-year growth 2025-2030 (%)
Data Table on Australia - Year-over-year growth 2025-2030 (%)

12.3.6 Indonesia - Market size and forecast 2025-2030

Chart on Indonesia - Market size and forecast 2025-2030 ($ million)
Data Table on Indonesia - Market size and forecast 2025-2030 ($ million)
Chart on Indonesia - Year-over-year growth 2025-2030 (%)
Data Table on Indonesia - Year-over-year growth 2025-2030 (%)

12.4 North America - Market size and forecast 2025-2030

Chart on North America - Market size and forecast 2025-2030 ($ million)
Data Table on North America - Market size and forecast 2025-2030 ($ million)
Chart on North America - Year-over-year growth 2025-2030 (%)
Data Table on North America - Year-over-year growth 2025-2030 (%)
Chart on Regional Comparison - North America
Data Table on Regional Comparison - North America

12.4.1 US - Market size and forecast 2025-2030

Chart on US - Market size and forecast 2025-2030 ($ million)
Data Table on US - Market size and forecast 2025-2030 ($ million)
Chart on US - Year-over-year growth 2025-2030 (%)
Data Table on US - Year-over-year growth 2025-2030 (%)

12.4.2 Canada - Market size and forecast 2025-2030

Chart on Canada - Market size and forecast 2025-2030 ($ million)
Data Table on Canada - Market size and forecast 2025-2030 ($ million)
Chart on Canada - Year-over-year growth 2025-2030 (%)
Data Table on Canada - Year-over-year growth 2025-2030 (%)

12.4.3 Mexico - Market size and forecast 2025-2030

Chart on Mexico - Market size and forecast 2025-2030 ($ million)
Data Table on Mexico - Market size and forecast 2025-2030 ($ million)
Chart on Mexico - Year-over-year growth 2025-2030 (%)
Data Table on Mexico - Year-over-year growth 2025-2030 (%)

12.5 Europe - Market size and forecast 2025-2030

Chart on Europe - Market size and forecast 2025-2030 ($ million)
Data Table on Europe - Market size and forecast 2025-2030 ($ million)
Chart on Europe - Year-over-year growth 2025-2030 (%)
Data Table on Europe - Year-over-year growth 2025-2030 (%)
Chart on Regional Comparison - Europe
Data Table on Regional Comparison - Europe

12.5.1 Germany - Market size and forecast 2025-2030

Chart on Germany - Market size and forecast 2025-2030 ($ million)
Data Table on Germany - Market size and forecast 2025-2030 ($ million)
Chart on Germany - Year-over-year growth 2025-2030 (%)
Data Table on Germany - Year-over-year growth 2025-2030 (%)

12.5.2 France - Market size and forecast 2025-2030

Chart on France - Market size and forecast 2025-2030 ($ million)
Data Table on France - Market size and forecast 2025-2030 ($ million)
Chart on France - Year-over-year growth 2025-2030 (%)
Data Table on France - Year-over-year growth 2025-2030 (%)

12.5.3 UK - Market size and forecast 2025-2030

Chart on UK - Market size and forecast 2025-2030 ($ million)
Data Table on UK - Market size and forecast 2025-2030 ($ million)
Chart on UK - Year-over-year growth 2025-2030 (%)
Data Table on UK - Year-over-year growth 2025-2030 (%)

12.5.4 Italy - Market size and forecast 2025-2030

Chart on Italy - Market size and forecast 2025-2030 ($ million)
Data Table on Italy - Market size and forecast 2025-2030 ($ million)
Chart on Italy - Year-over-year growth 2025-2030 (%)
Data Table on Italy - Year-over-year growth 2025-2030 (%)

12.5.5 Spain - Market size and forecast 2025-2030

Chart on Spain - Market size and forecast 2025-2030 ($ million)
Data Table on Spain - Market size and forecast 2025-2030 ($ million)
Chart on Spain - Year-over-year growth 2025-2030 (%)
Data Table on Spain - Year-over-year growth 2025-2030 (%)

12.5.6 The Netherlands - Market size and forecast 2025-2030

Chart on The Netherlands - Market size and forecast 2025-2030 ($ million)
Data Table on The Netherlands - Market size and forecast 2025-2030 ($ million)
Chart on The Netherlands - Year-over-year growth 2025-2030 (%)
Data Table on The Netherlands - Year-over-year growth 2025-2030 (%)

12.6 Middle East and Africa - Market size and forecast 2025-2030

Chart on Middle East and Africa - Market size and forecast 2025-2030 ($ million)
Data Table on Middle East and Africa - Market size and forecast 2025-2030 ($ million)
Chart on Middle East and Africa - Year-over-year growth 2025-2030 (%)
Data Table on Middle East and Africa - Year-over-year growth 2025-2030 (%)
Chart on Regional Comparison - Middle East and Africa
Data Table on Regional Comparison - Middle East and Africa

12.6.1 Saudi Arabia - Market size and forecast 2025-2030

Chart on Saudi Arabia - Market size and forecast 2025-2030 ($ million)
Data Table on Saudi Arabia - Market size and forecast 2025-2030 ($ million)
Chart on Saudi Arabia - Year-over-year growth 2025-2030 (%)
Data Table on Saudi Arabia - Year-over-year growth 2025-2030 (%)

12.6.2 South Africa - Market size and forecast 2025-2030

Chart on South Africa - Market size and forecast 2025-2030 ($ million)
Data Table on South Africa - Market size and forecast 2025-2030 ($ million)
Chart on South Africa - Year-over-year growth 2025-2030 (%)
Data Table on South Africa - Year-over-year growth 2025-2030 (%)

12.6.3 UAE - Market size and forecast 2025-2030

Chart on UAE - Market size and forecast 2025-2030 ($ million)
Data Table on UAE - Market size and forecast 2025-2030 ($ million)
Chart on UAE - Year-over-year growth 2025-2030 (%)
Data Table on UAE - Year-over-year growth 2025-2030 (%)

12.6.4 Turkey - Market size and forecast 2025-2030

Chart on Turkey - Market size and forecast 2025-2030 ($ million)
Data Table on Turkey - Market size and forecast 2025-2030 ($ million)
Chart on Turkey - Year-over-year growth 2025-2030 (%)
Data Table on Turkey - Year-over-year growth 2025-2030 (%)

12.6.5 Egypt - Market size and forecast 2025-2030

Chart on Egypt - Market size and forecast 2025-2030 ($ million)
Data Table on Egypt - Market size and forecast 2025-2030 ($ million)
Chart on Egypt - Year-over-year growth 2025-2030 (%)
Data Table on Egypt - Year-over-year growth 2025-2030 (%)

12.7 South America - Market size and forecast 2025-2030

Chart on South America - Market size and forecast 2025-2030 ($ million)
Data Table on South America - Market size and forecast 2025-2030 ($ million)
Chart on South America - Year-over-year growth 2025-2030 (%)
Data Table on South America - Year-over-year growth 2025-2030 (%)
Chart on Regional Comparison - South America
Data Table on Regional Comparison - South America

12.7.1 Brazil - Market size and forecast 2025-2030

Chart on Brazil - Market size and forecast 2025-2030 ($ million)
Data Table on Brazil - Market size and forecast 2025-2030 ($ million)
Chart on Brazil - Year-over-year growth 2025-2030 (%)
Data Table on Brazil - Year-over-year growth 2025-2030 (%)

12.7.2 Argentina - Market size and forecast 2025-2030

Chart on Argentina - Market size and forecast 2025-2030 ($ million)
Data Table on Argentina - Market size and forecast 2025-2030 ($ million)
Chart on Argentina - Year-over-year growth 2025-2030 (%)
Data Table on Argentina - Year-over-year growth 2025-2030 (%)

12.7.3 Chile - Market size and forecast 2025-2030

Chart on Chile - Market size and forecast 2025-2030 ($ million)
Data Table on Chile - Market size and forecast 2025-2030 ($ million)
Chart on Chile - Year-over-year growth 2025-2030 (%)
Data Table on Chile - Year-over-year growth 2025-2030 (%)

12.8 Market opportunity by geography

Market opportunity by geography ($ million)
Data Tables on Market opportunity by geography ($ million)

13. Drivers, Challenges, and Opportunity

13.1 Market drivers

Rising consumer preference clean label products accelerates botanical antioxidant demand
Expanding processed food production heightens need for extended shelf life
Surging anti aging cosmeceutical demand drives functional skincare antioxidant formulation

13.2 Market challenges

Natural antioxidant extraction yield inconsistencies and raw material cost fluctuations
Regulatory restrictions enforcing synthetic preservative phasedowns across international food markets
Thermal degradation and solubility barriers in advanced high temperature formulations

13.3 Impact of drivers and challenges

Impact of drivers and challenges in 2025 and 2030

13.4 Market opportunities

Strategic adoption upcycled botanical side streams for sustainable antioxidant production
Microencapsulation technology integration enhances botanical antioxidant thermal stability and release
Synergistic blending natural synthetic systems optimizes commercial food preservation efficacy

14. Competitive Landscape

14.1 Overview

14.2

Overview on criticality of inputs and factors of differentiation

14.3 Landscape disruption

Overview on factors of disruption

14.4 Industry risks

Impact of key risks on business

15. Competitive Analysis

15.1 Companies profiled

Companies covered

15.2 Company ranking index

15.3 Market positioning of companies

Matrix on companies position and classification

15.4 ADEKA Corp.

ADEKA Corp. - Overview
ADEKA Corp. - Business segments
ADEKA Corp. - Key offerings
ADEKA Corp. - Segment focus
SWOT

15.5 Archer Daniels Midland Co.

Archer Daniels Midland Co. - Overview
Archer Daniels Midland Co. - Business segments
Archer Daniels Midland Co. - Key news
Archer Daniels Midland Co. - Key offerings
Archer Daniels Midland Co. - Segment focus
SWOT

15.6 BASF SE

BASF SE - Overview
BASF SE - Business segments
BASF SE - Key news
BASF SE - Key offerings
BASF SE - Segment focus
SWOT

15.7 Cargill Inc.

Cargill Inc. - Overview
Cargill Inc. - Product / Service
Cargill Inc. - Key news
Cargill Inc. - Key offerings
SWOT

15.8 Clariant International Ltd.

Clariant International Ltd. - Overview
Clariant International Ltd. - Business segments
Clariant International Ltd. - Key offerings
Clariant International Ltd. - Segment focus
SWOT

15.9 DSM Firmenich AG

DSM Firmenich AG - Overview
DSM Firmenich AG - Business segments
DSM Firmenich AG - Key offerings
DSM Firmenich AG - Segment focus
SWOT

15.10 Eastman Chemical Co.

Eastman Chemical Co. - Overview
Eastman Chemical Co. - Business segments
Eastman Chemical Co. - Key offerings
Eastman Chemical Co. - Segment focus
SWOT

15.11 Evonik Industries AG

Evonik Industries AG - Overview
Evonik Industries AG - Business segments
Evonik Industries AG - Key news
Evonik Industries AG - Key offerings
Evonik Industries AG - Segment focus
SWOT

15.12 Givaudan SA

Givaudan SA - Overview
Givaudan SA - Business segments
Givaudan SA - Key news
Givaudan SA - Key offerings
Givaudan SA - Segment focus
SWOT

15.13 Indena S.p.A.

Indena S.p.A. - Overview
Indena S.p.A. - Product / Service
Indena S.p.A. - Key offerings
SWOT

15.14 International Flavors Inc.

International Flavors Inc. - Overview
International Flavors Inc. - Business segments
International Flavors Inc. - Key news
International Flavors Inc. - Key offerings
International Flavors Inc. - Segment focus
SWOT

15.15 Lanxess AG

Lanxess AG - Overview
Lanxess AG - Business segments
Lanxess AG - Key offerings
Lanxess AG - Segment focus
SWOT

15.16 Sigma Aldrich Chemicals Ltd.

Sigma Aldrich Chemicals Ltd. - Overview
Sigma Aldrich Chemicals Ltd. - Product / Service
Sigma Aldrich Chemicals Ltd. - Key offerings
SWOT

15.17 Solvay SA

Solvay SA - Overview
Solvay SA - Business segments
Solvay SA - Key offerings
Solvay SA - Segment focus
SWOT

15.18 Symrise Group

Symrise Group - Overview
Symrise Group - Business segments
Symrise Group - Key news
Symrise Group - Key offerings
Symrise Group - Segment focus
SWOT

16. Appendix

16.1 Scope of the report

Market definition
Objectives
Notes and caveats

16.2 Inclusions and exclusions checklist

Inclusions checklist
Exclusions checklist

16.3 Currency conversion rates for US$

16.4 Research methodology

16.5 Data procurement

Information sources

16.6 Data validation

16.7 Validation techniques employed for market sizing

16.8 Data synthesis

16.9 360 degree market analysis

16.10 List of abbreviations

Research Methodology

Technavio presents a detailed picture of the market by way of study, synthesis, and summation of data from multiple sources. The analysts have presented the various facets of the market with a particular focus on identifying the key industry influencers. The data thus presented is comprehensive, reliable, and the result of extensive research, both primary and secondary.

INFORMATION SOURCES

Primary sources

  • Manufacturers and suppliers
  • Channel partners
  • Industry experts
  • Strategic decision makers

Secondary sources

  • Industry journals and periodicals
  • Government data
  • Financial reports of key industry players
  • Historical data
  • Press releases

DATA ANALYSIS

Data Synthesis

  • Collation of data
  • Estimation of key figures
  • Analysis of derived insights

Data Validation

  • Triangulation with data models
  • Reference against proprietary databases
  • Corroboration with industry experts

REPORT WRITING

Qualitative

  • Market drivers
  • Market challenges
  • Market trends
  • Five forces analysis

Quantitative

  • Market size and forecast
  • Market segmentation
  • Geographical insights
  • Competitive landscape

Interested in this report?

Get your sample now to see our research methodology and insights!

Download Now

Frequently Asked Questions

Antioxidant market growth will increase by USD 1681.4 million during 2026-2030.

The Antioxidant market is expected to grow at a CAGR of 6.4% during 2026-2030.

Antioxidant market is segmented by Application (Food and beverages, Pharmaceuticals, Personal care, Animal feeds) Type (Vitamin C-based, Vitamin E-based, Polyphenols-based, Carotenoids-based) Source (Synthetic, Natural)

ADEKA Corp., Archer Daniels Midland Co., Barentz International BV, BASF SE, Cargill Inc., Clariant International Ltd., DSM Firmenich AG, Eastman Chemical Co., Evonik Industries AG, Givaudan SA, Indena S.p.A., International Flavors Inc., Kerry Group Plc, Lanxess AG, Northeast Pharmaceutical Group, Sigma Aldrich Chemicals Ltd., Solvay SA, Symrise Group, Synthite Industries Pvt. Ltd., The Lubrizol Corp. are a few of the key vendors in the Antioxidant market.

APAC will register the highest growth rate of 49.5% among the other regions. Therefore, the Antioxidant market in APAC is expected to garner significant business opportunities for the vendors during the forecast period.

China, Japan, India, South Korea, Australia, Indonesia, US, Canada, Mexico, Germany, France, UK, Italy, Spain, The Netherlands, Saudi Arabia, South Africa, UAE, Turkey, Egypt, Brazil, Argentina, Chile

  • Rising consumer preference clean label products accelerates botanical antioxidant demand is the driving factor this market.

The Antioxidant market vendors should focus on grabbing business opportunities from the Application segment as it accounted for the largest market share in the base year.
RIA - Research AI Assistant
Ask RIA
