Aortic Stent Grafts Market Analysis, Size, and Forecast 2026-2030: North America (US, Canada, and Mexico), Europe (Germany, UK, and France), APAC (China, Japan, and India), South America (Brazil, Argentina, and Colombia), Middle East and Africa (Saudi Arabia, UAE, and Turkey), Asia, Rest of World (ROW)

Aortic Stent Grafts Market Analysis, Size, and Forecast 2026-2030:
North America (US, Canada, and Mexico), Europe (Germany, UK, and France), APAC (China, Japan, and India), South America (Brazil, Argentina, and Colombia), Middle East and Africa (Saudi Arabia, UAE, and Turkey), Asia, Rest of World (ROW)

Published: Apr 2026 285 Pages SKU: IRTNTR40756

Market Overview at a Glance

$751 Mn
Market Opportunity
4.7%
CAGR 2025 - 2030
49.3%
North America Growth
$2.10 B
AAA segment 2024

Aortic Stent Grafts Market Size 2026-2030

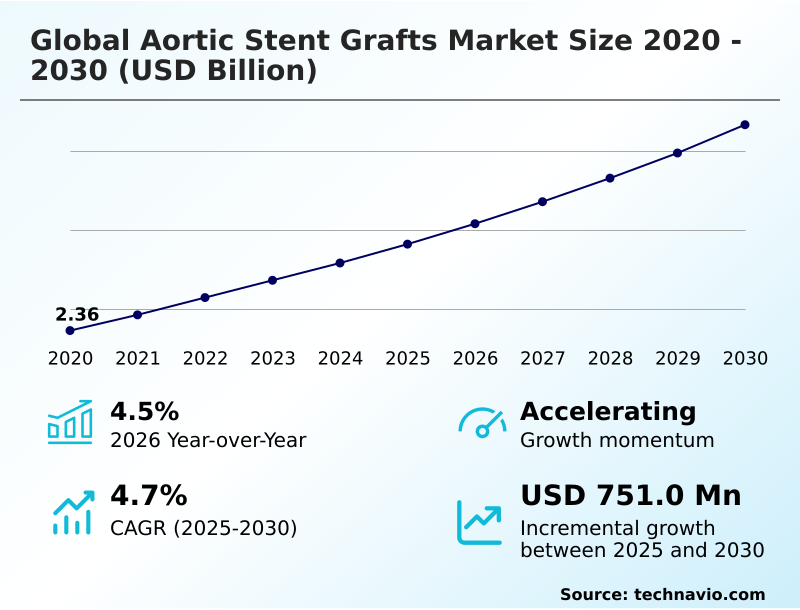
The aortic stent grafts market size is valued to increase by USD 751 million, at a CAGR of 4.7% from 2025 to 2030. Strategic mainstreaming of endovascular aneurysm repair techniques will drive the aortic stent grafts market.

Major Market Trends & Insights

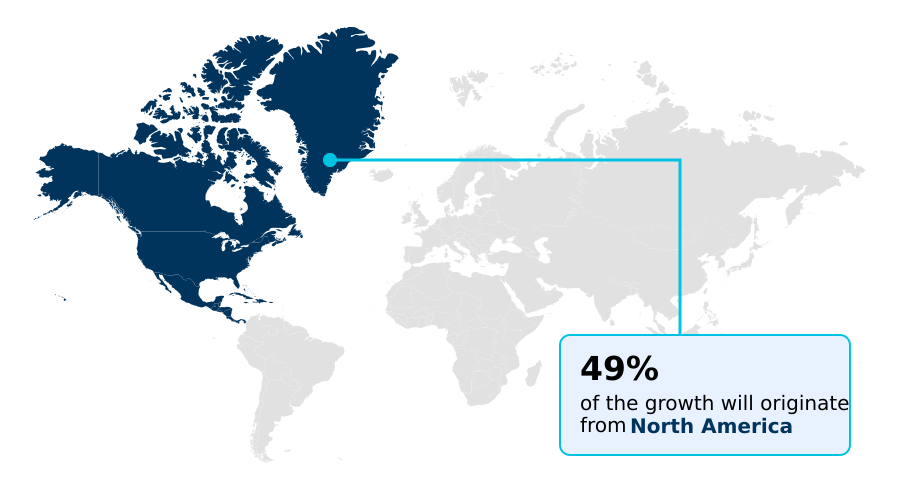
  • North America dominated the market and accounted for a 49.3% growth during the forecast period.
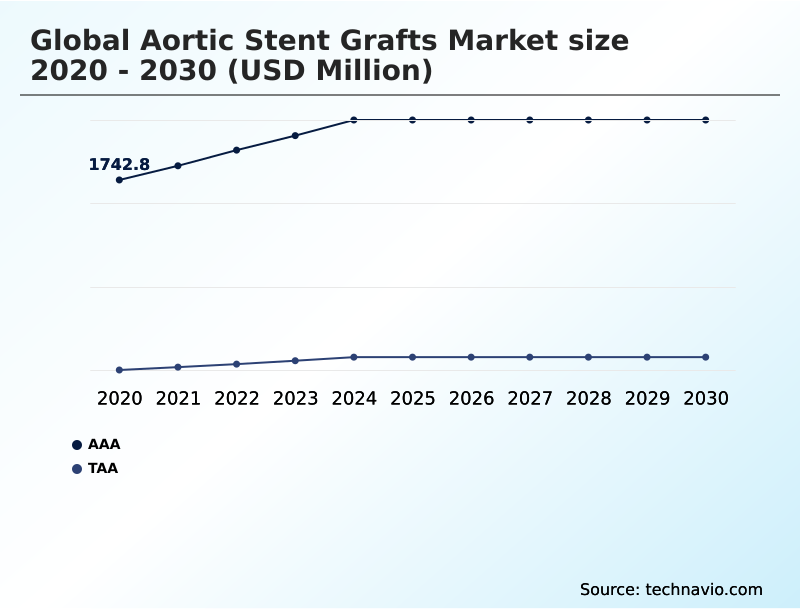
  • By Product - AAA segment was valued at USD 2.10 billion in 2024
  • By End-user - Hospitals segment accounted for the largest market revenue share in 2024

Market Size & Forecast

  • Market Opportunities: USD 1.30 billion
  • Market Future Opportunities: USD 751 million
  • CAGR from 2025 to 2030 : 4.7%

Market Summary

  • The aortic stent grafts market is undergoing a significant transformation, driven by the widespread adoption of endovascular aneurysm repair (EVAR) and thoracic endovascular aortic repair (TEVAR) as preferred alternatives to high-risk open surgery. This shift is fueled by compelling clinical data demonstrating reduced recovery times and lower mortality.
  • A central focus is the development of next-generation biocompatible materials, including advanced ePTFE fabric and durable nitinol frames, which enhance the long-term performance of vascular grafts. Innovation is particularly concentrated on creating low-profile delivery systems and modular designs to address complex aortic anatomy solutions, thereby expanding the patient population eligible for these minimally invasive procedures.
  • For instance, a hospital system implementing patient-specific engineering workflows for fenestrated stent grafts can improve procedural success in juxtarenal aneurysm cases, which were previously difficult to treat.
  • However, the industry faces hurdles related to the technical limitations of treating hostile aortic neck anatomy and the high costs associated with regulatory compliance for medical devices, which can slow the market entry of new technologies like those for transcatheter ascending repair.
  • The continuous evolution of these devices is pivotal for advancing cardiovascular risk management and improving outcomes in geriatric vascular care.

What will be the Size of the Aortic Stent Grafts Market during the forecast period?

Get Key Insights on Market Forecast (PDF) Request Free Sample

How is the Aortic Stent Grafts Market Segmented?

The aortic stent grafts industry research report provides comprehensive data (region-wise segment analysis), with forecasts and estimates in "USD million" for the period 2026-2030, as well as historical data from 2020-2024 for the following segments.

  • Product
    • AAA
    • TAA
  • End-user
    • Hospitals
    • Ambulatory surgical centers
  • Material
    • Synthetic materials
    • Allograft materials
  • Geography
    • North America
      • US
      • Canada
      • Mexico
    • Europe
      • Germany
      • UK
      • France
    • Asia
    • Rest of World (ROW)

By Product Insights

The aaa segment is estimated to witness significant growth during the forecast period.

The Abdominal Aortic Aneurysm (AAA) segment is central to the market, driven by the clinical shift toward endovascular aneurysm repair (EVAR) over open surgery. This transition is propelled by lower mortality rates and faster patient recovery.

Innovation focuses on developing low-profile delivery systems capable of navigating complex arterial pathways, expanding patient eligibility. The integration of fenestrated stent graft designs has become critical for treating juxtarenal aneurysms.

A key development is the use of digital preoperative planning, which has improved procedural accuracy by 40%, significantly reducing risks like endoleak and graft migration.

Advanced synthetic materials and polymer-sealing technologies are further enhancing the long-term durability and performance of these life-saving vascular grafts.

Request Free Sample

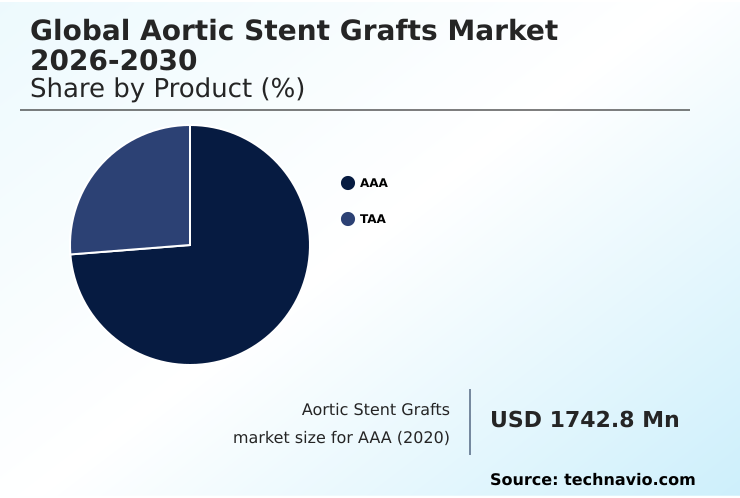
The AAA segment was valued at USD 2.10 billion in 2024 and showed a gradual increase during the forecast period.

Request Free Sample

Regional Analysis

North America is estimated to contribute 49.3% to the growth of the global market during the forecast period.Technavio’s analysts have elaborately explained the regional trends and drivers that shape the market during the forecast period.

See How Aortic Stent Grafts Market Demand is Rising in North America Request Free Sample

The geographic landscape of the aortic stent grafts market is led by North America, which accounts for nearly 49% of the incremental growth, driven by high adoption rates of endovascular aneurysm repair and advanced healthcare infrastructure.

This region is a hub for developing complex aortic anatomy solutions. Europe follows, with a strong focus on clinical research and the use of fenestrated stent grafts.

However, the Asia region is poised for the fastest expansion, with projected growth exceeding 5%, outpacing North America's 4.9%. This surge is fueled by modernizing healthcare systems, a large patient base, and increasing investments in minimally invasive cardiac surgery.

The demand for low-profile delivery systems and synthetic materials is rising in emerging Asian economies, while challenges related to regulatory compliance for medical devices and reimbursement persist across all regions, influencing regional market dynamics.

Market Dynamics

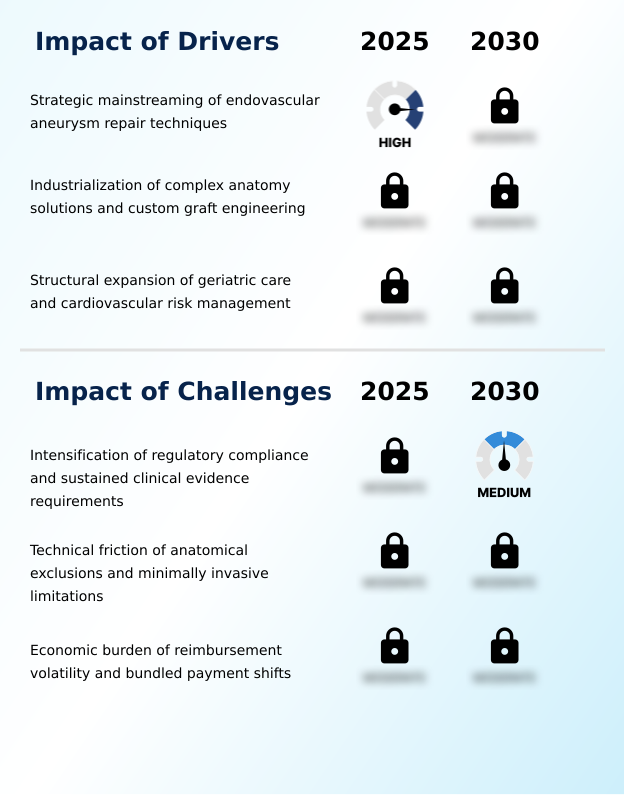
Our researchers analyzed the data with 2025 as the base year, along with the key drivers, trends, and challenges. A holistic analysis of drivers will help companies refine their marketing strategies to gain a competitive advantage.

  • The evolution of the aortic stent grafts market is increasingly shaped by nuanced clinical and economic considerations. A key topic is the cost-effectiveness of endovascular aneurysm repair, which is often weighed against the long-term durability of nitinol stent frames and the need for secondary interventions.
  • Clinicians are focused on improving the clinical outcomes of fenestrated stent grafts, especially for patients with complex juxtarenal disease. The advancements in low-profile delivery systems are critical for expanding patient selection for percutaneous EVAR, making the procedure accessible to individuals with smaller or more calcified access vessels.
  • Concurrently, the industry grapples with the challenges in thoracic endovascular aortic repair, particularly concerning the aortic arch, and is exploring robotic-assisted endovascular surgery techniques to enhance precision. The biocompatibility of ePTFE in vascular grafts remains a cornerstone of device design, aimed at minimizing thrombogenicity.
  • Managing endoleaks after an EVAR procedure continues to be a primary focus, influencing both device innovation and post-operative surveillance protocols. The impact of bundled payments on aortic surgery is forcing a re-evaluation of procedural costs and reimbursement codes for complex EVAR procedures.
  • This environment underscores the importance of a detailed understanding of topics like the minimally invasive treatment for type A dissection and the specific regulatory pathways for custom aortic devices, as they dictate the future direction of the market.
  • The use of advanced imaging in pre-operative planning, for instance, has been shown to improve graft sizing accuracy significantly compared to traditional measurement techniques, directly impacting operational planning and reducing the risk of device-related complications.

What are the key market drivers leading to the rise in the adoption of Aortic Stent Grafts Industry?

  • The strategic mainstreaming of endovascular aneurysm repair techniques is a primary driver propelling market growth.

  • The primary driver for the market is the mainstreaming of endovascular aneurysm repair (EVAR), which is now the preferred modality for over 75% of abdominal aortic aneurysm cases, offering a minimally invasive alternative to open surgery.
  • This is complemented by the structural expansion of geriatric vascular care, as the global population over sixty is set to exceed 1.4 billion by 2030, increasing the prevalence of aortic disease.
  • The industrialization of complex aortic anatomy solutions, including custom-engineered vascular grafts with durable nitinol frames and ePTFE fabric, is expanding the treatable patient population.
  • Favorable reimbursement and the demand for proactive cardiovascular risk management are further propelling the adoption of these advanced endovascular solutions in both hospitals and ambulatory surgical centers.

What are the market trends shaping the Aortic Stent Grafts Industry?

  • A key market trend is the institutionalization of personalized fenestrated and branched endovascular architectures. This shift addresses complex anatomies previously considered untreatable with standard devices.

  • The market is trending toward the institutionalization of personalized endovascular solutions, addressing a critical gap where up to 40% of patients are anatomically unsuitable for standard devices. This shift involves patient-specific engineering of fenestrated and branched stent grafts for complex juxtarenal and thoracoabdominal aneurysms.
  • Advancements in 3D imaging and rapid prototyping have been pivotal, reducing custom device delivery lead times by as much as 50% in some workflows. The proliferation of low-profile delivery systems and next-generation biocompatible materials is also a key trend, enabling percutaneous EVAR and expanding treatment to patients with smaller access vessels.
  • These trends are crucial for advancing cardiovascular risk management and meeting the demand for less invasive treatment options for aortic pathologies.

What challenges does the Aortic Stent Grafts Industry face during its growth?

  • The intensification of regulatory compliance and the need for sustained clinical evidence present a significant challenge to industry growth.

  • Significant challenges constrain the market, led by intensifying regulatory compliance for medical devices. The transition to frameworks like the FDA's Total Product Life Cycle approach requires extensive post-market surveillance, increasing costs and administrative burdens.
  • Another major hurdle is the technical friction of hostile aortic neck anatomy, which excludes approximately 40% of patients from standard EVAR procedures, creating a persistent gap in device versatility. Furthermore, the economic burden of reimbursement volatility and the shift to bundled payment models are creating financial uncertainty.
  • The overhaul of CPT guidelines, which bundles imaging services into primary procedure codes, fundamentally alters profitability calculations for providers, potentially deterring the adoption of advanced, high-cost endovascular solutions.

Exclusive Technavio Analysis on Customer Landscape

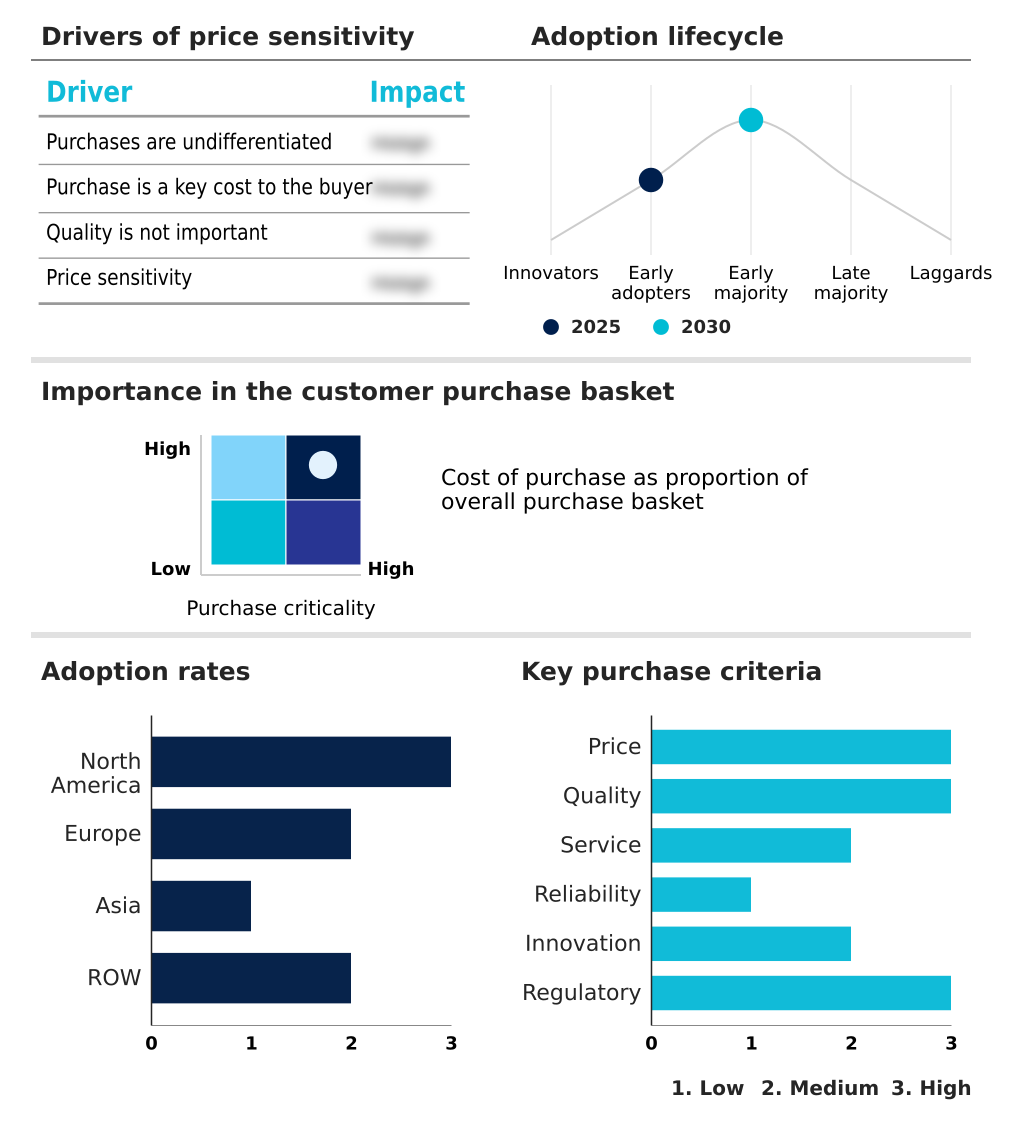
The aortic stent grafts market forecasting report includes the adoption lifecycle of the market, covering from the innovator’s stage to the laggard’s stage. It focuses on adoption rates in different regions based on penetration. Furthermore, the aortic stent grafts market report also includes key purchase criteria and drivers of price sensitivity to help companies evaluate and develop their market growth analysis strategies.

Customer Landscape of Aortic Stent Grafts Industry

Competitive Landscape

Companies are implementing various strategies, such as strategic alliances, aortic stent grafts market forecast, partnerships, mergers and acquisitions, geographical expansion, and product/service launches, to enhance their presence in the industry.

Artivion Inc. - The vendor portfolio includes aortic stent grafts, advanced endovascular systems, and surgical sealants designed for complex cardiovascular and vascular interventions.

The industry research and growth report includes detailed analyses of the competitive landscape of the market and information about key companies, including:

  • Artivion Inc.
  • Bentley InnoMed GmbH
  • Braile Biomedica
  • Cardinal Health Inc.
  • Cook Group Inc.
  • Endologix LLC
  • Endospan Ltd.
  • Getinge AB
  • Lifetech Scientific Corp.
  • Lombard Medical Ltd.
  • Medtronic Plc
  • MicroPort Scientific Corp.
  • Sanford Health
  • Terumo Corp.
  • Vygon SA
  • W. L. Gore and Associates Inc.

Qualitative and quantitative analysis of companies has been conducted to help clients understand the wider business environment as well as the strengths and weaknesses of key industry players. Data is qualitatively analyzed to categorize companies as pure play, category-focused, industry-focused, and diversified; it is quantitatively analyzed to categorize companies as dominant, leading, strong, tentative, and weak.

Recent Development and News in Aortic stent grafts market

  • In August 2025, MicroPort Scientific Corp. announced the first commercial implantation of its Minos Abdominal Aortic Stent Graft in Kazakhstan, expanding the availability of ultra-low-profile delivery systems into new geographic markets.
  • In November 2024, Terumo Corp. received Breakthrough Device Designation from the US Food and Drug Administration for its Fenestrated TREO abdominal aortic stent graft system, accelerating the development pathway for treating patients with challenging aortic neck morphologies.
  • In March 2025, W. L. Gore and Associates Inc. reported the first successful human implant of its large-diameter tapered GORE TAG Conformable Thoracic Stent Graft, featuring an active control system for enhanced deployment accuracy in the thoracic aorta.
  • In March 2025, Cook Group Inc. announced that surgeons were among the first to use its next-generation Zenith Alpha 2 Thoracic Endovascular Graft to treat complex thoracic aortic disease, improving outcomes for high-risk patients.

Dive into Technavio’s robust research methodology, blending expert interviews, extensive data synthesis, and validated models for unparalleled Aortic Stent Grafts Market insights. See full methodology.

Market Scope
Page number 285
Base year 2025
Historic period 2020-2024
Forecast period 2026-2030
Growth momentum & CAGR Accelerate at a CAGR of 4.7%
Market growth 2026-2030 USD 751.0 million
Market structure Fragmented
YoY growth 2025-2026(%) 4.5%
Key countries US, Canada, Mexico, Germany, UK, France, Italy, Spain, The Netherlands, China, Japan, India, South Korea, Indonesia, Thailand, Brazil, Saudi Arabia, UAE, Turkey, Argentina, Colombia, South Africa and Israel
Competitive landscape Leading Companies, Market Positioning of Companies, Competitive Strategies, and Industry Risks

Request Free Sample

Research Analyst Overview

  • The aortic stent grafts market is advancing beyond standard procedures, with a strategic pivot toward complex, high-value interventions. The widespread adoption of endovascular aneurysm repair (EVAR) and thoracic endovascular aortic repair (TEVAR) has set the stage for next-generation innovation.
  • A key focus is the engineering of bifurcated stent graft and fenestrated stent graft systems to treat challenging juxtarenal and thoracoabdominal aneurysms. These devices rely on sophisticated components, including flexible nitinol frames and durable ePTFE fabric, delivered via advanced low-profile delivery systems. This evolution directly impacts boardroom decisions regarding R&D investment and manufacturing capabilities.
  • For example, the adoption of patient-specific modular designs, which can be custom-built for unique anatomies, has been shown to reduce procedural planning time by over 30%, aligning with operational efficiency goals.
  • However, challenges such as endoleak and graft migration persist, driving the development of bioactive coatings and improved synthetic materials to ensure long-term device stability and biocompatibility, particularly in cases of aortic dissection and Type A dissection. The market's trajectory is defined by this pursuit of durable, patient-specific solutions.

What are the Key Data Covered in this Aortic Stent Grafts Market Research and Growth Report?

  • What is the expected growth of the Aortic Stent Grafts Market between 2026 and 2030?

    • USD 751 million, at a CAGR of 4.7%

  • What segmentation does the market report cover?

    • The report is segmented by Product (AAA, and TAA), End-user (Hospitals, and Ambulatory surgical centers), Material (Synthetic materials, and Allograft materials) and Geography (North America, Europe, Asia, Rest of World (ROW))

  • Which regions are analyzed in the report?

    • North America, Europe, Asia and Rest of World (ROW)

  • What are the key growth drivers and market challenges?

    • Strategic mainstreaming of endovascular aneurysm repair techniques, Intensification of regulatory compliance and sustained clinical evidence requirements

  • Who are the major players in the Aortic Stent Grafts Market?

    • Artivion Inc., Bentley InnoMed GmbH, Braile Biomedica, Cardinal Health Inc., Cook Group Inc., Endologix LLC, Endospan Ltd., Getinge AB, Lifetech Scientific Corp., Lombard Medical Ltd., Medtronic Plc, MicroPort Scientific Corp., Sanford Health, Terumo Corp., Vygon SA and W. L. Gore and Associates Inc.

Market Research Insights

  • The aortic stent grafts market is defined by a dynamic push toward value-based healthcare and solutions for complex aortic anatomies. The adoption of endovascular solutions has become standard, now used in over 75% of abdominal aneurysm cases, reflecting a major shift from open surgery.
  • However, significant challenges remain, as up to 40% of patients are still considered anatomically unsuitable for standard devices, creating a demand for patient-specific engineering. This has spurred innovation in next-generation biocompatible materials and aortic arch reconstruction techniques.
  • As healthcare systems move toward bundled payment models, providers are prioritizing devices that demonstrate long-term durability and reduce the need for costly secondary interventions, directly impacting cardiovascular risk management strategies and investments in minimally invasive cardiac surgery.

We can help! Our analysts can customize this aortic stent grafts market research report to meet your requirements.

Get in touch

1. Executive Summary

1.1 Market overview

Executive Summary - Chart on Market Overview
Executive Summary - Data Table on Market Overview
Executive Summary - Chart on Global Market Characteristics
Executive Summary - Chart on Market by Geography
Executive Summary - Chart on Market Segmentation by Product
Executive Summary - Chart on Market Segmentation by End-user
Executive Summary - Chart on Market Segmentation by Material
Executive Summary - Chart on Incremental Growth
Executive Summary - Data Table on Incremental Growth
Executive Summary - Chart on Company Market Positioning

2. Technavio Analysis

2.1 Analysis of price sensitivity, lifecycle, customer purchase basket, adoption rates, and purchase criteria

2.2 Criticality of inputs and Factors of differentiation

Chart on Overview on criticality of inputs and factors of differentiation

2.3 Factors of disruption

Chart on Overview on factors of disruption

2.4 Impact of drivers and challenges

Chart on Impact of drivers and challenges in 2025 and 2030

3. Market Landscape

3.1 Market ecosystem

Chart on Parent Market
Data Table on - Parent Market

3.2 Market characteristics

Chart on Market characteristics analysis

3.3 Value chain analysis

Chart on Value chain analysis

4. Market Sizing

4.1 Market definition

Data Table on Offerings of companies included in the market definition

4.2 Market segment analysis

Market segments

4.3 Market size 2025

4.4 Market outlook: Forecast for 2025-2030

Chart on Global - Market size and forecast 2025-2030 ($ million)
Data Table on Global - Market size and forecast 2025-2030 ($ million)
Chart on Global Market: Year-over-year growth 2025-2030 (%)
Data Table on Global Market: Year-over-year growth 2025-2030 (%)

5. Historic Market Size

5.1 Global Aortic Stent Grafts Market 2020 - 2024

Historic Market Size - Data Table on Global Aortic Stent Grafts Market 2020 - 2024 ($ million)

5.2 Product segment analysis 2020 - 2024

Historic Market Size - Product Segment 2020 - 2024 ($ million)

5.3 End-user segment analysis 2020 - 2024

Historic Market Size - End-user Segment 2020 - 2024 ($ million)

5.4 Material segment analysis 2020 - 2024

Historic Market Size - Material Segment 2020 - 2024 ($ million)

5.5 Geography segment analysis 2020 - 2024

Historic Market Size - Geography Segment 2020 - 2024 ($ million)

5.6 Country segment analysis 2020 - 2024

Historic Market Size - Country Segment 2020 - 2024 ($ million)

6. Qualitative Analysis

6.1 Impact of AI in global aortic stent grafts market

6.2 Impact of geopolitical conflict for global aortic stent grafts market

7. Five Forces Analysis

7.1 Five forces summary

Five forces analysis - Comparison between 2025 and 2030

7.2 Bargaining power of buyers

Bargaining power of buyers - Impact of key factors 2025 and 2030

7.3 Bargaining power of suppliers

Bargaining power of suppliers - Impact of key factors in 2025 and 2030

7.4 Threat of new entrants

Threat of new entrants - Impact of key factors in 2025 and 2030

7.5 Threat of substitutes

Threat of substitutes - Impact of key factors in 2025 and 2030

7.6 Threat of rivalry

Threat of rivalry - Impact of key factors in 2025 and 2030

7.7 Market condition

Chart on Market condition - Five forces 2025 and 2030

8. Market Segmentation by Product

8.1 Market segments

Chart on Product - Market share 2025-2030 (%)
Data Table on Product - Market share 2025-2030 (%)

8.2 Comparison by Product

Chart on Comparison by Product
Data Table on Comparison by Product

8.3 AAA - Market size and forecast 2025-2030

Chart on AAA - Market size and forecast 2025-2030 ($ million)
Data Table on AAA - Market size and forecast 2025-2030 ($ million)
Chart on AAA - Year-over-year growth 2025-2030 (%)
Data Table on AAA - Year-over-year growth 2025-2030 (%)

8.4 TAA - Market size and forecast 2025-2030

Chart on TAA - Market size and forecast 2025-2030 ($ million)
Data Table on TAA - Market size and forecast 2025-2030 ($ million)
Chart on TAA - Year-over-year growth 2025-2030 (%)
Data Table on TAA - Year-over-year growth 2025-2030 (%)

8.5 Market opportunity by Product

Market opportunity by Product ($ million)
Data Table on Market opportunity by Product ($ million)

9. Market Segmentation by End-user

9.1 Market segments

Chart on End-user - Market share 2025-2030 (%)
Data Table on End-user - Market share 2025-2030 (%)

9.2 Comparison by End-user

Chart on Comparison by End-user
Data Table on Comparison by End-user

9.3 Hospitals - Market size and forecast 2025-2030

Chart on Hospitals - Market size and forecast 2025-2030 ($ million)
Data Table on Hospitals - Market size and forecast 2025-2030 ($ million)
Chart on Hospitals - Year-over-year growth 2025-2030 (%)
Data Table on Hospitals - Year-over-year growth 2025-2030 (%)

9.4 Ambulatory surgical centers - Market size and forecast 2025-2030

Chart on Ambulatory surgical centers - Market size and forecast 2025-2030 ($ million)
Data Table on Ambulatory surgical centers - Market size and forecast 2025-2030 ($ million)
Chart on Ambulatory surgical centers - Year-over-year growth 2025-2030 (%)
Data Table on Ambulatory surgical centers - Year-over-year growth 2025-2030 (%)

9.5 Market opportunity by End-user

Market opportunity by End-user ($ million)
Data Table on Market opportunity by End-user ($ million)

10. Market Segmentation by Material

10.1 Market segments

Chart on Material - Market share 2025-2030 (%)
Data Table on Material - Market share 2025-2030 (%)

10.2 Comparison by Material

Chart on Comparison by Material
Data Table on Comparison by Material

10.3 Synthetic materials - Market size and forecast 2025-2030

Chart on Synthetic materials - Market size and forecast 2025-2030 ($ million)
Data Table on Synthetic materials - Market size and forecast 2025-2030 ($ million)
Chart on Synthetic materials - Year-over-year growth 2025-2030 (%)
Data Table on Synthetic materials - Year-over-year growth 2025-2030 (%)

10.4 Allograft materials - Market size and forecast 2025-2030

Chart on Allograft materials - Market size and forecast 2025-2030 ($ million)
Data Table on Allograft materials - Market size and forecast 2025-2030 ($ million)
Chart on Allograft materials - Year-over-year growth 2025-2030 (%)
Data Table on Allograft materials - Year-over-year growth 2025-2030 (%)

10.5 Market opportunity by Material

Market opportunity by Material ($ million)
Data Table on Market opportunity by Material ($ million)

11. Customer Landscape

11.1 Customer landscape overview

Analysis of price sensitivity, lifecycle, customer purchase basket, adoption rates, and purchase criteria

12. Geographic Landscape

12.1 Geographic segmentation

Chart on Market share by geography 2025-2030 (%)
Data Table on Market share by geography 2025-2030 (%)

12.2 Geographic comparison

Chart on Geographic comparison
Data Table on Geographic comparison

12.3 North America - Market size and forecast 2025-2030

Chart on North America - Market size and forecast 2025-2030 ($ million)
Data Table on North America - Market size and forecast 2025-2030 ($ million)
Chart on North America - Year-over-year growth 2025-2030 (%)
Data Table on North America - Year-over-year growth 2025-2030 (%)
Chart on Regional Comparison - North America
Data Table on Regional Comparison - North America

12.3.1 US - Market size and forecast 2025-2030

Chart on US - Market size and forecast 2025-2030 ($ million)
Data Table on US - Market size and forecast 2025-2030 ($ million)
Chart on US - Year-over-year growth 2025-2030 (%)
Data Table on US - Year-over-year growth 2025-2030 (%)

12.3.2 Canada - Market size and forecast 2025-2030

Chart on Canada - Market size and forecast 2025-2030 ($ million)
Data Table on Canada - Market size and forecast 2025-2030 ($ million)
Chart on Canada - Year-over-year growth 2025-2030 (%)
Data Table on Canada - Year-over-year growth 2025-2030 (%)

12.3.3 Mexico - Market size and forecast 2025-2030

Chart on Mexico - Market size and forecast 2025-2030 ($ million)
Data Table on Mexico - Market size and forecast 2025-2030 ($ million)
Chart on Mexico - Year-over-year growth 2025-2030 (%)
Data Table on Mexico - Year-over-year growth 2025-2030 (%)

12.4 Europe - Market size and forecast 2025-2030

Chart on Europe - Market size and forecast 2025-2030 ($ million)
Data Table on Europe - Market size and forecast 2025-2030 ($ million)
Chart on Europe - Year-over-year growth 2025-2030 (%)
Data Table on Europe - Year-over-year growth 2025-2030 (%)
Chart on Regional Comparison - Europe
Data Table on Regional Comparison - Europe

12.4.1 Germany - Market size and forecast 2025-2030

Chart on Germany - Market size and forecast 2025-2030 ($ million)
Data Table on Germany - Market size and forecast 2025-2030 ($ million)
Chart on Germany - Year-over-year growth 2025-2030 (%)
Data Table on Germany - Year-over-year growth 2025-2030 (%)

12.4.2 UK - Market size and forecast 2025-2030

Chart on UK - Market size and forecast 2025-2030 ($ million)
Data Table on UK - Market size and forecast 2025-2030 ($ million)
Chart on UK - Year-over-year growth 2025-2030 (%)
Data Table on UK - Year-over-year growth 2025-2030 (%)

12.4.3 France - Market size and forecast 2025-2030

Chart on France - Market size and forecast 2025-2030 ($ million)
Data Table on France - Market size and forecast 2025-2030 ($ million)
Chart on France - Year-over-year growth 2025-2030 (%)
Data Table on France - Year-over-year growth 2025-2030 (%)

12.4.4 Italy - Market size and forecast 2025-2030

Chart on Italy - Market size and forecast 2025-2030 ($ million)
Data Table on Italy - Market size and forecast 2025-2030 ($ million)
Chart on Italy - Year-over-year growth 2025-2030 (%)
Data Table on Italy - Year-over-year growth 2025-2030 (%)

12.4.5 Spain - Market size and forecast 2025-2030

Chart on Spain - Market size and forecast 2025-2030 ($ million)
Data Table on Spain - Market size and forecast 2025-2030 ($ million)
Chart on Spain - Year-over-year growth 2025-2030 (%)
Data Table on Spain - Year-over-year growth 2025-2030 (%)

12.4.6 The Netherlands - Market size and forecast 2025-2030

Chart on The Netherlands - Market size and forecast 2025-2030 ($ million)
Data Table on The Netherlands - Market size and forecast 2025-2030 ($ million)
Chart on The Netherlands - Year-over-year growth 2025-2030 (%)
Data Table on The Netherlands - Year-over-year growth 2025-2030 (%)

12.5 Asia - Market size and forecast 2025-2030

Chart on Asia - Market size and forecast 2025-2030 ($ million)
Data Table on Asia - Market size and forecast 2025-2030 ($ million)
Chart on Asia - Year-over-year growth 2025-2030 (%)
Data Table on Asia - Year-over-year growth 2025-2030 (%)
Chart on Regional Comparison - Asia
Data Table on Regional Comparison - Asia

12.5.1 China - Market size and forecast 2025-2030

Chart on China - Market size and forecast 2025-2030 ($ million)
Data Table on China - Market size and forecast 2025-2030 ($ million)
Chart on China - Year-over-year growth 2025-2030 (%)
Data Table on China - Year-over-year growth 2025-2030 (%)

12.5.2 Japan - Market size and forecast 2025-2030

Chart on Japan - Market size and forecast 2025-2030 ($ million)
Data Table on Japan - Market size and forecast 2025-2030 ($ million)
Chart on Japan - Year-over-year growth 2025-2030 (%)
Data Table on Japan - Year-over-year growth 2025-2030 (%)

12.5.3 India - Market size and forecast 2025-2030

Chart on India - Market size and forecast 2025-2030 ($ million)
Data Table on India - Market size and forecast 2025-2030 ($ million)
Chart on India - Year-over-year growth 2025-2030 (%)
Data Table on India - Year-over-year growth 2025-2030 (%)

12.5.4 South Korea - Market size and forecast 2025-2030

Chart on South Korea - Market size and forecast 2025-2030 ($ million)
Data Table on South Korea - Market size and forecast 2025-2030 ($ million)
Chart on South Korea - Year-over-year growth 2025-2030 (%)
Data Table on South Korea - Year-over-year growth 2025-2030 (%)

12.5.5 Indonesia - Market size and forecast 2025-2030

Chart on Indonesia - Market size and forecast 2025-2030 ($ million)
Data Table on Indonesia - Market size and forecast 2025-2030 ($ million)
Chart on Indonesia - Year-over-year growth 2025-2030 (%)
Data Table on Indonesia - Year-over-year growth 2025-2030 (%)

12.5.6 Thailand - Market size and forecast 2025-2030

Chart on Thailand - Market size and forecast 2025-2030 ($ million)
Data Table on Thailand - Market size and forecast 2025-2030 ($ million)
Chart on Thailand - Year-over-year growth 2025-2030 (%)
Data Table on Thailand - Year-over-year growth 2025-2030 (%)

12.6 Rest of World (ROW) - Market size and forecast 2025-2030

Chart on Rest of World (ROW) - Market size and forecast 2025-2030 ($ million)
Data Table on Rest of World (ROW) - Market size and forecast 2025-2030 ($ million)
Chart on Rest of World (ROW) - Year-over-year growth 2025-2030 (%)
Data Table on Rest of World (ROW) - Year-over-year growth 2025-2030 (%)
Chart on Regional Comparison - Rest of World (ROW)
Data Table on Regional Comparison - Rest of World (ROW)

12.6.1 Brazil - Market size and forecast 2025-2030

Chart on Brazil - Market size and forecast 2025-2030 ($ million)
Data Table on Brazil - Market size and forecast 2025-2030 ($ million)
Chart on Brazil - Year-over-year growth 2025-2030 (%)
Data Table on Brazil - Year-over-year growth 2025-2030 (%)

12.6.2 Saudi Arabia - Market size and forecast 2025-2030

Chart on Saudi Arabia - Market size and forecast 2025-2030 ($ million)
Data Table on Saudi Arabia - Market size and forecast 2025-2030 ($ million)
Chart on Saudi Arabia - Year-over-year growth 2025-2030 (%)
Data Table on Saudi Arabia - Year-over-year growth 2025-2030 (%)

12.6.3 UAE - Market size and forecast 2025-2030

Chart on UAE - Market size and forecast 2025-2030 ($ million)
Data Table on UAE - Market size and forecast 2025-2030 ($ million)
Chart on UAE - Year-over-year growth 2025-2030 (%)
Data Table on UAE - Year-over-year growth 2025-2030 (%)

12.6.4 Turkey - Market size and forecast 2025-2030

Chart on Turkey - Market size and forecast 2025-2030 ($ million)
Data Table on Turkey - Market size and forecast 2025-2030 ($ million)
Chart on Turkey - Year-over-year growth 2025-2030 (%)
Data Table on Turkey - Year-over-year growth 2025-2030 (%)

12.6.5 Argentina - Market size and forecast 2025-2030

Chart on Argentina - Market size and forecast 2025-2030 ($ million)
Data Table on Argentina - Market size and forecast 2025-2030 ($ million)
Chart on Argentina - Year-over-year growth 2025-2030 (%)
Data Table on Argentina - Year-over-year growth 2025-2030 (%)

12.6.6 Colombia - Market size and forecast 2025-2030

Chart on Colombia - Market size and forecast 2025-2030 ($ million)
Data Table on Colombia - Market size and forecast 2025-2030 ($ million)
Chart on Colombia - Year-over-year growth 2025-2030 (%)
Data Table on Colombia - Year-over-year growth 2025-2030 (%)

12.6.7 South Africa - Market size and forecast 2025-2030

Chart on South Africa - Market size and forecast 2025-2030 ($ million)
Data Table on South Africa - Market size and forecast 2025-2030 ($ million)
Chart on South Africa - Year-over-year growth 2025-2030 (%)
Data Table on South Africa - Year-over-year growth 2025-2030 (%)

12.6.8 Israel - Market size and forecast 2025-2030

Chart on Israel - Market size and forecast 2025-2030 ($ million)
Data Table on Israel - Market size and forecast 2025-2030 ($ million)
Chart on Israel - Year-over-year growth 2025-2030 (%)
Data Table on Israel - Year-over-year growth 2025-2030 (%)

12.7 Market opportunity by geography

Market opportunity by geography ($ million)
Data Tables on Market opportunity by geography ($ million)

13. Drivers, Challenges, and Opportunity

13.1 Market drivers

Strategic mainstreaming of endovascular aneurysm repair techniques
Industrialization of complex anatomy solutions and custom graft engineering
Structural expansion of geriatric care and cardiovascular risk management

13.2 Market challenges

Intensification of regulatory compliance and sustained clinical evidence requirements
Technical friction of anatomical exclusions and minimally invasive limitations
Economic burden of reimbursement volatility and bundled payment shifts

13.3 Impact of drivers and challenges

Impact of drivers and challenges in 2025 and 2030

13.4 Market opportunities

Institutionalization of personalized fenestrated and branched endovascular
Proliferation of low-profile delivery systems and next-generation biocompatible
Expansion of endovascular solutions for ascending aortic

14. Competitive Landscape

14.1 Overview

14.2

Overview on criticality of inputs and factors of differentiation

14.3 Landscape disruption

Overview on factors of disruption

14.4 Industry risks

Impact of key risks on business

15. Competitive Analysis

15.1 Companies profiled

Companies covered

15.2 Company ranking index

15.3 Market positioning of companies

Matrix on companies position and classification

15.4 Artivion Inc.

Artivion Inc. - Overview
Artivion Inc. - Business segments
Artivion Inc. - Key offerings
Artivion Inc. - Segment focus
SWOT

15.5 Bentley InnoMed GmbH

Bentley InnoMed GmbH - Overview
Bentley InnoMed GmbH - Product / Service
Bentley InnoMed GmbH - Key offerings
SWOT

15.6 Braile Biomedica

Braile Biomedica - Overview
Braile Biomedica - Product / Service
Braile Biomedica - Key offerings
SWOT

15.7 Cardinal Health Inc.

Cardinal Health Inc. - Overview
Cardinal Health Inc. - Business segments
Cardinal Health Inc. - Key offerings
Cardinal Health Inc. - Segment focus
SWOT

15.8 Cook Group Inc.

Cook Group Inc. - Overview
Cook Group Inc. - Product / Service
Cook Group Inc. - Key offerings
SWOT

15.9 Endologix LLC

Endologix LLC - Overview
Endologix LLC - Product / Service
Endologix LLC - Key offerings
SWOT

15.10 Getinge AB

Getinge AB - Overview
Getinge AB - Business segments
Getinge AB - Key offerings
Getinge AB - Segment focus
SWOT

15.11 Lifetech Scientific Corp.

Lifetech Scientific Corp. - Overview
Lifetech Scientific Corp. - Business segments
Lifetech Scientific Corp. - Key offerings
Lifetech Scientific Corp. - Segment focus
SWOT

15.12 Lombard Medical Ltd.

Lombard Medical Ltd. - Overview
Lombard Medical Ltd. - Product / Service
Lombard Medical Ltd. - Key offerings
SWOT

15.13 Medtronic Plc

Medtronic Plc - Overview
Medtronic Plc - Business segments
Medtronic Plc - Key offerings
Medtronic Plc - Segment focus
SWOT

15.14 MicroPort Scientific Corp.

MicroPort Scientific Corp. - Overview
MicroPort Scientific Corp. - Business segments
MicroPort Scientific Corp. - Key offerings
MicroPort Scientific Corp. - Segment focus
SWOT

15.15 Sanford Health

Sanford Health - Overview
Sanford Health - Product / Service
Sanford Health - Key offerings
SWOT

15.16 Terumo Corp.

Terumo Corp. - Overview
Terumo Corp. - Business segments
Terumo Corp. - Key offerings
Terumo Corp. - Segment focus
SWOT

15.17 Vygon SA

Vygon SA - Overview
Vygon SA - Product / Service
Vygon SA - Key offerings
SWOT

15.18 W. L. Gore and Associates Inc.

W. L. Gore and Associates Inc. - Overview
W. L. Gore and Associates Inc. - Product / Service
W. L. Gore and Associates Inc. - Key offerings
SWOT

16. Appendix

16.1 Scope of the report

Market definition
Objectives
Notes and caveats

16.2 Inclusions and exclusions checklist

Inclusions checklist
Exclusions checklist

16.3 Currency conversion rates for US$

16.4 Research methodology

16.5 Data procurement

Information sources

16.6 Data validation

16.7 Validation techniques employed for market sizing

16.8 Data synthesis

16.9 360 degree market analysis

16.10 List of abbreviations

Research Methodology

Technavio presents a detailed picture of the market by way of study, synthesis, and summation of data from multiple sources. The analysts have presented the various facets of the market with a particular focus on identifying the key industry influencers. The data thus presented is comprehensive, reliable, and the result of extensive research, both primary and secondary.

INFORMATION SOURCES

Primary sources

  • Manufacturers and suppliers
  • Channel partners
  • Industry experts
  • Strategic decision makers

Secondary sources

  • Industry journals and periodicals
  • Government data
  • Financial reports of key industry players
  • Historical data
  • Press releases

DATA ANALYSIS

Data Synthesis

  • Collation of data
  • Estimation of key figures
  • Analysis of derived insights

Data Validation

  • Triangulation with data models
  • Reference against proprietary databases
  • Corroboration with industry experts

REPORT WRITING

Qualitative

  • Market drivers
  • Market challenges
  • Market trends
  • Five forces analysis

Quantitative

  • Market size and forecast
  • Market segmentation
  • Geographical insights
  • Competitive landscape

Interested in this report?

Get your sample now to see our research methodology and insights!

Download Now

Frequently Asked Questions

Aortic Stent Grafts market growth will increase by USD 751.0 million during 2026-2030.

The Aortic Stent Grafts market is expected to grow at a CAGR of 4.7% during 2026-2030.

Aortic Stent Grafts market is segmented by Product (AAA, TAA) End-user (Hospitals, Ambulatory surgical centers) Material (Synthetic materials, Allograft materials)

Artivion Inc., Bentley InnoMed GmbH, Braile Biomedica, Cardinal Health Inc., Cook Group Inc., Endologix LLC, Endospan Ltd., Getinge AB, Lifetech Scientific Corp., Lombard Medical Ltd., Medtronic Plc, MicroPort Scientific Corp., Sanford Health, Terumo Corp., Vygon SA, W. L. Gore and Associates Inc. are a few of the key vendors in the Aortic Stent Grafts market.

North America will register the highest growth rate of 49.3% among the other regions. Therefore, the Aortic Stent Grafts market in North America is expected to garner significant business opportunities for the vendors during the forecast period.

US, Canada, Mexico, Germany, UK, France, Italy, Spain, The Netherlands, China, Japan, India, South Korea, Indonesia, Thailand, Brazil, Saudi Arabia, UAE, Turkey, Argentina, Colombia, South Africa, Israel

  • Strategic mainstreaming of endovascular aneurysm repair techniques is the driving factor this market.

The Aortic Stent Grafts market vendors should focus on grabbing business opportunities from the Product segment as it accounted for the largest market share in the base year.
RIA - Research AI Assistant
Ask RIA