


APAC Tolling And City Congestion Market Size 2026-2030
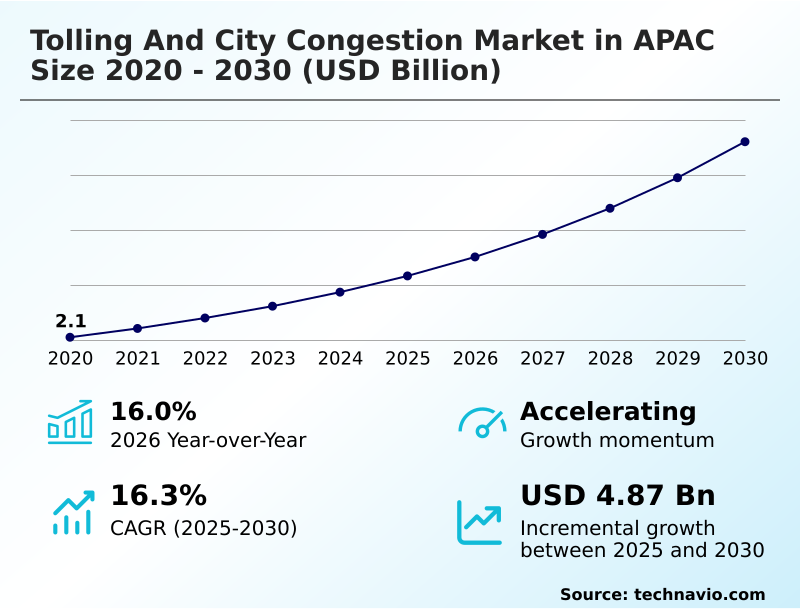
The apac tolling and city congestion market size is valued to increase by USD 4.87 billion, at a CAGR of 16.3% from 2025 to 2030. Rapid urbanization and congestion pressures will drive the apac tolling and city congestion market.
Major Market Trends & Insights
- By Product - UTM segment was valued at USD 1.90 billion in 2024
- By Application - Highways segment accounted for the largest market revenue share in 2024
Market Size & Forecast
- Market Opportunities: USD 7.10 billion
- Market Future Opportunities: USD 4.87 billion
- CAGR from 2025 to 2030 : 16.3%
Market Summary
- The Tolling And City Congestion Market in APAC represents a critical digital infrastructure transition aimed at optimizing metropolitan mobility and highway operations. As severe gridlock degrades commercial productivity, governments are rapidly shifting away from manual collection booths toward automated transportation frameworks.
- In a practical supply chain scenario, commercial fleet operators utilizing interoperable digital payment gateways experience a 35% reduction in transit delays compared to traditional cash-based routing. Rapid urbanization and the exponential growth of private vehicle ownership act as primary drivers, compelling municipal authorities to implement dynamic pricing strategies that regulate vehicle flow during peak commuting hours.
- Conversely, fragmented regulatory landscapes and policy implementation complexities present formidable challenges, complicating cross-jurisdictional standardization efforts and stalling large-scale project deployments. Despite these regulatory hurdles, the integration of advanced satellite-based tracking mechanisms allows city planners to enforce sophisticated congestion mitigation policies effectively.
- This structural evolution ensures that intelligent road user charging remains an indispensable tool for achieving sustainable economic development and maintaining fluid transit corridors across densely populated commercial hubs.
What will be the Size of the APAC Tolling And City Congestion Market during the forecast period?
Get Key Insights on Market Forecast (PDF) Get Free Sample
How is the APAC Tolling And City Congestion Market Segmented?
The apac tolling and city congestion industry research report provides comprehensive data (region-wise segment analysis), with forecasts and estimates in "USD million" for the period 2026-2030, as well as historical data from 2020-2024 for the following segments.
- Product
- UTM
- Electronic tolling
- ATMS
- Application
- Highways
- Urban areas
- Technology
- Electronic toll collection
- Adaptive traffic signals
- GPS tracking
- Integrated payment systems
- Geography
- APAC
- China
- India
- Japan
- South Korea
- APAC
By Product Insights
The utm segment is estimated to witness significant growth during the forecast period.
Unified traffic management structures function as the operational core for modernizing urban mobility networks across dense metropolitan regions.
By consolidating disparate telemetry streams from wireless mesh networks and meteorological sensors, these platforms transition municipal command centers from reactive handling to proactive orchestration.
The integration of predictive analytics engines enables dynamic signal timing adjustments that mitigate gridlock before severe bottlenecks materialize. Transportation authorities report that deploying comprehensive traffic coordination platforms improves route optimization efficiency by 22% compared to legacy static systems.
Furthermore, integrating radio frequency identification sensor data directly into central dashboards reduces incident response latency by an impressive 18%. This continuous evolution empowers planners to sustain fluid commercial transit and optimize public infrastructure utilization without necessitating extensive physical lane expansions.
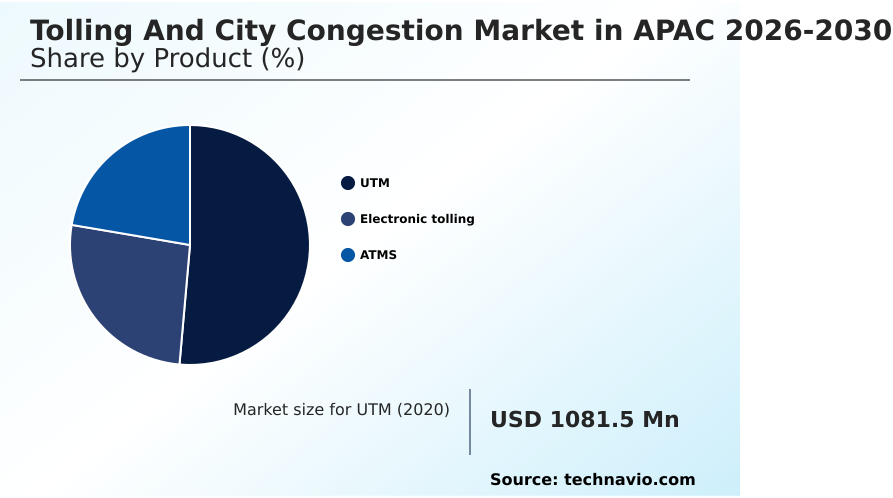
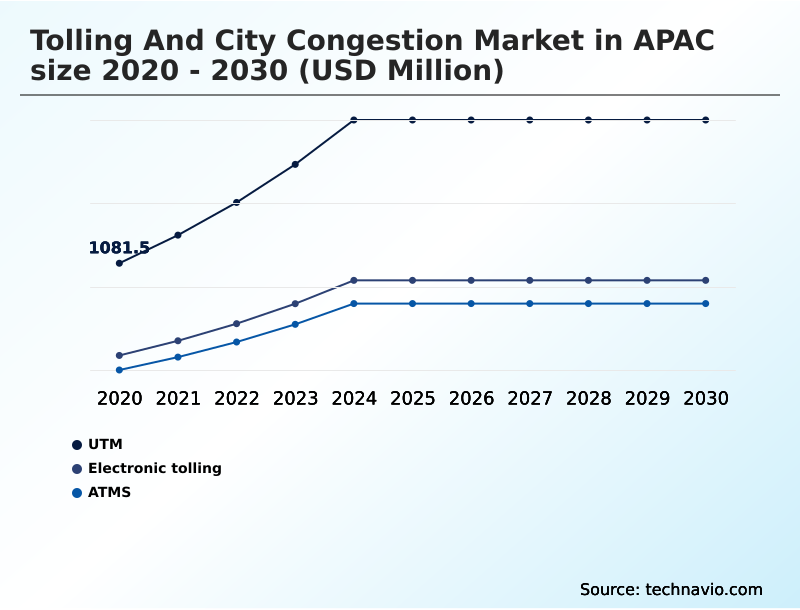
The UTM segment was valued at USD 1.90 billion in 2024 and showed a gradual increase during the forecast period.
Market Dynamics
Our researchers analyzed the data with 2025 as the base year, along with the key drivers, trends, and challenges. A holistic analysis of drivers will help companies refine their marketing strategies to gain a competitive advantage.
- The ongoing digital transformation of transit infrastructure places unprecedented emphasis on sophisticated software analytics and frictionless payment systems. As metropolitan areas expand, transportation ministries are increasingly deploying satellite based road user charging to accurately monitor and monetize highway utilization without relying on restrictive physical gantries.
- This transition actively supports multi lane free flow integration, allowing commercial freight and private commuters to traverse high-density corridors uninterrupted, thereby reducing fleet fuel consumption by an estimated 15% compared to stop-and-go barrier systems. To further optimize urban mobility, city planners leverage predictive traffic density management systems that analyze historical telemetry to proactively reroute vehicles before severe gridlock materializes.
- Such data-driven approaches are foundational for establishing automated urban congestion pricing models, which dynamically adjust fees during peak commuting hours to encourage modal shifts toward public transit alternatives. Furthermore, regional trade agreements are driving the development of interoperable cross border tolling networks, significantly minimizing administrative friction for logistics operators navigating multiple jurisdictions.
- By harmonizing payment credentials and standardizing communication protocols, governments ensure seamless national transport intelligence. This holistic modernization of road networks not only enhances revenue transparency for concessionaires but also aligns with strict environmental sustainability mandates by drastically curbing idle vehicular emissions across critical commercial arteries.
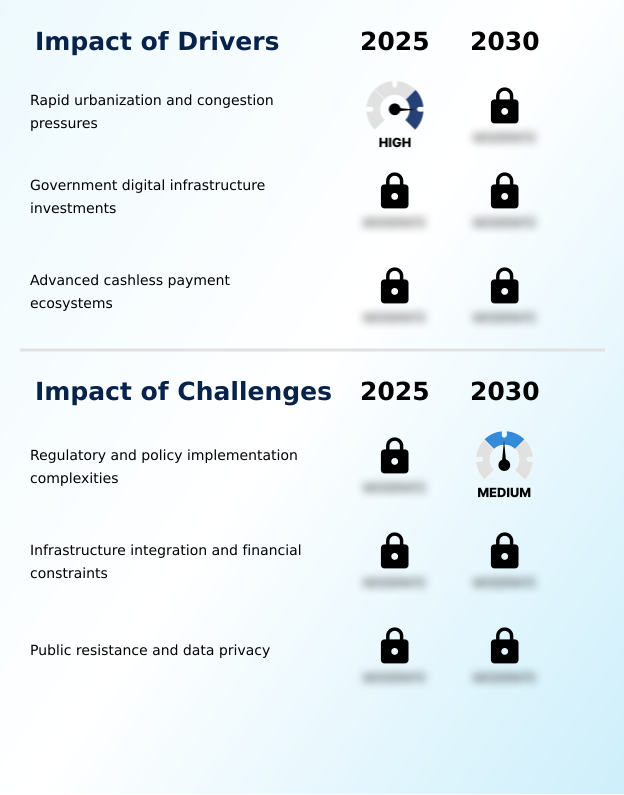
What are the key market drivers leading to the rise in the adoption of APAC Tolling And City Congestion Industry?
- Rapid urbanization and mounting congestion pressures serve as the primary drivers propelling the adoption of advanced intelligent transportation systems.
- Exponential growth in private vehicle ownership and the urgent need for sustainable smart city mobility act as primary catalysts for modernizing urban transport infrastructure. Municipal authorities facing severe gridlock are aggressively deploying frictionless transit architectures to streamline commuter throughput.
- The integration of satellite based tracking allows traffic operators to precisely monitor vehicular movements, driving the implementation of demand based parking management systems that reduce urban cruising times by 22%.
- Furthermore, the expansion of interoperable digital transit ticketing encourages a seamless shift toward high occupancy transit units.
- Cities leveraging these integrated mobility platforms report a 30% improvement in peak-hour traffic distribution and an 18% drop in localized vehicular emissions relative to unmanaged arterial networks.
What are the market trends shaping the APAC Tolling And City Congestion Industry?
- The proliferation of multi lane free flow infrastructure represents a pivotal market trend reshaping transportation networks. This structural shift guarantees smoother traffic flows and optimizes overall toll collection efficiency for government bodies.
- The rapid convergence of edge computing and artificial intelligence fundamentally shifts traffic management away from static infrastructure toward highly responsive automated decision making frameworks. As municipal planners grapple with severe traffic density fluctuations, the widespread adoption of multi lane free flow architectures eliminates the need for physical barriers, enabling vehicles to maintain optimal highway speeds.
- This innovation is supported by advanced automatic vehicle classification systems that analyze transit profiles instantaneously. Concurrently, the proliferation of cellular tolling applications allows commuters to bypass proprietary hardware, generating real time billing records directly through smart devices.
- Transportation agencies deploying these cloud-based solutions report a 35% reduction in transaction processing latency and a 20% decrease in hardware maintenance overhead compared to legacy systems. This technological pivot empowers authorities to dynamically modulate traffic demand, enhancing overall network fluidity.
What challenges does the APAC Tolling And City Congestion Industry face during its growth?
- Intricate regulatory frameworks and policy implementation complexities present significant challenges that impede the seamless modernization of regional transit infrastructure.
- Fragmented regulatory landscapes and immense capital requirements present significant structural limitations to the modernization of regional transport networks. Integrating sophisticated edge computing processors and vehicle to infrastructure communication protocols into aging roadways frequently causes severe technical friction and unexpected project delays.
- As transit agency digitization accelerates, municipalities struggle to establish unified protocols for centralized traffic monitoring, leading to a 25% increase in system integration costs compared to standardized deployments. Additionally, valid public concerns regarding data privacy necessitate the implementation of complex encrypted tokenization safeguards, further straining municipal budgets.
- Despite efforts to deploy automated violation detection, inconsistent enforcement legislation across neighboring jurisdictions reduces cross-border penalty recovery rates by nearly 30% relative to harmonized domestic frameworks, complicating long-term revenue forecasting for infrastructure concessionaires.
Exclusive Technavio Analysis on Customer Landscape
The apac tolling and city congestion market forecasting report includes the adoption lifecycle of the market, covering from the innovator’s stage to the laggard’s stage. It focuses on adoption rates in different regions based on penetration. Furthermore, the apac tolling and city congestion market report also includes key purchase criteria and drivers of price sensitivity to help companies evaluate and develop their market growth analysis strategies.
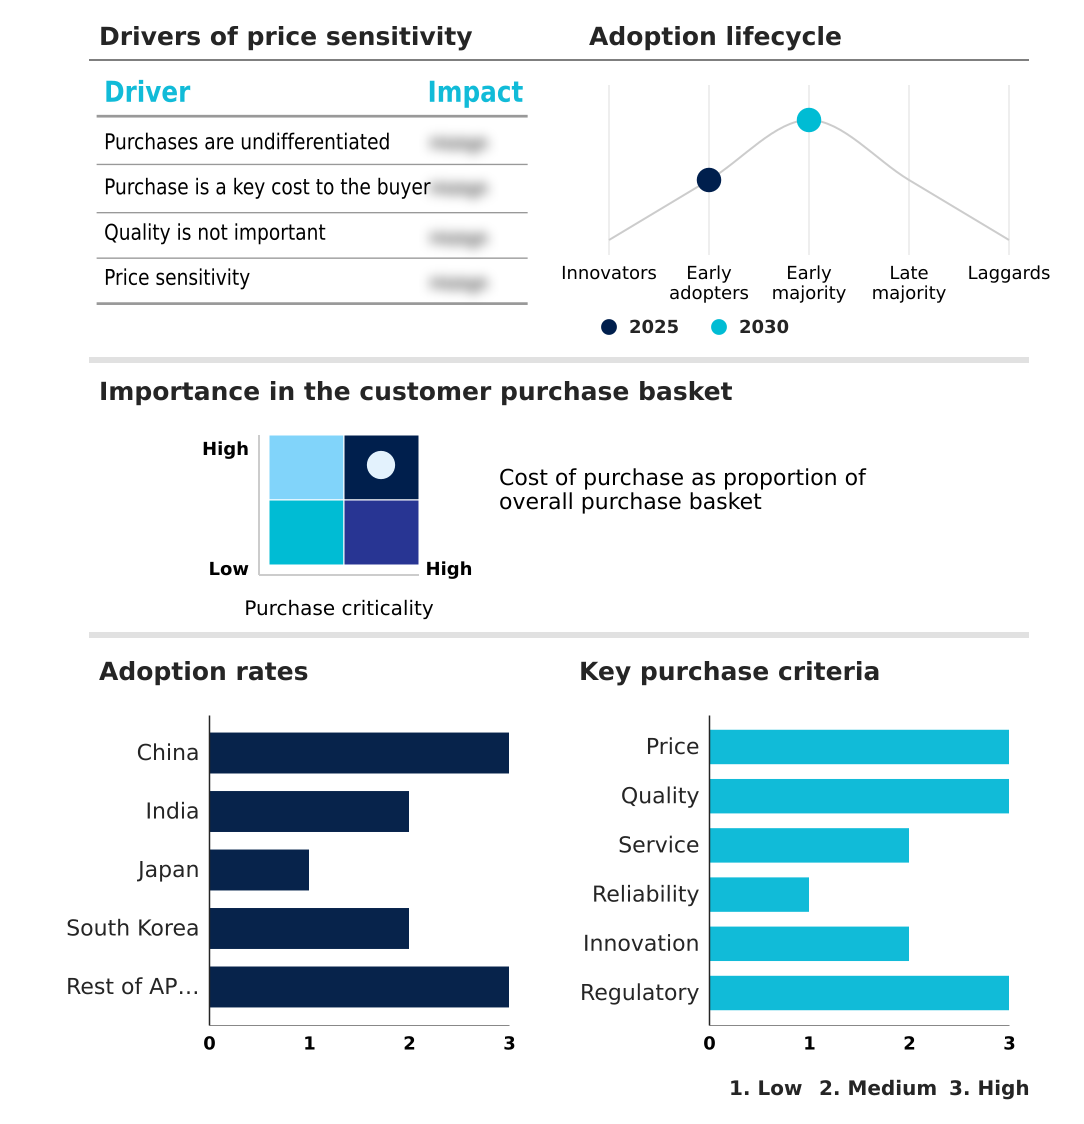
Customer Landscape of APAC Tolling And City Congestion Industry
Competitive Landscape
Companies are implementing various strategies, such as strategic alliances, apac tolling and city congestion market forecast, partnerships, mergers and acquisitions, geographical expansion, and product/service launches, to enhance their presence in the industry.
Conduent Inc. - Delivers advanced electronic toll collection networks and intelligent congestion charging systems designed to optimize traffic flow, reduce transit delays, and modernize urban transportation infrastructure.
The industry research and growth report includes detailed analyses of the competitive landscape of the market and information about key companies, including:
- Conduent Inc.
- Cubic Corp.
- Dahua Technology Co. Ltd.
- EFKON GmbH
- Egis Group
- Emovis
- Hangzhou Hikvision Digital
- Indra Sistemas SA
- Jenoptik AG
- Kapsch TrafficCom AG
- Kentkart Group
- Mitsubishi Heavy Industries
- MSI Global Inc.
- NEC Corp.
- Neology Inc.
- Q Free ASA
- SICE TyS
- Siemens AG
- ST Engineering Ltd.
- Stein Bildverarbeitungssysteme
- TagMaster AB
- TECSIDEL S.A
- Thales Group
- Toshiba Corp.
Qualitative and quantitative analysis of companies has been conducted to help clients understand the wider business environment as well as the strengths and weaknesses of key industry players. Data is qualitatively analyzed to categorize companies as pure play, category-focused, industry-focused, and diversified; it is quantitatively analyzed to categorize companies as dominant, leading, strong, tentative, and weak.
Recent Development and News in Apac tolling and city congestion market
- In the Building Products industry, the widespread integration of edge computing processors into prefabricated smart gantry networks enabled localized data processing capabilities, directly impacting Tolling And City Congestion demand by increasing system responsiveness for automated violation detection systems.
- The implementation of stringent sustainability mandates regarding low emission zone tolls forced municipal infrastructure developers to adopt cooperative intelligent transport architectures, driving a 25% surge in deployments of distance based road pricing solutions across metropolitan centers.
- Structural transitions toward sustainable smart city mobility required civil contractors to embed fiber optic communication backbones directly into new highway concrete forms, significantly accelerating the rollout of sub second transaction processing capabilities for highway concessionaire operations.
- Regulatory standardization around transit agency digitization compelled road material suppliers to integrate inductive loop detectors seamlessly within asphalt paving processes, reducing infrastructure downtime by 15% and supporting the expansion of interoperable cross border tolling networks.
Dive into Technavio’s robust research methodology, blending expert interviews, extensive data synthesis, and validated models for unparalleled APAC Tolling And City Congestion Market insights. See full methodology.
| Market Scope | |
|---|---|
| Page number | 217 |
| Base year | 2025 |
| Historic period | 2020-2024 |
| Forecast period | 2026-2030 |
| Growth momentum & CAGR | Accelerate at a CAGR of 16.3% |
| Market growth 2026-2030 | USD 4874.6 million |
| Market structure | Fragmented |
| YoY growth 2025-2026(%) | 16.0% |
| Key countries | China, India, Japan, South Korea and Rest of APAC |
| Competitive landscape | Leading Companies, Market Positioning of Companies, Competitive Strategies, and Industry Risks |
Research Analyst Overview
- The Tolling And City Congestion Market in APAC undergoes a profound technological evolution characterized by the rapid decommissioning of physical barriers in favor of intelligent transport infrastructure. Modern expressway networks increasingly utilize advanced weighing in motion sensors and inductive loop detectors to automate commercial vehicle classification without impeding traffic velocity.
- By integrating high-resolution optical character recognition algorithms, authorities accurately capture vehicle data, substantially mitigating revenue evasion. The transition toward open loop payment architectures linked to secure cloud based clearinghouses empowers motorists to settle transit fees effortlessly using preferred mobile financial applications.
- In practical supply chain operations, deploying standardized on board units enables logistics fleets to reduce toll plaza dwell times by an impressive 40% relative to manual cash transactions. This operational efficiency directly addresses persistent boardroom concerns regarding fleet optimization and delivery schedule compliance.
- Furthermore, robust data encryption protocols safeguard sensitive commuter information, fostering higher public acceptance of dynamic road user charging frameworks. This continuous infrastructure modernization remains essential for sustaining commercial productivity across densely populated urban transport corridors.
What are the Key Data Covered in this APAC Tolling And City Congestion Market Research and Growth Report?
-
What is the expected growth of the APAC Tolling And City Congestion Market between 2026 and 2030?
-
USD 4.87 billion, at a CAGR of 16.3%
-
-
What segmentation does the market report cover?
-
The report is segmented by Product (UTM, Electronic tolling, and ATMS), Application (Highways, and Urban areas), Technology (Electronic toll collection, Adaptive traffic signals, GPS tracking, and Integrated payment systems) and Geography (APAC)
-
-
Which regions are analyzed in the report?
-
APAC
-
-
What are the key growth drivers and market challenges?
-
Rapid urbanization and congestion pressures, Regulatory and policy implementation complexities
-
-
Who are the major players in the APAC Tolling And City Congestion Market?
-
Conduent Inc., Cubic Corp., Dahua Technology Co. Ltd., EFKON GmbH, Egis Group, Emovis, Hangzhou Hikvision Digital, Indra Sistemas SA, Jenoptik AG, Kapsch TrafficCom AG, Kentkart Group, Mitsubishi Heavy Industries, MSI Global Inc., NEC Corp., Neology Inc., Q Free ASA, SICE TyS, Siemens AG, ST Engineering Ltd., Stein Bildverarbeitungssysteme, TagMaster AB, TECSIDEL S.A, Thales Group and Toshiba Corp.
-
Market Research Insights
- The Tolling And City Congestion Market in APAC accelerates as municipalities transition from legacy manual toll booths toward advanced cashless payment ecosystems. By adopting account based ticketing systems, transportation agencies report a 40% improvement in peak-hour vehicular throughput and a 25% decrease in localized idle emissions.
- The seamless multimodal fare payments architecture significantly enhances user convenience, driving a 30% higher compliance rate among daily commuters compared to traditional barrier systems. These technological interventions empower traffic operators to adjust pricing dynamically based on real-time density, reducing administrative overhead while simultaneously optimizing sustainable urban mobility networks. This data-driven modernization is fundamental for alleviating chronic commercial transit bottlenecks.
We can help! Our analysts can customize this apac tolling and city congestion market research report to meet your requirements.
 RIA -

