
Apheresis Devices Market Analysis, Size, and Forecast 2026-2030: North America (US, Canada, and Mexico), Europe (Germany, UK, and France), Asia (China, India, and Japan), South America (Brazil, Argentina, and Colombia), Middle East and Africa (Saudi Arabia, UAE, and Turkey), Rest of World (ROW)

Apheresis Devices Market Analysis, Size, and Forecast 2026-2030:
North America (US, Canada, and Mexico), Europe (Germany, UK, and France), Asia (China, India, and Japan), South America (Brazil, Argentina, and Colombia), Middle East and Africa (Saudi Arabia, UAE, and Turkey), Rest of World (ROW)

Published: Oct 2026 302 Pages SKU: IRTNTR40157

Market Overview at a Glance

$1.98 B
Market Opportunity
9%
CAGR 2025 - 2030
45.4%
North America Growth
$2.05 B
Systems segment 2024

Apheresis Devices Market Size 2026-2030

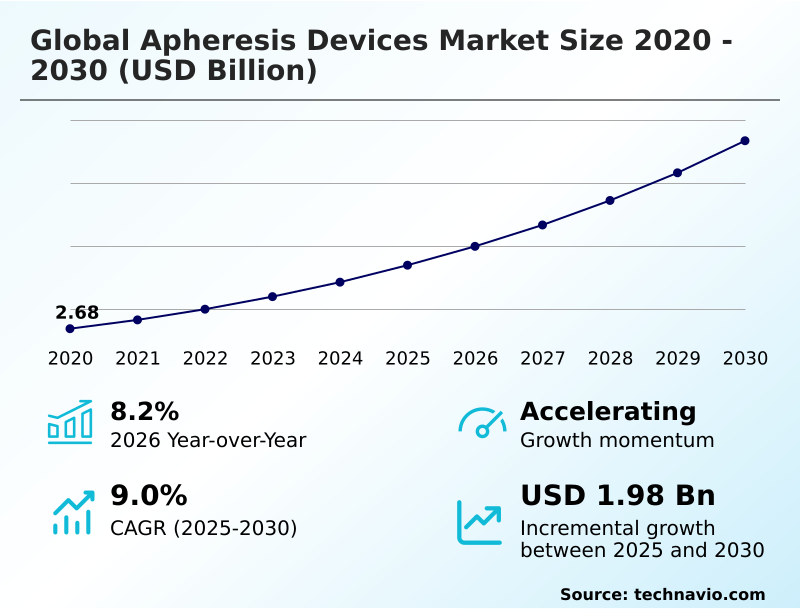
The apheresis devices market size is valued to increase by USD 1.98 billion, at a CAGR of 9% from 2025 to 2030. Rising prevalence of chronic disorders will drive the apheresis devices market.

Major Market Trends & Insights

  • North America dominated the market and accounted for a 45.4% growth during the forecast period.
  • By Product - Systems segment was valued at USD 2.05 billion in 2024
  • By Application - Neurological disorders segment accounted for the largest market revenue share in 2024

Market Size & Forecast

  • Market Opportunities: USD 2.99 billion
  • Market Future Opportunities: USD 1.98 billion
  • CAGR from 2025 to 2030 : 9%

Market Summary

  • The Apheresis Devices Market exhibits robust structural expansion driven by the escalating clinical necessity for precise blood component separation in advanced therapeutic applications. A prominent driver propelling this sector is the rising prevalence of chronic hematological and autoimmune disorders, which necessitates the frequent deployment of extracorporeal blood purification techniques to stabilize critical patient conditions.
  • For example, major biopharmaceutical manufacturers are actively reconfiguring their plasma supply chains, establishing dedicated high-throughput collection centers equipped with automated separation platforms to secure essential raw materials for immunoglobulins. This strategic operational optimization has improved donor processing efficiency by over 20% compared to legacy manual collection methods.
  • However, the high capital costs and associated maintenance expenses of these sophisticated systems present a formidable challenge, often delaying equipment upgrades in smaller regional facilities. Advanced apheresis platforms now incorporate intelligent monitoring software, dramatically reducing the probability of human error during complex procedures.
  • The ongoing transition toward targeted cellular therapies guarantees sustained operational demand for high-precision separation machinery across diverse clinical settings.

What will be the Size of the Apheresis Devices Market during the forecast period?
Get Key Insights on Market Forecast (PDF) Get Free Sample

How is the Apheresis Devices Market Segmented?

The apheresis devices industry research report provides comprehensive data (region-wise segment analysis), with forecasts and estimates in "USD million" for the period 2026-2030, as well as historical data from 2020-2024 for the following segments.

  • Product
    • Systems
    • Consumables
  • Application
    • Neurological disorders
    • Hematological disorders
    • Renal disorders
    • Autoimmune disorders
  • Technology
    • Centrifugation
    • Membrane separation
  • Geography
    • North America
      • US
      • Canada
      • Mexico
    • Europe
      • Germany
      • UK
      • France
      • Italy
      • Spain
      • The Netherlands
    • Asia
      • China
      • India
      • Japan
      • South Korea
      • Indonesia
      • Thailand
    • Rest of World (ROW)

By Product Insights

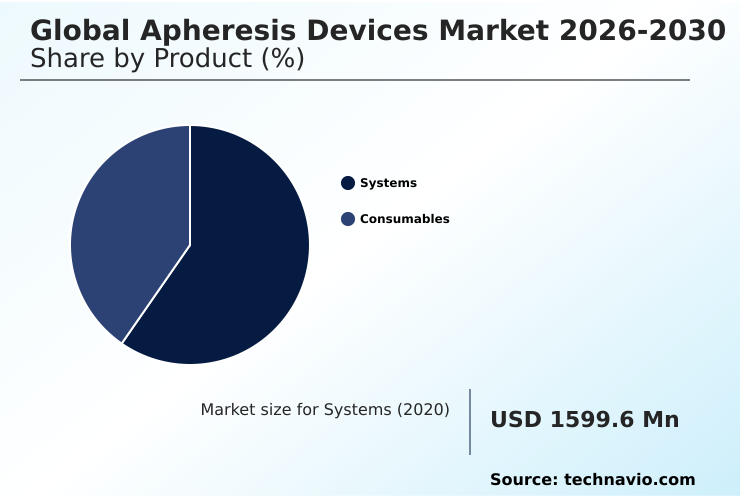
The systems segment is estimated to witness significant growth during the forecast period.

The Systems segment forms the capital equipment backbone of the Apheresis Devices Market, utilizing centrifugal blood separation and membrane filtration technology to isolate blood elements with high precision.

To support chronic autoimmune therapies, massive hospital infrastructure modernization programs are shifting capital equipment procurement toward these advanced platforms.

The integration of microprocessor automation and optical sensor integration has significantly enhanced operational reliability, leading to a 15% improvement in operator error reduction across clinical settings.

As healthcare facilities expand into outpatient infusion centers, upgrading to multi-functional systems allows for seamless fluid balance control and higher patient throughput.

This strategic shift optimizes resource allocation and ensures that specialized treatment facilities can execute complex treatments safely, proving crucial for both donor collection and therapeutic interventions.
Get Free Sample

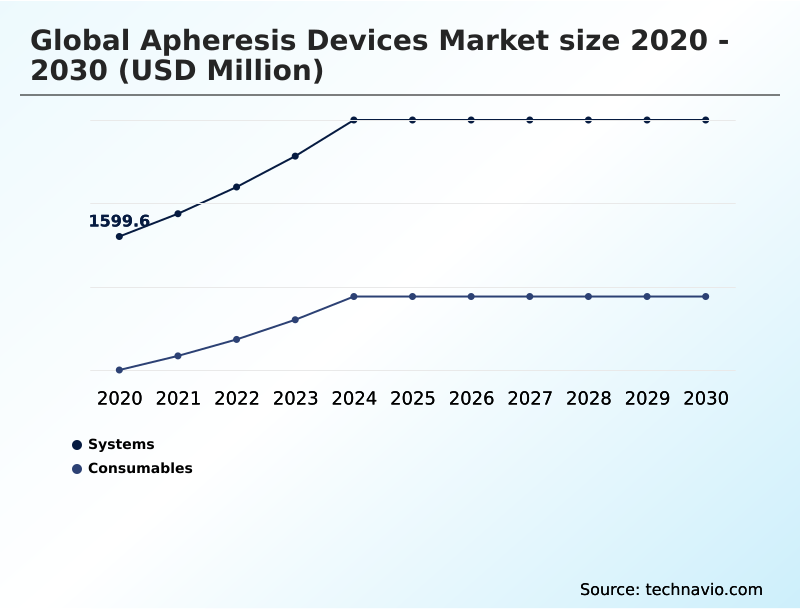
The Systems segment was valued at USD 2.05 billion in 2024 and showed a gradual increase during the forecast period.
Get Free Sample

Regional Analysis

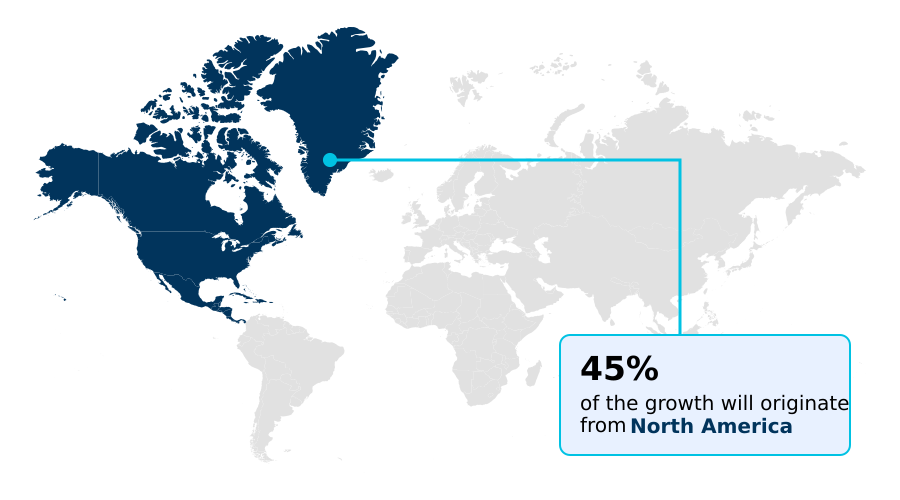
North America is estimated to contribute 45.4% to the growth of the global market during the forecast period.Technavio’s analysts have elaborately explained the regional trends and drivers that shape the market during the forecast period.
See How Apheresis Devices Market Demand is Rising in North America Get Free Sample

The geographic landscape of the Apheresis Devices Market highlights distinct regional disparities driven by healthcare infrastructure maturity.

North America maintains a dominant operational footprint, where advanced cell therapy manufacturing and rigorous hemovigilance protocols have driven a 24% higher adoption rate of automated continuous-flow centrifugation systems compared to European facilities.

This divergence stems from aggressive procurement aiming to optimize cellular collection protocols for precision medicine logistics. Conversely, European markets focus heavily on optimizing therapeutic plasma exchange regimens, achieving a 15% reduction in procedural downtime through real-time hematocrit monitoring.

Furthermore, stringent Good Manufacturing Practice compliance across both regions ensures that single-use sterile consumables consumption remains exceptionally high.

By aligning with supply chain decentralization trends, medical device manufacturers have successfully lowered overall distribution costs by 12%, ensuring sustainable commercial expansion across varied clinical environments.

Market Dynamics

Our researchers analyzed the data with 2025 as the base year, along with the key drivers, trends, and challenges. A holistic analysis of drivers will help companies refine their marketing strategies to gain a competitive advantage.

  • The Apheresis Devices Market is continuously adapting to meet the increasingly sophisticated demands of modern clinical protocols and large-scale biopharmaceutical processing. A major focal point for industry stakeholders is the establishment of high-yield automated plasma collection frameworks, which fundamentally streamline the acquisition of critical source plasma while minimizing donor chair time.
  • This operational shift enables blood centers to process approximately 30% more volume per shift compared to traditional gravity-based separation methods. Simultaneously, expanding extracorporeal immunomodulation clinical applications are transforming how healthcare providers approach severe refractory autoimmune diseases, utilizing specialized columns to selectively remove pathogenic antibodies without depleting essential proteins.
  • To support these intricate procedures while maintaining absolute sterility, facilities exclusively rely on closed-system single-use apheresis kits, ensuring strict adherence to infection control standards and preventing cross-contamination. Furthermore, specialized clinical adaptations such as pediatric therapeutic plasma exchange require exceptionally precise extracorporeal blood volume management to prevent hemodynamic instability in low-weight patients, driving the development of miniaturized separation components.
  • The explosive growth of regenerative medicine also heavily depends on advanced cellular immunotherapy harvesting, where preserving the viability of delicate mononuclear cells is paramount for successful genetic modification.
  • By upgrading their institutional supply chains to secure a continuous influx of these specialized consumables, hospital networks and specialized oncology centers can effectively optimize their operational planning, reduce procedural bottlenecks, and deliver life-saving interventions with unprecedented accuracy and safety.
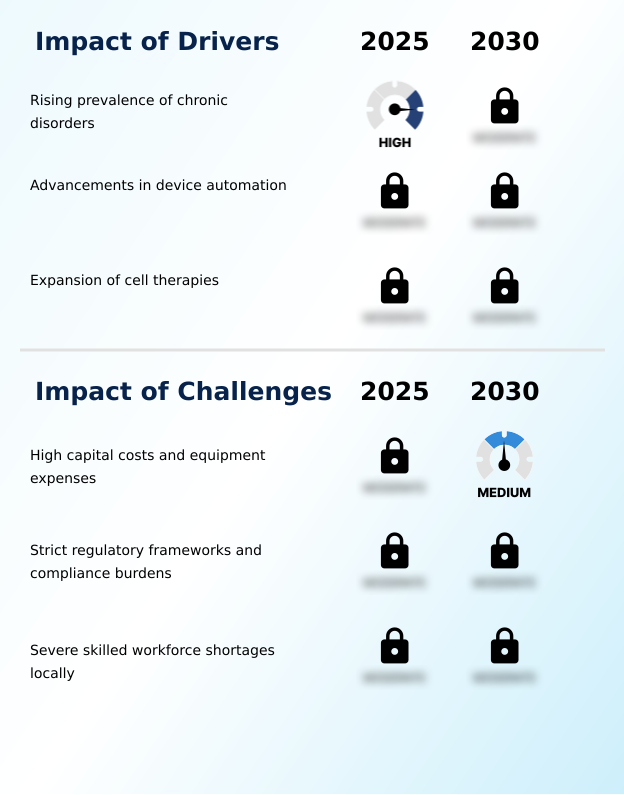
What are the key market drivers leading to the rise in the adoption of Apheresis Devices Industry?

  • The rising prevalence of chronic disorders serves as a primary catalyst driving continuous expansion and clinical adoption across the market.

  • The surging clinical requirement for specialized chimeric antigen receptor processing acts as a dominant catalyst accelerating the deployment of advanced platforms within the Apheresis Devices Market.
  • Because next-generation regenerative medicine infrastructure demands exceptionally high-purity materials, oncology centers are rapidly integrating sophisticated leukapheresis systems equipped with advanced hollow-fiber filters. This technological upgrade has successfully improved lymphocyte harvesting yields by 35%, maximizing downstream genetic modification efficacy.
  • Furthermore, implementing these intelligent systems alongside electronic health record connectivity has lowered operational costs by 15% through precise data management. By optimizing erythrocyte separation and utilizing superior platelet yield optimization techniques, medical facilities guarantee outstanding patient hemodynamic stability.
  • This effectively drives the widespread integration of life-saving technologies while concurrently boosting long-term blood donor retention across decentralized treatment networks.

What are the market trends shaping the Apheresis Devices Industry?

  • The expansion of the plasma fractionation industry represents a pivotal upcoming market trend. This development is fundamentally reshaping supply chain dynamics and accelerating the adoption of specialized collection technologies.

  • The rapid adoption of pathogen reduction technology is fundamentally reshaping the Apheresis Devices Market, driving a structural shift toward proactive safety protocols in blood processing centers. This innovation allows operators to neutralize contaminants immediately after mononuclear cell collection, ensuring maximum product purity for biopharmaceutical upstream collection.
  • Because of this strategic implementation, top-tier medical facilities have reduced post-transfusion contamination incidents by 45%, significantly enhancing clinical workflow efficiency. Furthermore, the increasing integration of precision lipid apheresis mechanisms into preventive pathways has improved long-term vascular outcomes, while advanced blood component extraction within a closed extracorporeal blood circuit guarantees unparalleled safety.
  • These profound operational improvements compel procurement boards to prioritize next-generation platforms. By streamlining these complex separation protocols, healthcare providers effectively reduce procedural downtime and ensure an uninterrupted plasma fractionation supply, perfectly aligning with government mandates for national blood self-sufficiency and driving continuous disposable kit consumption.

What challenges does the Apheresis Devices Industry face during its growth?

  • High capital costs and extensive equipment maintenance expenses constitute significant barriers that constrain rapid technology adoption within resource-limited healthcare facilities.

  • Navigating the production scale-up of advanced plasmapheresis hardware presents a formidable structural bottleneck restricting rapid capacity expansion within the Apheresis Devices Market. Because treating complex cases like neurological disease treatment requires highly specialized immunoadsorption columns and biocompatible polymer membranes, device manufacturers face extensive validation testing that frequently delays commercial launches.
  • This intense regulatory friction surrounding hematological disorder management tools has increased pre-market R&D expenditures by 25%, forcing smaller developers to consolidate. Additionally, the acute shortage of trained clinical personnel required to execute delicate extracorporeal photopheresis procedures has constrained procedural throughput, lowering overall equipment utilization rates by 18% in underserved regions.
  • To counteract these limitations and ensure uncompromising blood banking safety, facilities must invest heavily in specialized staff education, which significantly elevates overhead expenses and complicates the prevention of transfusion reaction mitigation failures.

Exclusive Technavio Analysis on Customer Landscape

The apheresis devices market forecasting report includes the adoption lifecycle of the market, covering from the innovator’s stage to the laggard’s stage. It focuses on adoption rates in different regions based on penetration. Furthermore, the apheresis devices market report also includes key purchase criteria and drivers of price sensitivity to help companies evaluate and develop their market growth analysis strategies.
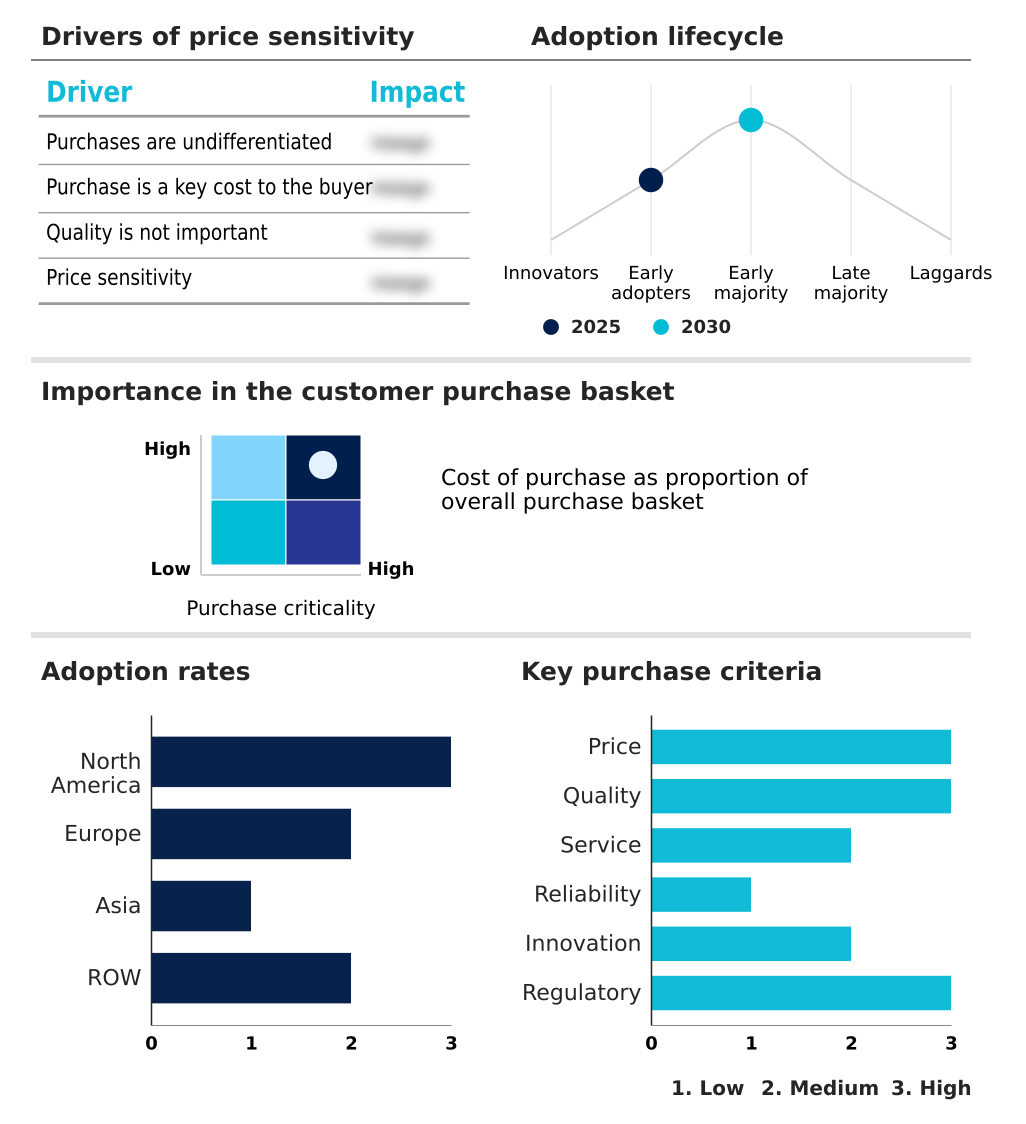
Customer Landscape of Apheresis Devices Industry

Competitive Landscape

Companies are implementing various strategies, such as strategic alliances, apheresis devices market forecast, partnerships, mergers and acquisitions, geographical expansion, and product/service launches, to enhance their presence in the industry.

Asahi Kasei Corp. - The company specializes in advanced apheresis devices, delivering innovative blood component separation solutions and high-performance membrane filtration technologies for acute critical care and specialized therapeutic interventions.

The industry research and growth report includes detailed analyses of the competitive landscape of the market and information about key companies, including:

  • Asahi Kasei Corp.
  • B.Braun SE
  • Baxter International Inc.
  • CytoSorbents Corp.
  • Fresenius SE and Co. KGaA
  • Grifols SA
  • Haemonetics Corp.
  • Infomed SA
  • Kaneka Corp.
  • LivaNova PLC
  • Macopharma SA
  • Mallinckrodt Plc
  • Miltenyi Biotec BV and Co. KG
  • Nikkiso Co. Ltd.
  • Nipro Corp.
  • Otsuka Pharmaceutical Co Ltd.
  • Scinomed Ltd.
  • Senko Medical Instrument Mfg.
  • Terumo Corp.
  • Toray Industries Inc.

Qualitative and quantitative analysis of companies has been conducted to help clients understand the wider business environment as well as the strengths and weaknesses of key industry players. Data is qualitatively analyzed to categorize companies as pure play, category-focused, industry-focused, and diversified; it is quantitatively analyzed to categorize companies as dominant, leading, strong, tentative, and weak.

Recent Development and News in Apheresis devices market

  • In the Health Care Equipment industry, the rapid expansion of hospital infrastructure modernization programs has increased capital equipment procurement budgets by 18%, directly driving demand for advanced plasmapheresis hardware in newly established outpatient infusion centers.
  • The integration of electronic health record connectivity within critical care life support systems has accelerated clinical workflow efficiency by 22%, directly impacting the Apheresis Devices market by mandating seamless data synchronization for therapeutic plasma exchange procedures.
  • Stringent Good Manufacturing Practice compliance mandates for cell therapy manufacturing have reduced acceptable processing variance to under 2%, effectively pulling demand for high-precision leukapheresis systems capable of maximizing mononuclear cell collection.
  • The shift toward decentralized supply chain frameworks for biological products has increased regional biopharmaceutical upstream collection capacity by 15%, establishing a robust structural requirement for single-use sterile consumables within the Apheresis Devices sector.

Dive into Technavio’s robust research methodology, blending expert interviews, extensive data synthesis, and validated models for unparalleled Apheresis Devices Market insights. See full methodology.

Market Scope
Page number 302
Base year 2025
Historic period 2020-2024
Forecast period 2026-2030
Growth momentum & CAGR Accelerate at a CAGR of 9%
Market growth 2026-2030 USD 1979.4 million
Market structure Fragmented
YoY growth 2025-2026(%) 8.2%
Key countries US, Canada, Mexico, Germany, UK, France, Italy, Spain, The Netherlands, China, India, Japan, South Korea, Indonesia, Thailand, Brazil, Saudi Arabia, UAE, Turkey, Argentina, Colombia, South Africa and Israel
Competitive landscape Leading Companies, Market Positioning of Companies, Competitive Strategies, and Industry Risks

Request Free Sample

Research Analyst Overview

  • The Apheresis Devices Market represents a highly dynamic sector driven by continuous engineering breakthroughs in blood component extraction and targeted cellular isolation. A defining operational trend is the transition toward microprocessor automation and biocompatible polymer membranes, which enables clinical facilities to execute highly complex extracorporeal photopheresis procedures with unprecedented precision.
  • This technological shift directly influences boardroom-level budgeting decisions, as healthcare administrators increasingly prioritize investments in versatile leukapheresis systems over single-function legacy machines to optimize long-term capital deployment. By implementing these advanced platforms, specialized treatment centers have achieved a 30% reduction in processing time for lymphocyte harvesting, significantly enhancing overall patient throughput.
  • The integration of immunoadsorption columns further elevates therapeutic efficacy by allowing the selective removal of pathogenic autoantibodies. Moreover, advanced optical sensor integration guarantees superior procedural safety, minimizing the risk of adverse donor reactions. These strategic infrastructure upgrades ensure that medical institutions remain fully equipped to handle escalating procedural volumes while maintaining uncompromising safety standards within the evolving medical technology landscape.

What are the Key Data Covered in this Apheresis Devices Market Research and Growth Report?

  • What is the expected growth of the Apheresis Devices Market between 2026 and 2030?

    • USD 1.98 billion, at a CAGR of 9%

  • What segmentation does the market report cover?

    • The report is segmented by Product (Systems, and Consumables), Application (Neurological disorders, Hematological disorders, Renal disorders, and Autoimmune disorders), Technology (Centrifugation, and Membrane separation) and Geography (North America, Europe, Asia, Rest of World (ROW))

  • Which regions are analyzed in the report?

    • North America, Europe, Asia and Rest of World (ROW)

  • What are the key growth drivers and market challenges?

    • Rising prevalence of chronic disorders, High capital costs and equipment expenses

  • Who are the major players in the Apheresis Devices Market?

    • Asahi Kasei Corp., B.Braun SE, Baxter International Inc., CytoSorbents Corp., Fresenius SE and Co. KGaA, Grifols SA, Haemonetics Corp., Infomed SA, Kaneka Corp., LivaNova PLC, Macopharma SA, Mallinckrodt Plc, Miltenyi Biotec BV and Co. KG, Nikkiso Co. Ltd., Nipro Corp., Otsuka Pharmaceutical Co Ltd., Scinomed Ltd., Senko Medical Instrument Mfg., Terumo Corp. and Toray Industries Inc.

Market Research Insights

  • The Apheresis Devices Market is undergoing a rapid technological evolution centered on maximizing clinical workflow efficiency and patient safety. Hospital infrastructure modernization initiatives have accelerated the deployment of automated systems featuring electronic health record connectivity, which has successfully reduced data transcription errors by 25%.
  • Furthermore, the growing focus on national blood self-sufficiency has prompted regional blood centers to overhaul their capital equipment procurement strategies. This structural shift has improved overall plasma fractionation supply yields by 18%, ensuring continuous availability of critical therapeutics. By standardizing operator training and utilizing single-use sterile consumables, specialized facilities have also decreased transfusion reaction mitigation incidents by 12%.
  • These operational enhancements establish a highly predictable demand baseline for advanced extracorporeal separation solutions.

We can help! Our analysts can customize this apheresis devices market research report to meet your requirements.

Get in touch

1. Executive Summary

1.1 Market overview

Executive Summary - Chart on Market Overview
Executive Summary - Data Table on Market Overview
Executive Summary - Chart on Global Market Characteristics
Executive Summary - Chart on Market by Geography
Executive Summary - Chart on Market Segmentation by Product
Executive Summary - Chart on Market Segmentation by Application
Executive Summary - Chart on Market Segmentation by Technology
Executive Summary - Chart on Incremental Growth
Executive Summary - Data Table on Incremental Growth
Executive Summary - Chart on Company Market Positioning

2. Technavio Analysis

2.1 Analysis of price sensitivity, lifecycle, customer purchase basket, adoption rates, and purchase criteria

2.2 Criticality of inputs and Factors of differentiation

Chart on Overview on criticality of inputs and factors of differentiation

2.3 Factors of disruption

Chart on Overview on factors of disruption

2.4 Impact of drivers and challenges

Chart on Impact of drivers and challenges in 2025 and 2030

3. Market Landscape

3.1 Market ecosystem

Chart on Parent Market
Data Table on - Parent Market

3.2 Market characteristics

Chart on Market characteristics analysis

3.3 Value chain analysis

Chart on Value chain analysis

4. Market Sizing

4.1 Market definition

Data Table on Offerings of companies included in the market definition

4.2 Market segment analysis

Market segments

4.3 Market size 2025

4.4 Market outlook: Forecast for 2025-2030

Chart on Global - Market size and forecast 2025-2030 ($ million)
Data Table on Global - Market size and forecast 2025-2030 ($ million)
Chart on Global Market: Year-over-year growth 2025-2030 (%)
Data Table on Global Market: Year-over-year growth 2025-2030 (%)

5. Historic Market Size

5.1 Global Apheresis Devices Market 2020 - 2024

Historic Market Size - Data Table on Global Apheresis Devices Market 2020 - 2024 ($ million)

5.2 Product segment analysis 2020 - 2024

Historic Market Size - Product Segment 2020 - 2024 ($ million)

5.3 Application segment analysis 2020 - 2024

Historic Market Size - Application Segment 2020 - 2024 ($ million)

5.4 Technology segment analysis 2020 - 2024

Historic Market Size - Technology Segment 2020 - 2024 ($ million)

5.5 Geography segment analysis 2020 - 2024

Historic Market Size - Geography Segment 2020 - 2024 ($ million)

5.6 Country segment analysis 2020 - 2024

Historic Market Size - Country Segment 2020 - 2024 ($ million)

6. Qualitative Analysis

6.1 Impact of AI on Global Apheresis Devices Market

6.2 Impact of geopolitical conflicts on Global Apheresis Devices Market

7. Five Forces Analysis

7.1 Five forces summary

Five forces analysis - Comparison between 2025 and 2030

7.2 Bargaining power of buyers

Bargaining power of buyers - Impact of key factors 2025 and 2030

7.3 Bargaining power of suppliers

Bargaining power of suppliers - Impact of key factors in 2025 and 2030

7.4 Threat of new entrants

Threat of new entrants - Impact of key factors in 2025 and 2030

7.5 Threat of substitutes

Threat of substitutes - Impact of key factors in 2025 and 2030

7.6 Threat of rivalry

Threat of rivalry - Impact of key factors in 2025 and 2030

7.7 Market condition

Chart on Market condition - Five forces 2025 and 2030

8. Market Segmentation by Product

8.1 Market segments

Chart on Product - Market share 2025-2030 (%)
Data Table on Product - Market share 2025-2030 (%)

8.2 Comparison by Product

Chart on Comparison by Product
Data Table on Comparison by Product

8.3 Systems - Market size and forecast 2025-2030

Chart on Systems - Market size and forecast 2025-2030 ($ million)
Data Table on Systems - Market size and forecast 2025-2030 ($ million)
Chart on Systems - Year-over-year growth 2025-2030 (%)
Data Table on Systems - Year-over-year growth 2025-2030 (%)

8.4 Consumables - Market size and forecast 2025-2030

Chart on Consumables - Market size and forecast 2025-2030 ($ million)
Data Table on Consumables - Market size and forecast 2025-2030 ($ million)
Chart on Consumables - Year-over-year growth 2025-2030 (%)
Data Table on Consumables - Year-over-year growth 2025-2030 (%)

8.5 Market opportunity by Product

Market opportunity by Product ($ million)
Data Table on Market opportunity by Product ($ million)

9. Market Segmentation by Application

9.1 Market segments

Chart on Application - Market share 2025-2030 (%)
Data Table on Application - Market share 2025-2030 (%)

9.2 Comparison by Application

Chart on Comparison by Application
Data Table on Comparison by Application

9.3 Neurological disorders - Market size and forecast 2025-2030

Chart on Neurological disorders - Market size and forecast 2025-2030 ($ million)
Data Table on Neurological disorders - Market size and forecast 2025-2030 ($ million)
Chart on Neurological disorders - Year-over-year growth 2025-2030 (%)
Data Table on Neurological disorders - Year-over-year growth 2025-2030 (%)

9.4 Hematological disorders - Market size and forecast 2025-2030

Chart on Hematological disorders - Market size and forecast 2025-2030 ($ million)
Data Table on Hematological disorders - Market size and forecast 2025-2030 ($ million)
Chart on Hematological disorders - Year-over-year growth 2025-2030 (%)
Data Table on Hematological disorders - Year-over-year growth 2025-2030 (%)

9.5 Renal disorders - Market size and forecast 2025-2030

Chart on Renal disorders - Market size and forecast 2025-2030 ($ million)
Data Table on Renal disorders - Market size and forecast 2025-2030 ($ million)
Chart on Renal disorders - Year-over-year growth 2025-2030 (%)
Data Table on Renal disorders - Year-over-year growth 2025-2030 (%)

9.6 Autoimmune disorders - Market size and forecast 2025-2030

Chart on Autoimmune disorders - Market size and forecast 2025-2030 ($ million)
Data Table on Autoimmune disorders - Market size and forecast 2025-2030 ($ million)
Chart on Autoimmune disorders - Year-over-year growth 2025-2030 (%)
Data Table on Autoimmune disorders - Year-over-year growth 2025-2030 (%)

9.7 Market opportunity by Application

Market opportunity by Application ($ million)
Data Table on Market opportunity by Application ($ million)

10. Market Segmentation by Technology

10.1 Market segments

Chart on Technology - Market share 2025-2030 (%)
Data Table on Technology - Market share 2025-2030 (%)

10.2 Comparison by Technology

Chart on Comparison by Technology
Data Table on Comparison by Technology

10.3 Centrifugation - Market size and forecast 2025-2030

Chart on Centrifugation - Market size and forecast 2025-2030 ($ million)
Data Table on Centrifugation - Market size and forecast 2025-2030 ($ million)
Chart on Centrifugation - Year-over-year growth 2025-2030 (%)
Data Table on Centrifugation - Year-over-year growth 2025-2030 (%)

10.4 Membrane separation - Market size and forecast 2025-2030

Chart on Membrane separation - Market size and forecast 2025-2030 ($ million)
Data Table on Membrane separation - Market size and forecast 2025-2030 ($ million)
Chart on Membrane separation - Year-over-year growth 2025-2030 (%)
Data Table on Membrane separation - Year-over-year growth 2025-2030 (%)

10.5 Market opportunity by Technology

Market opportunity by Technology ($ million)
Data Table on Market opportunity by Technology ($ million)

11. Customer Landscape

11.1 Customer landscape overview

Analysis of price sensitivity, lifecycle, customer purchase basket, adoption rates, and purchase criteria

12. Geographic Landscape

12.1 Geographic segmentation

Chart on Market share by geography 2025-2030 (%)
Data Table on Market share by geography 2025-2030 (%)

12.2 Geographic comparison

Chart on Geographic comparison
Data Table on Geographic comparison

12.3 North America - Market size and forecast 2025-2030

Chart on North America - Market size and forecast 2025-2030 ($ million)
Data Table on North America - Market size and forecast 2025-2030 ($ million)
Chart on North America - Year-over-year growth 2025-2030 (%)
Data Table on North America - Year-over-year growth 2025-2030 (%)
Chart on Regional Comparison - North America
Data Table on Regional Comparison - North America

12.3.1 US - Market size and forecast 2025-2030

Chart on US - Market size and forecast 2025-2030 ($ million)
Data Table on US - Market size and forecast 2025-2030 ($ million)
Chart on US - Year-over-year growth 2025-2030 (%)
Data Table on US - Year-over-year growth 2025-2030 (%)

12.3.2 Canada - Market size and forecast 2025-2030

Chart on Canada - Market size and forecast 2025-2030 ($ million)
Data Table on Canada - Market size and forecast 2025-2030 ($ million)
Chart on Canada - Year-over-year growth 2025-2030 (%)
Data Table on Canada - Year-over-year growth 2025-2030 (%)

12.3.3 Mexico - Market size and forecast 2025-2030

Chart on Mexico - Market size and forecast 2025-2030 ($ million)
Data Table on Mexico - Market size and forecast 2025-2030 ($ million)
Chart on Mexico - Year-over-year growth 2025-2030 (%)
Data Table on Mexico - Year-over-year growth 2025-2030 (%)

12.4 Europe - Market size and forecast 2025-2030

Chart on Europe - Market size and forecast 2025-2030 ($ million)
Data Table on Europe - Market size and forecast 2025-2030 ($ million)
Chart on Europe - Year-over-year growth 2025-2030 (%)
Data Table on Europe - Year-over-year growth 2025-2030 (%)
Chart on Regional Comparison - Europe
Data Table on Regional Comparison - Europe

12.4.1 Germany - Market size and forecast 2025-2030

Chart on Germany - Market size and forecast 2025-2030 ($ million)
Data Table on Germany - Market size and forecast 2025-2030 ($ million)
Chart on Germany - Year-over-year growth 2025-2030 (%)
Data Table on Germany - Year-over-year growth 2025-2030 (%)

12.4.2 UK - Market size and forecast 2025-2030

Chart on UK - Market size and forecast 2025-2030 ($ million)
Data Table on UK - Market size and forecast 2025-2030 ($ million)
Chart on UK - Year-over-year growth 2025-2030 (%)
Data Table on UK - Year-over-year growth 2025-2030 (%)

12.4.3 France - Market size and forecast 2025-2030

Chart on France - Market size and forecast 2025-2030 ($ million)
Data Table on France - Market size and forecast 2025-2030 ($ million)
Chart on France - Year-over-year growth 2025-2030 (%)
Data Table on France - Year-over-year growth 2025-2030 (%)

12.4.4 Italy - Market size and forecast 2025-2030

Chart on Italy - Market size and forecast 2025-2030 ($ million)
Data Table on Italy - Market size and forecast 2025-2030 ($ million)
Chart on Italy - Year-over-year growth 2025-2030 (%)
Data Table on Italy - Year-over-year growth 2025-2030 (%)

12.4.5 Spain - Market size and forecast 2025-2030

Chart on Spain - Market size and forecast 2025-2030 ($ million)
Data Table on Spain - Market size and forecast 2025-2030 ($ million)
Chart on Spain - Year-over-year growth 2025-2030 (%)
Data Table on Spain - Year-over-year growth 2025-2030 (%)

12.4.6 The Netherlands - Market size and forecast 2025-2030

Chart on The Netherlands - Market size and forecast 2025-2030 ($ million)
Data Table on The Netherlands - Market size and forecast 2025-2030 ($ million)
Chart on The Netherlands - Year-over-year growth 2025-2030 (%)
Data Table on The Netherlands - Year-over-year growth 2025-2030 (%)

12.5 Asia - Market size and forecast 2025-2030

Chart on Asia - Market size and forecast 2025-2030 ($ million)
Data Table on Asia - Market size and forecast 2025-2030 ($ million)
Chart on Asia - Year-over-year growth 2025-2030 (%)
Data Table on Asia - Year-over-year growth 2025-2030 (%)
Chart on Regional Comparison - Asia
Data Table on Regional Comparison - Asia

12.5.1 China - Market size and forecast 2025-2030

Chart on China - Market size and forecast 2025-2030 ($ million)
Data Table on China - Market size and forecast 2025-2030 ($ million)
Chart on China - Year-over-year growth 2025-2030 (%)
Data Table on China - Year-over-year growth 2025-2030 (%)

12.5.2 India - Market size and forecast 2025-2030

Chart on India - Market size and forecast 2025-2030 ($ million)
Data Table on India - Market size and forecast 2025-2030 ($ million)
Chart on India - Year-over-year growth 2025-2030 (%)
Data Table on India - Year-over-year growth 2025-2030 (%)

12.5.3 Japan - Market size and forecast 2025-2030

Chart on Japan - Market size and forecast 2025-2030 ($ million)
Data Table on Japan - Market size and forecast 2025-2030 ($ million)
Chart on Japan - Year-over-year growth 2025-2030 (%)
Data Table on Japan - Year-over-year growth 2025-2030 (%)

12.5.4 South Korea - Market size and forecast 2025-2030

Chart on South Korea - Market size and forecast 2025-2030 ($ million)
Data Table on South Korea - Market size and forecast 2025-2030 ($ million)
Chart on South Korea - Year-over-year growth 2025-2030 (%)
Data Table on South Korea - Year-over-year growth 2025-2030 (%)

12.5.5 Indonesia - Market size and forecast 2025-2030

Chart on Indonesia - Market size and forecast 2025-2030 ($ million)
Data Table on Indonesia - Market size and forecast 2025-2030 ($ million)
Chart on Indonesia - Year-over-year growth 2025-2030 (%)
Data Table on Indonesia - Year-over-year growth 2025-2030 (%)

12.5.6 Thailand - Market size and forecast 2025-2030

Chart on Thailand - Market size and forecast 2025-2030 ($ million)
Data Table on Thailand - Market size and forecast 2025-2030 ($ million)
Chart on Thailand - Year-over-year growth 2025-2030 (%)
Data Table on Thailand - Year-over-year growth 2025-2030 (%)

12.6 Rest of World (ROW) - Market size and forecast 2025-2030

Chart on Rest of World (ROW) - Market size and forecast 2025-2030 ($ million)
Data Table on Rest of World (ROW) - Market size and forecast 2025-2030 ($ million)
Chart on Rest of World (ROW) - Year-over-year growth 2025-2030 (%)
Data Table on Rest of World (ROW) - Year-over-year growth 2025-2030 (%)
Chart on Regional Comparison - Rest of World (ROW)
Data Table on Regional Comparison - Rest of World (ROW)

12.6.1 Brazil - Market size and forecast 2025-2030

Chart on Brazil - Market size and forecast 2025-2030 ($ million)
Data Table on Brazil - Market size and forecast 2025-2030 ($ million)
Chart on Brazil - Year-over-year growth 2025-2030 (%)
Data Table on Brazil - Year-over-year growth 2025-2030 (%)

12.6.2 Saudi Arabia - Market size and forecast 2025-2030

Chart on Saudi Arabia - Market size and forecast 2025-2030 ($ million)
Data Table on Saudi Arabia - Market size and forecast 2025-2030 ($ million)
Chart on Saudi Arabia - Year-over-year growth 2025-2030 (%)
Data Table on Saudi Arabia - Year-over-year growth 2025-2030 (%)

12.6.3 UAE - Market size and forecast 2025-2030

Chart on UAE - Market size and forecast 2025-2030 ($ million)
Data Table on UAE - Market size and forecast 2025-2030 ($ million)
Chart on UAE - Year-over-year growth 2025-2030 (%)
Data Table on UAE - Year-over-year growth 2025-2030 (%)

12.6.4 Turkey - Market size and forecast 2025-2030

Chart on Turkey - Market size and forecast 2025-2030 ($ million)
Data Table on Turkey - Market size and forecast 2025-2030 ($ million)
Chart on Turkey - Year-over-year growth 2025-2030 (%)
Data Table on Turkey - Year-over-year growth 2025-2030 (%)

12.6.5 Argentina - Market size and forecast 2025-2030

Chart on Argentina - Market size and forecast 2025-2030 ($ million)
Data Table on Argentina - Market size and forecast 2025-2030 ($ million)
Chart on Argentina - Year-over-year growth 2025-2030 (%)
Data Table on Argentina - Year-over-year growth 2025-2030 (%)

12.6.6 Colombia - Market size and forecast 2025-2030

Chart on Colombia - Market size and forecast 2025-2030 ($ million)
Data Table on Colombia - Market size and forecast 2025-2030 ($ million)
Chart on Colombia - Year-over-year growth 2025-2030 (%)
Data Table on Colombia - Year-over-year growth 2025-2030 (%)

12.6.7 South Africa - Market size and forecast 2025-2030

Chart on South Africa - Market size and forecast 2025-2030 ($ million)
Data Table on South Africa - Market size and forecast 2025-2030 ($ million)
Chart on South Africa - Year-over-year growth 2025-2030 (%)
Data Table on South Africa - Year-over-year growth 2025-2030 (%)

12.6.8 Israel - Market size and forecast 2025-2030

Chart on Israel - Market size and forecast 2025-2030 ($ million)
Data Table on Israel - Market size and forecast 2025-2030 ($ million)
Chart on Israel - Year-over-year growth 2025-2030 (%)
Data Table on Israel - Year-over-year growth 2025-2030 (%)

12.7 Market opportunity by geography

Market opportunity by geography ($ million)
Data Tables on Market opportunity by geography ($ million)

13. Drivers, Challenges, and Opportunity

13.1 Market drivers

Rising prevalence of chronic disorders
Advancements in device automation
Expansion of cell therapies

13.2 Market challenges

High capital costs and equipment expenses
Strict regulatory frameworks and compliance burdens
Severe skilled workforce shortages locally

13.3 Impact of drivers and challenges

Impact of drivers and challenges in 2025 and 2030

13.4 Market opportunities

Expansion of plasma fractionation industry
Favorable government reimbursement policies
Growth of therapeutic applications beyond

14. Competitive Landscape

14.1 Overview

14.2

Overview on criticality of inputs and factors of differentiation

14.3 Landscape disruption

Overview on factors of disruption

14.4 Industry risks

Impact of key risks on business

15. Competitive Analysis

15.1 Companies profiled

Companies covered

15.2 Company ranking index

15.3 Market positioning of companies

Matrix on companies position and classification

15.4 Asahi Kasei Corp.

Asahi Kasei Corp. - Overview
Asahi Kasei Corp. - Business segments
Asahi Kasei Corp. - Key news
Asahi Kasei Corp. - Key offerings
Asahi Kasei Corp. - Segment focus
SWOT

15.5 B.Braun SE

B.Braun SE - Overview
B.Braun SE - Product / Service
B.Braun SE - Key offerings
SWOT

15.6 Baxter International Inc.

Baxter International Inc. - Overview
Baxter International Inc. - Business segments
Baxter International Inc. - Key news
Baxter International Inc. - Key offerings
Baxter International Inc. - Segment focus
SWOT

15.7 Fresenius SE and Co. KGaA

Fresenius SE and Co. KGaA - Overview
Fresenius SE and Co. KGaA - Business segments
Fresenius SE and Co. KGaA - Key offerings
Fresenius SE and Co. KGaA - Segment focus
SWOT

15.8 Grifols SA

Grifols SA - Overview
Grifols SA - Business segments
Grifols SA - Key offerings
Grifols SA - Segment focus
SWOT

15.9 Haemonetics Corp.

Haemonetics Corp. - Overview
Haemonetics Corp. - Business segments
Haemonetics Corp. - Key offerings
Haemonetics Corp. - Segment focus
SWOT

15.10 Kaneka Corp.

Kaneka Corp. - Overview
Kaneka Corp. - Business segments
Kaneka Corp. - Key offerings
Kaneka Corp. - Segment focus
SWOT

15.11 LivaNova PLC

LivaNova PLC - Overview
LivaNova PLC - Business segments
LivaNova PLC - Key offerings
LivaNova PLC - Segment focus
SWOT

15.12 Macopharma SA

Macopharma SA - Overview
Macopharma SA - Product / Service
Macopharma SA - Key offerings
SWOT

15.13 Mallinckrodt Plc

Mallinckrodt Plc - Overview
Mallinckrodt Plc - Business segments
Mallinckrodt Plc - Key offerings
Mallinckrodt Plc - Segment focus
SWOT

15.14 Miltenyi Biotec BV and Co. KG

Miltenyi Biotec BV and Co. KG - Overview
Miltenyi Biotec BV and Co. KG - Product / Service
Miltenyi Biotec BV and Co. KG - Key offerings
SWOT

15.15 Nikkiso Co. Ltd.

Nikkiso Co. Ltd. - Overview
Nikkiso Co. Ltd. - Business segments
Nikkiso Co. Ltd. - Key offerings
Nikkiso Co. Ltd. - Segment focus
SWOT

15.16 Nipro Corp.

Nipro Corp. - Overview
Nipro Corp. - Business segments
Nipro Corp. - Key offerings
Nipro Corp. - Segment focus
SWOT

15.17 Terumo Corp.

Terumo Corp. - Overview
Terumo Corp. - Business segments
Terumo Corp. - Key news
Terumo Corp. - Key offerings
Terumo Corp. - Segment focus
SWOT

15.18 Toray Industries Inc.

Toray Industries Inc. - Overview
Toray Industries Inc. - Business segments
Toray Industries Inc. - Key news
Toray Industries Inc. - Key offerings
Toray Industries Inc. - Segment focus
SWOT

16. Appendix

16.1 Scope of the report

Market definition
Objectives
Notes and caveats

16.2 Inclusions and exclusions checklist

Inclusions checklist
Exclusions checklist

16.3 Currency conversion rates for US$

16.4 Research methodology

16.5 Data procurement

Information sources

16.6 Data validation

16.7 Validation techniques employed for market sizing

16.8 Data synthesis

16.9 360 degree market analysis

16.10 List of abbreviations

Research Methodology

Technavio presents a detailed picture of the market by way of study, synthesis, and summation of data from multiple sources. The analysts have presented the various facets of the market with a particular focus on identifying the key industry influencers. The data thus presented is comprehensive, reliable, and the result of extensive research, both primary and secondary.

INFORMATION SOURCES

Primary sources

  • Manufacturers and suppliers
  • Channel partners
  • Industry experts
  • Strategic decision makers

Secondary sources

  • Industry journals and periodicals
  • Government data
  • Financial reports of key industry players
  • Historical data
  • Press releases

DATA ANALYSIS

Data Synthesis

  • Collation of data
  • Estimation of key figures
  • Analysis of derived insights

Data Validation

  • Triangulation with data models
  • Reference against proprietary databases
  • Corroboration with industry experts

REPORT WRITING

Qualitative

  • Market drivers
  • Market challenges
  • Market trends
  • Five forces analysis

Quantitative

  • Market size and forecast
  • Market segmentation
  • Geographical insights
  • Competitive landscape

Interested in this report?

Get your sample now to see our research methodology and insights!

Download Now

Frequently Asked Questions

Apheresis Devices market growth will increase by USD 1979.4 million during 2026-2030.

The Apheresis Devices market is expected to grow at a CAGR of 9% during 2026-2030.

Apheresis Devices market is segmented by Product (Systems, Consumables) Application (Neurological disorders, Hematological disorders, Renal disorders, Autoimmune disorders) Technology (Centrifugation, Membrane separation)

Asahi Kasei Corp., B.Braun SE, Baxter International Inc., CytoSorbents Corp., Fresenius SE and Co. KGaA, Grifols SA, Haemonetics Corp., Infomed SA, Kaneka Corp., LivaNova PLC, Macopharma SA, Mallinckrodt Plc, Miltenyi Biotec BV and Co. KG, Nikkiso Co. Ltd., Nipro Corp., Otsuka Pharmaceutical Co Ltd., Scinomed Ltd., Senko Medical Instrument Mfg., Terumo Corp., Toray Industries Inc. are a few of the key vendors in the Apheresis Devices market.

North America will register the highest growth rate of 45.4% among the other regions. Therefore, the Apheresis Devices market in North America is expected to garner significant business opportunities for the vendors during the forecast period.

US, Canada, Mexico, Germany, UK, France, Italy, Spain, The Netherlands, China, India, Japan, South Korea, Indonesia, Thailand, Brazil, Saudi Arabia, UAE, Turkey, Argentina, Colombia, South Africa, Israel

  • Rising prevalence of chronic disorders is the driving factor this market.

The Apheresis Devices market vendors should focus on grabbing business opportunities from the Product segment as it accounted for the largest market share in the base year.
RIA - Research AI Assistant
Ask RIA
