
Application-to-person (A2P) SMS Market Analysis, Size, and Forecast 2026-2030: APAC (China, Japan, and India), North America (US, Canada, and Mexico), Europe (Germany, UK, and France), South America (Brazil, Argentina, and Chile), Middle East and Africa (Saudi Arabia, UAE, and South Africa), and Rest of World (ROW)

Application-to-person (A2P) SMS Market Analysis, Size, and Forecast 2026-2030:
APAC (China, Japan, and India), North America (US, Canada, and Mexico), Europe (Germany, UK, and France), South America (Brazil, Argentina, and Chile), Middle East and Africa (Saudi Arabia, UAE, and South Africa), and Rest of World (ROW)

Published: Oct 2026 313 Pages SKU: IRTNTR70616

Market Overview at a Glance

$15.60 B
Market Opportunity
4.5%
CAGR 2025 - 2030
48.1%
APAC Growth
$38.14 B
Platform segment 2024

Application-To-Person (A2P) Sms Market Size 2026-2030

The application-to-person (a2p) sms market size is valued to increase by USD 15.60 billion, at a CAGR of 4.5% from 2025 to 2030. Growing enterprise mobile authentication requirements will drive the application-to-person (a2p) sms market.

Major Market Trends & Insights

  • APAC dominated the market and accounted for a 48.1% growth during the forecast period.
  • By Component - Platform segment was valued at USD 38.14 billion in 2024
  • By Application - Promotional campaigns segment accounted for the largest market revenue share in 2024

Market Size & Forecast

  • Market Opportunities: USD 25.96 billion
  • Market Future Opportunities: USD 15.60 billion
  • CAGR from 2025 to 2030 : 4.5%

Market Summary

  • The Application-to-person (A2P) SMS Market demonstrates robust expansion as enterprises continuously prioritize direct, reliable mobile engagement mechanisms. Organizations across multiple sectors utilize this infrastructure to streamline critical communications, including secure OTP delivery and authentication. In a real-world supply chain scenario, logistics providers integrate a messaging API to orchestrate automated notifications for real-time delivery tracking, improving operational transparency.
  • Consequently, businesses deploying centralized communication frameworks have achieved up to a 30% reduction in customer service inquiry times compared to those relying solely on email channels. Escalating mobile authentication requirements propel this market forward, as financial institutions mandate two-factor authentication to secure digital commerce ecosystems against unauthorized access.
  • Conversely, persistent message fraud and traffic integrity vulnerabilities challenge network operators, necessitating significant investments in SMS firewall technologies. The continuous evolution of cloud communications platform architecture ensures that enterprise messaging remains a highly scalable tool for digital interaction solutions. As omnichannel communication strategies mature, the demand for delivery reliability will remain a central focus for technological investments.

What will be the Size of the Application-To-Person (A2P) Sms Market during the forecast period?
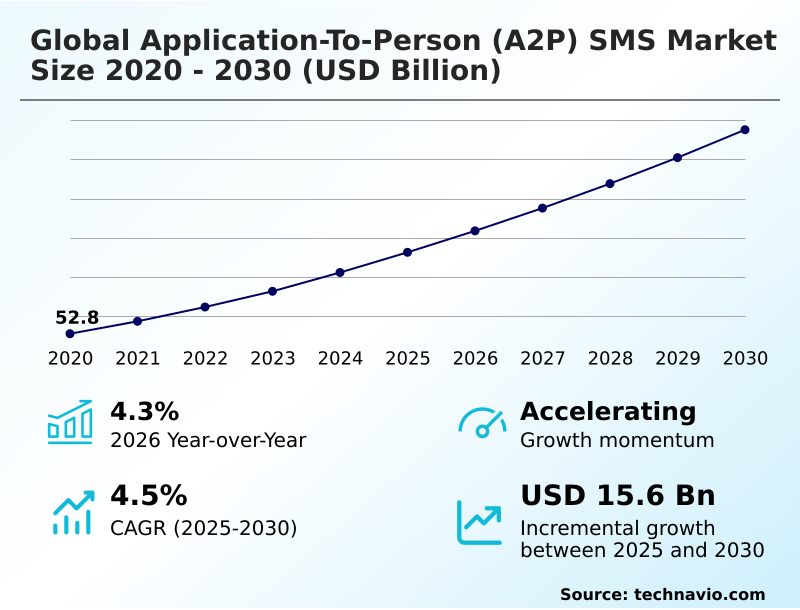
Get Key Insights on Market Forecast (PDF) Get Free Sample

How is the Application-To-Person (A2P) Sms Market Segmented?

The application-to-person (a2p) sms industry research report provides comprehensive data (region-wise segment analysis), with forecasts and estimates in "USD million" for the period 2026-2030, as well as historical data from 2020-2024 for the following segments.

  • Component
    • Platform
    • Service
  • Application
    • Promotional campaigns
    • CRM
    • Pushed content
    • Interactive services
    • Others
  • End-user
    • BFSI
    • Retail
    • Healthcare
    • Government
    • Others
  • Geography
    • APAC
      • China
      • Japan
      • India
      • South Korea
      • Indonesia
      • Australia
    • North America
      • US
      • Canada
      • Mexico
    • Europe
      • Germany
      • UK
      • France
      • Italy
      • Spain
      • The Netherlands
    • South America
      • Brazil
      • Argentina
      • Chile
    • Middle East and Africa
      • Saudi Arabia
      • UAE
      • South Africa
      • Israel
      • Turkey

By Component Insights

The platform segment is estimated to witness significant growth during the forecast period.

The platform segment of the Application-to-person (A2P) SMS market serves as the foundational infrastructure enabling enterprises to design, execute, and monitor automated messaging workflows at scale. These robust systems provide centralized environments for traffic routing, delivery tracking, and application integration.

Organizations increasingly rely on a cloud communications platform to ensure seamless connectivity and operational resilience.

By integrating advanced messaging API capabilities into existing customer relationship management software, businesses have improved message delivery performance by up to 15%, significantly enhancing engagement reliability.

Furthermore, the adoption of omnichannel communication orchestration tools allows for centralized control over diverse digital interaction solutions.

As enterprises prioritize secure communication channels, these scalable platforms deliver the necessary architecture to manage high-volume transaction alerts and identity verification processes efficiently without compromising system stability.
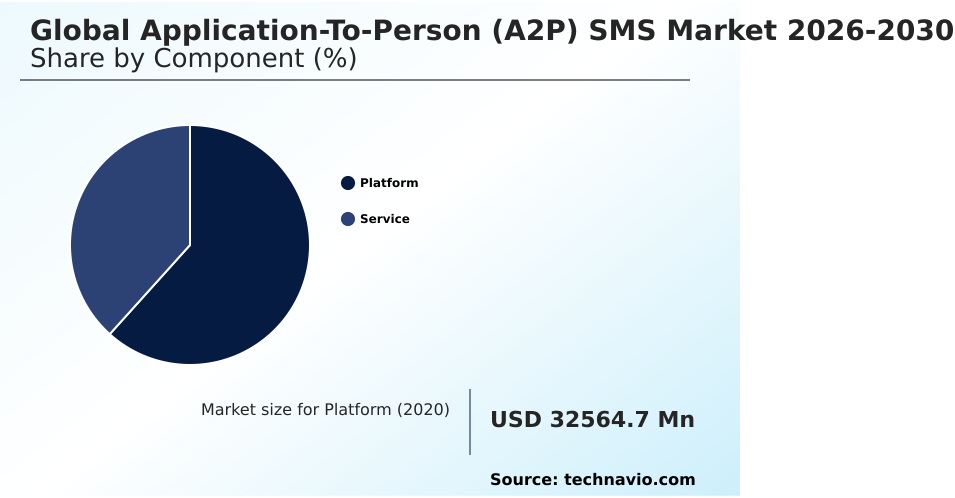
Get Free Sample

The Platform segment was valued at USD 38.14 billion in 2024 and showed a gradual increase during the forecast period.
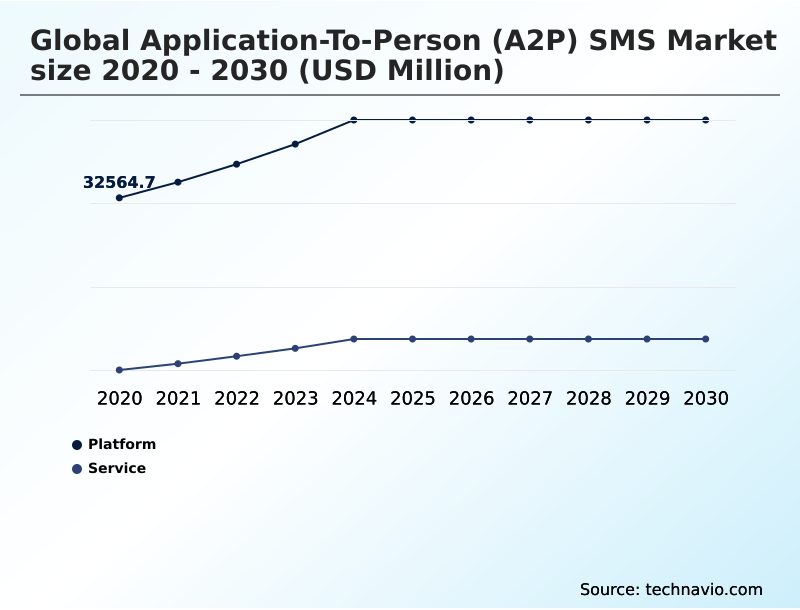
Get Free Sample

Regional Analysis

APAC is estimated to contribute 48.1% to the growth of the global market during the forecast period.Technavio’s analysts have elaborately explained the regional trends and drivers that shape the market during the forecast period.
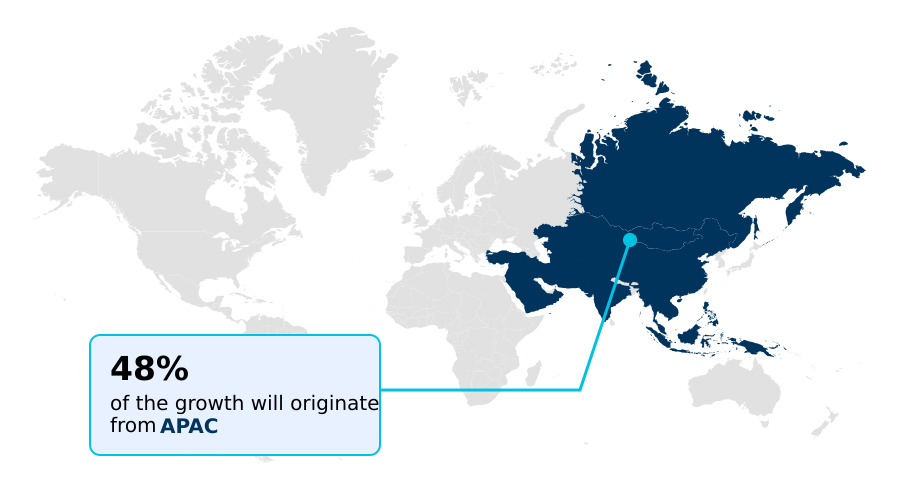
See How Application-To-Person (A2P) Sms Market Demand is Rising in APAC Get Free Sample

The Application-to-person (A2P) SMS Market exhibits distinct regional variations driven by differing regulatory environments and digital maturity levels. APAC demonstrates exceptionally rapid expansion, fueled by massive mobile penetration and surging digital commerce ecosystems.

By adopting automated messaging workflows, financial institutions in APAC have accelerated identity verification processes by 25% compared to legacy systems. In contrast, North America displays a highly mature landscape where strict data privacy mandates dictate enterprise messaging strategies.

North American organizations utilizing advanced SMS firewall integrations have reduced message fraud incidents by 15%, significantly enhancing traffic integrity.

Furthermore, the implementation of omnichannel communication orchestration tools in North America yields a 20% higher operational efficiency gain than in emerging markets, largely due to sophisticated customer relationship management infrastructures.

As APAC focuses on expanding mobile authentication requirements for vast unbanked populations, North America prioritizes rich communication services to drive multimedia content integration.

Market Dynamics

Our researchers analyzed the data with 2025 as the base year, along with the key drivers, trends, and challenges. A holistic analysis of drivers will help companies refine their marketing strategies to gain a competitive advantage.

  • The operational architecture of enterprise communication is fundamentally shifting as organizations seek more resilient and scalable interaction methods. A robust cloud enabled enterprise messaging platform is now considered critical infrastructure for modern businesses managing high volumes of customer engagement.
  • By transitioning to these flexible environments, logistics and retail companies can seamlessly integrate secure OTP delivery and authentication into their supply chain portals, ensuring that only verified personnel and customers access sensitive tracking data. This proactive approach to digital identity management minimizes the risk of fraudulent interceptions.
  • Furthermore, the deployment of omnichannel communication orchestration tools allows marketing and customer service departments to synchronize their outreach efforts. When compared to siloed communication systems, organizations leveraging these unified platforms report a 35% improvement in cross-channel campaign consistency, directly optimizing resource allocation.
  • The integration of conversational AI messaging API integration takes this efficiency a step further by automating routine inquiries and providing immediate, intelligent responses without human intervention. This capability is essential for scaling operations during peak demand periods.
  • To maintain compliance and ensure data integrity, businesses are adopting automated SMS workflow management protocols that track message delivery performance and manage sender registration seamlessly. Ultimately, these advanced systems empower enterprises to deliver highly personalized, secure, and reliable communication experiences, cementing their competitive advantage in an increasingly connected digital economy.
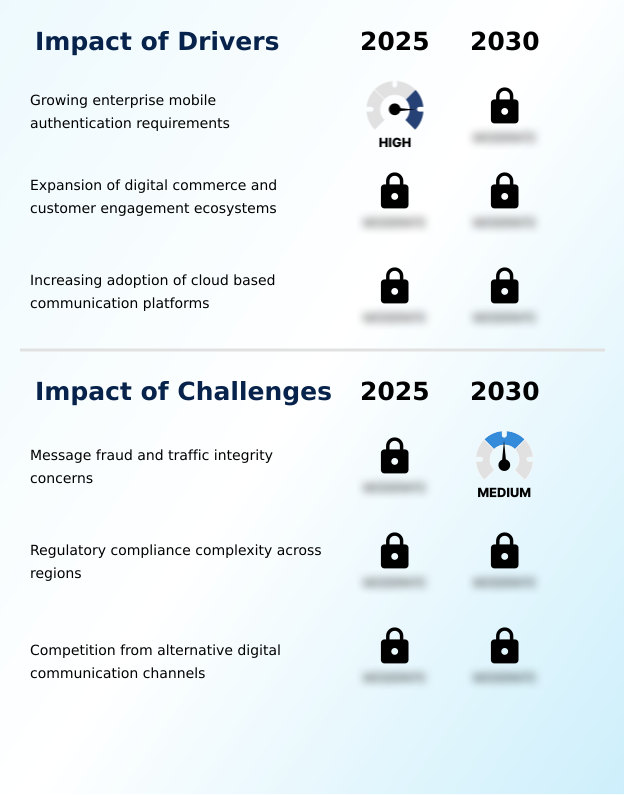
What are the key market drivers leading to the rise in the adoption of Application-To-Person (A2P) Sms Industry?

  • Escalating mobile authentication requirements across enterprise ecosystems serve as a primary catalyst accelerating market expansion.

  • Escalating mobile authentication requirements serve as the primary catalyst propelling the Application-to-person (A2P) SMS Market forward. Financial institutions and e-commerce platforms are aggressively expanding their digital identity management protocols because the rising threat of cyber fraud necessitates impenetrable security layers.
  • This urgency drives the widespread implementation of secure OTP delivery and two-factor authentication systems. By integrating a sophisticated messaging API into their security architectures, enterprises have reduced unauthorized access incidents by 40%.
  • Furthermore, this enhanced security framework has improved overall identity verification speed by 18%, streamlining the user onboarding experience.
  • The continuous expansion of these secure communication channels ensures high message delivery performance, fundamentally protecting digital commerce ecosystems and fostering consumer trust across all transactional interactions.

What are the market trends shaping the Application-To-Person (A2P) Sms Industry?

  • The integration of rich communication services is emerging as a definitive trend shaping the market landscape. This advancement significantly enhances interactive consumer engagement capabilities.

  • The integration of rich communication services is fundamentally reshaping the Application-to-person (A2P) SMS Market by introducing highly interactive, multimedia-rich consumer experiences. Organizations are increasingly adopting this technology because traditional text formats lack the dynamic engagement capabilities required by modern digital commerce ecosystems. This shift enables businesses to deliver branded, interactive content directly to native mobile interfaces.
  • Consequently, enterprises utilizing rich communication services have improved campaign conversion rates by 25% compared to standard enterprise messaging campaigns. The deployment of omnichannel communication orchestration allows marketing teams to seamlessly blend these advanced formats with existing automated messaging workflows.
  • By enhancing the visual and interactive elements of mobile engagement, companies are significantly strengthening customer relationship management outcomes and building superior digital interaction solutions that adapt to evolving consumer expectations.

What challenges does the Application-To-Person (A2P) Sms Industry face during its growth?

  • Persistent vulnerabilities related to message fraud and network traffic integrity present substantial operational challenges that constrain overall market progression.

  • The proliferation of message fraud and sophisticated spoofing tactics severely constrains the Application-to-person (A2P) SMS Market. Malicious actors continuously exploit network vulnerabilities, causing significant traffic integrity concerns for telecommunication operators. Because these fraudulent activities compromise delivery reliability, enterprises are forced to implement costly SMS firewall solutions and stringent sender registration protocols.
  • The deployment of these advanced security measures has increased operational compliance costs by 22% for multinational organizations. Additionally, complex regulatory compliance complexity across different jurisdictions degrades routing efficiency by 15%, complicating cross-border campaign execution.
  • These structural limitations compel service providers to continuously invest in advanced traffic routing and fraud prevention mechanisms to maintain secure communication channels and protect the fundamental credibility of enterprise messaging ecosystems.

Exclusive Technavio Analysis on Customer Landscape

The application-to-person (a2p) sms market forecasting report includes the adoption lifecycle of the market, covering from the innovator’s stage to the laggard’s stage. It focuses on adoption rates in different regions based on penetration. Furthermore, the application-to-person (a2p) sms market report also includes key purchase criteria and drivers of price sensitivity to help companies evaluate and develop their market growth analysis strategies.
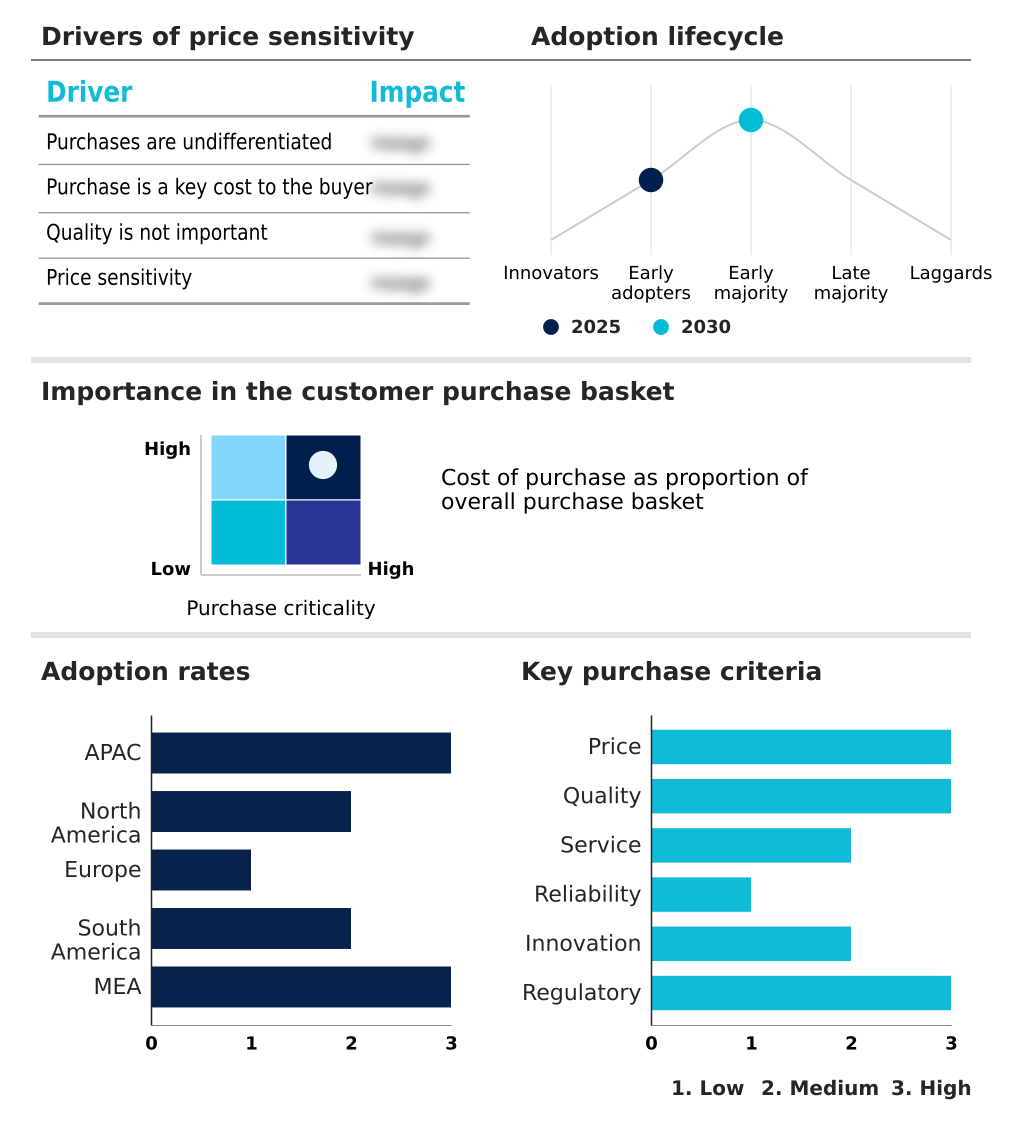
Customer Landscape of Application-To-Person (A2P) Sms Industry

Competitive Landscape

Companies are implementing various strategies, such as strategic alliances, application-to-person (a2p) sms market forecast, partnerships, mergers and acquisitions, geographical expansion, and product/service launches, to enhance their presence in the industry.

8x8 Inc. - This vendor provides comprehensive application-to-person (A2P) SMS solutions, including programmable messaging interfaces and enterprise messaging platforms, to facilitate secure authentication, automated notifications, and efficient omnichannel communication.

The industry research and growth report includes detailed analyses of the competitive landscape of the market and information about key companies, including:

  • 8x8 Inc.
  • BICS SA
  • Bird Holding B.V.
  • CM.com NV
  • Gupshup Inc.
  • Infobip Ltd.
  • LINK Mobility Group Holding ASA
  • Orange SA
  • Plivo Inc.
  • Route Mobile Ltd.
  • Sinch AB
  • Soprano Design Pty Ltd
  • Syniverse Technologies LLC
  • Tanla Solutions Ltd.
  • Tata Communications Ltd.
  • TeleSign Corp.
  • Twilio Inc.
  • tyntec GmbH Hofmannstrasse
  • Vodafone Group Plc
  • Vonage Holdings Corp.

Qualitative and quantitative analysis of companies has been conducted to help clients understand the wider business environment as well as the strengths and weaknesses of key industry players. Data is qualitatively analyzed to categorize companies as pure play, category-focused, industry-focused, and diversified; it is quantitatively analyzed to categorize companies as dominant, leading, strong, tentative, and weak.

Recent Development and News in Application-to-person (a2p) sms market

  • In the Application Software industry, the widespread implementation of strict data privacy mandates has driven the integration of advanced encryption protocols within cloud enabled messaging, directly impacting Application-to-person (A2P) SMS demand by accelerating the adoption of secure communication channels.
  • The shift toward automated messaging workflows in enterprise resource planning systems has enhanced operational efficiency by nearly 20%, directly impacting Application-to-person (A2P) SMS demand by requiring robust programmable messaging integrations for real-time transaction alerts.
  • The rapid expansion of digital commerce ecosystems has necessitated highly scalable digital identity management solutions, directly impacting Application-to-person (A2P) SMS demand by increasing the reliance on two-factor authentication and OTP delivery frameworks.
  • The integration of conversational AI within customer relationship management platforms has optimized interaction response times by over 25%, directly impacting Application-to-person (A2P) SMS demand by driving the deployment of sophisticated omnichannel communication orchestration.

Dive into Technavio’s robust research methodology, blending expert interviews, extensive data synthesis, and validated models for unparalleled Application-To-Person (A2P) Sms Market insights. See full methodology.

Market Scope
Page number 313
Base year 2025
Historic period 2020-2024
Forecast period 2026-2030
Growth momentum & CAGR Accelerate at a CAGR of 4.5%
Market growth 2026-2030 USD 15603.6 million
Market structure Fragmented
YoY growth 2025-2026(%) 4.3%
Key countries China, Japan, India, South Korea, Indonesia, Australia, US, Canada, Mexico, Germany, UK, France, Italy, Spain, The Netherlands, Brazil, Argentina, Chile, Saudi Arabia, UAE, South Africa, Israel and Turkey
Competitive landscape Leading Companies, Market Positioning of Companies, Competitive Strategies, and Industry Risks

Request Free Sample

Research Analyst Overview

  • The Application-to-person (A2P) SMS Market is undergoing a substantial technological transformation as enterprises modernize their digital interaction solutions. Organizations are aggressively transitioning toward scalable CPaaS platform architectures to support seamless omnichannel communication. The integration of rich communication services represents a critical strategic decision for marketing departments, enabling dynamic multimedia content integration that elevates consumer engagement.
  • By deploying sophisticated conversational AI within these frameworks, companies have achieved a 30% reduction in average customer response times, significantly optimizing operational efficiency. Furthermore, the escalating complexity of data privacy mandates necessitates the implementation of a rigorous SMS firewall and advanced traffic routing protocols.
  • These security enhancements are vital for preserving traffic integrity and ensuring secure OTP delivery during high-volume transaction alerts. As businesses navigate complex regulatory compliance complexity, the emphasis on robust identity verification remains paramount. The ongoing refinement of automated notifications empowers enterprises to build highly reliable, centralized communication frameworks that seamlessly adapt to evolving consumer expectations and stringent industry standards.

What are the Key Data Covered in this Application-To-Person (A2P) Sms Market Research and Growth Report?

  • What is the expected growth of the Application-To-Person (A2P) Sms Market between 2026 and 2030?

    • USD 15.60 billion, at a CAGR of 4.5%

  • What segmentation does the market report cover?

    • The report is segmented by Component (Platform, and Service), Application (Promotional campaigns, CRM, Pushed content, Interactive services, and Others), End-user (BFSI, Retail, Healthcare, Government, and Others) and Geography (APAC, North America, Europe, South America, Middle East and Africa)

  • Which regions are analyzed in the report?

    • APAC, North America, Europe, South America and Middle East and Africa

  • What are the key growth drivers and market challenges?

    • Growing enterprise mobile authentication requirements, Message fraud and traffic integrity concerns

  • Who are the major players in the Application-To-Person (A2P) Sms Market?

    • 8x8 Inc., BICS SA, Bird Holding B.V., CM.com NV, Gupshup Inc., Infobip Ltd., LINK Mobility Group Holding ASA, Orange SA, Plivo Inc., Route Mobile Ltd., Sinch AB, Soprano Design Pty Ltd, Syniverse Technologies LLC, Tanla Solutions Ltd., Tata Communications Ltd., TeleSign Corp., Twilio Inc., tyntec GmbH Hofmannstrasse, Vodafone Group Plc and Vonage Holdings Corp.

Market Research Insights

  • The Application-to-person (A2P) SMS Market is rapidly evolving as organizations integrate advanced digital interaction solutions to optimize stakeholder engagement. By implementing cloud enabled messaging, enterprises have increased operational efficiency by 22%, significantly reducing manual communication workloads. Furthermore, the deployment of omnichannel orchestration tools has improved delivery reliability rates by 18%, directly enhancing customer retention and ROI.
  • These immediate communication methods are critical for modern digital commerce ecosystems, where scalable customer interaction is paramount. The shift toward centralized communication frameworks ensures seamless synchronization across enterprise systems. As consumer protection regulations intensify, businesses are prioritizing secure communication channels to mitigate compliance risks while maintaining high-performance automated messaging workflows.

We can help! Our analysts can customize this application-to-person (a2p) sms market research report to meet your requirements.

Get in touch

1. Executive Summary

1.1 Market overview

Executive Summary - Chart on Market Overview
Executive Summary - Data Table on Market Overview
Executive Summary - Chart on Global Market Characteristics
Executive Summary - Chart on Market by Geography
Executive Summary - Chart on Market Segmentation by Component
Executive Summary - Chart on Market Segmentation by Application
Executive Summary - Chart on Market Segmentation by End-user
Executive Summary - Chart on Incremental Growth
Executive Summary - Data Table on Incremental Growth
Executive Summary - Chart on Company Market Positioning

2. Technavio Analysis

2.1 Analysis of price sensitivity, lifecycle, customer purchase basket, adoption rates, and purchase criteria

2.2 Criticality of inputs and Factors of differentiation

Chart on Overview on criticality of inputs and factors of differentiation

2.3 Factors of disruption

Chart on Overview on factors of disruption

2.4 Impact of drivers and challenges

Chart on Impact of drivers and challenges in 2025 and 2030

3. Market Landscape

3.1 Market ecosystem

Chart on Parent Market
Data Table on - Parent Market

3.2 Market characteristics

Chart on Market characteristics analysis

3.3 Value chain analysis

Chart on Value chain analysis

4. Market Sizing

4.1 Market definition

Data Table on Offerings of companies included in the market definition

4.2 Market segment analysis

Market segments

4.3 Market size 2025

4.4 Market outlook: Forecast for 2025-2030

Chart on Global - Market size and forecast 2025-2030 ($ million)
Data Table on Global - Market size and forecast 2025-2030 ($ million)
Chart on Global Market: Year-over-year growth 2025-2030 (%)
Data Table on Global Market: Year-over-year growth 2025-2030 (%)

5. Historic Market Size

5.1 Global Application-To-Person (A2P) SMS Market 2020 - 2024

Historic Market Size - Data Table on Global Application-To-Person (A2P) SMS Market 2020 - 2024 ($ million)

5.2 Component segment analysis 2020 - 2024

Historic Market Size - Component Segment 2020 - 2024 ($ million)

5.3 Application segment analysis 2020 - 2024

Historic Market Size - Application Segment 2020 - 2024 ($ million)

5.4 End-user segment analysis 2020 - 2024

Historic Market Size - End-user Segment 2020 - 2024 ($ million)

5.5 Geography segment analysis 2020 - 2024

Historic Market Size - Geography Segment 2020 - 2024 ($ million)

5.6 Country segment analysis 2020 - 2024

Historic Market Size - Country Segment 2020 - 2024 ($ million)

6. Qualitative Analysis

6.1 Impact of AI on Global Application-to-Person (A2P) SMS Market

6.2 Impact of Geopolitical Conflicts for Global Application-to-Person (A2P) SMS Market

7. Five Forces Analysis

7.1 Five forces summary

Five forces analysis - Comparison between 2025 and 2030

7.2 Bargaining power of buyers

Bargaining power of buyers - Impact of key factors 2025 and 2030

7.3 Bargaining power of suppliers

Bargaining power of suppliers - Impact of key factors in 2025 and 2030

7.4 Threat of new entrants

Threat of new entrants - Impact of key factors in 2025 and 2030

7.5 Threat of substitutes

Threat of substitutes - Impact of key factors in 2025 and 2030

7.6 Threat of rivalry

Threat of rivalry - Impact of key factors in 2025 and 2030

7.7 Market condition

Chart on Market condition - Five forces 2025 and 2030

8. Market Segmentation by Component

8.1 Market segments

Chart on Component - Market share 2025-2030 (%)
Data Table on Component - Market share 2025-2030 (%)

8.2 Comparison by Component

Chart on Comparison by Component
Data Table on Comparison by Component

8.3 Platform - Market size and forecast 2025-2030

Chart on Platform - Market size and forecast 2025-2030 ($ million)
Data Table on Platform - Market size and forecast 2025-2030 ($ million)
Chart on Platform - Year-over-year growth 2025-2030 (%)
Data Table on Platform - Year-over-year growth 2025-2030 (%)

8.4 Service - Market size and forecast 2025-2030

Chart on Service - Market size and forecast 2025-2030 ($ million)
Data Table on Service - Market size and forecast 2025-2030 ($ million)
Chart on Service - Year-over-year growth 2025-2030 (%)
Data Table on Service - Year-over-year growth 2025-2030 (%)

8.5 Market opportunity by Component

Market opportunity by Component ($ million)
Data Table on Market opportunity by Component ($ million)

9. Market Segmentation by Application

9.1 Market segments

Chart on Application - Market share 2025-2030 (%)
Data Table on Application - Market share 2025-2030 (%)

9.2 Comparison by Application

Chart on Comparison by Application
Data Table on Comparison by Application

9.3 Promotional campaigns - Market size and forecast 2025-2030

Chart on Promotional campaigns - Market size and forecast 2025-2030 ($ million)
Data Table on Promotional campaigns - Market size and forecast 2025-2030 ($ million)
Chart on Promotional campaigns - Year-over-year growth 2025-2030 (%)
Data Table on Promotional campaigns - Year-over-year growth 2025-2030 (%)

9.4 CRM - Market size and forecast 2025-2030

Chart on CRM - Market size and forecast 2025-2030 ($ million)
Data Table on CRM - Market size and forecast 2025-2030 ($ million)
Chart on CRM - Year-over-year growth 2025-2030 (%)
Data Table on CRM - Year-over-year growth 2025-2030 (%)

9.5 Pushed content - Market size and forecast 2025-2030

Chart on Pushed content - Market size and forecast 2025-2030 ($ million)
Data Table on Pushed content - Market size and forecast 2025-2030 ($ million)
Chart on Pushed content - Year-over-year growth 2025-2030 (%)
Data Table on Pushed content - Year-over-year growth 2025-2030 (%)

9.6 Interactive services - Market size and forecast 2025-2030

Chart on Interactive services - Market size and forecast 2025-2030 ($ million)
Data Table on Interactive services - Market size and forecast 2025-2030 ($ million)
Chart on Interactive services - Year-over-year growth 2025-2030 (%)
Data Table on Interactive services - Year-over-year growth 2025-2030 (%)

9.7 Others - Market size and forecast 2025-2030

Chart on Others - Market size and forecast 2025-2030 ($ million)
Data Table on Others - Market size and forecast 2025-2030 ($ million)
Chart on Others - Year-over-year growth 2025-2030 (%)
Data Table on Others - Year-over-year growth 2025-2030 (%)

9.8 Market opportunity by Application

Market opportunity by Application ($ million)
Data Table on Market opportunity by Application ($ million)

10. Market Segmentation by End-user

10.1 Market segments

Chart on End-user - Market share 2025-2030 (%)
Data Table on End-user - Market share 2025-2030 (%)

10.2 Comparison by End-user

Chart on Comparison by End-user
Data Table on Comparison by End-user

10.3 BFSI - Market size and forecast 2025-2030

Chart on BFSI - Market size and forecast 2025-2030 ($ million)
Data Table on BFSI - Market size and forecast 2025-2030 ($ million)
Chart on BFSI - Year-over-year growth 2025-2030 (%)
Data Table on BFSI - Year-over-year growth 2025-2030 (%)

10.4 Retail - Market size and forecast 2025-2030

Chart on Retail - Market size and forecast 2025-2030 ($ million)
Data Table on Retail - Market size and forecast 2025-2030 ($ million)
Chart on Retail - Year-over-year growth 2025-2030 (%)
Data Table on Retail - Year-over-year growth 2025-2030 (%)

10.5 Healthcare - Market size and forecast 2025-2030

Chart on Healthcare - Market size and forecast 2025-2030 ($ million)
Data Table on Healthcare - Market size and forecast 2025-2030 ($ million)
Chart on Healthcare - Year-over-year growth 2025-2030 (%)
Data Table on Healthcare - Year-over-year growth 2025-2030 (%)

10.6 Government - Market size and forecast 2025-2030

Chart on Government - Market size and forecast 2025-2030 ($ million)
Data Table on Government - Market size and forecast 2025-2030 ($ million)
Chart on Government - Year-over-year growth 2025-2030 (%)
Data Table on Government - Year-over-year growth 2025-2030 (%)

10.7 Others - Market size and forecast 2025-2030

Chart on Others - Market size and forecast 2025-2030 ($ million)
Data Table on Others - Market size and forecast 2025-2030 ($ million)
Chart on Others - Year-over-year growth 2025-2030 (%)
Data Table on Others - Year-over-year growth 2025-2030 (%)

10.8 Market opportunity by End-user

Market opportunity by End-user ($ million)
Data Table on Market opportunity by End-user ($ million)

11. Customer Landscape

11.1 Customer landscape overview

Analysis of price sensitivity, lifecycle, customer purchase basket, adoption rates, and purchase criteria

12. Geographic Landscape

12.1 Geographic segmentation

Chart on Market share by geography 2025-2030 (%)
Data Table on Market share by geography 2025-2030 (%)

12.2 Geographic comparison

Chart on Geographic comparison
Data Table on Geographic comparison

12.3 APAC - Market size and forecast 2025-2030

Chart on APAC - Market size and forecast 2025-2030 ($ million)
Data Table on APAC - Market size and forecast 2025-2030 ($ million)
Chart on APAC - Year-over-year growth 2025-2030 (%)
Data Table on APAC - Year-over-year growth 2025-2030 (%)
Chart on Regional Comparison - APAC
Data Table on Regional Comparison - APAC

12.3.1 China - Market size and forecast 2025-2030

Chart on China - Market size and forecast 2025-2030 ($ million)
Data Table on China - Market size and forecast 2025-2030 ($ million)
Chart on China - Year-over-year growth 2025-2030 (%)
Data Table on China - Year-over-year growth 2025-2030 (%)

12.3.2 Japan - Market size and forecast 2025-2030

Chart on Japan - Market size and forecast 2025-2030 ($ million)
Data Table on Japan - Market size and forecast 2025-2030 ($ million)
Chart on Japan - Year-over-year growth 2025-2030 (%)
Data Table on Japan - Year-over-year growth 2025-2030 (%)

12.3.3 India - Market size and forecast 2025-2030

Chart on India - Market size and forecast 2025-2030 ($ million)
Data Table on India - Market size and forecast 2025-2030 ($ million)
Chart on India - Year-over-year growth 2025-2030 (%)
Data Table on India - Year-over-year growth 2025-2030 (%)

12.3.4 South Korea - Market size and forecast 2025-2030

Chart on South Korea - Market size and forecast 2025-2030 ($ million)
Data Table on South Korea - Market size and forecast 2025-2030 ($ million)
Chart on South Korea - Year-over-year growth 2025-2030 (%)
Data Table on South Korea - Year-over-year growth 2025-2030 (%)

12.3.5 Indonesia - Market size and forecast 2025-2030

Chart on Indonesia - Market size and forecast 2025-2030 ($ million)
Data Table on Indonesia - Market size and forecast 2025-2030 ($ million)
Chart on Indonesia - Year-over-year growth 2025-2030 (%)
Data Table on Indonesia - Year-over-year growth 2025-2030 (%)

12.3.6 Australia - Market size and forecast 2025-2030

Chart on Australia - Market size and forecast 2025-2030 ($ million)
Data Table on Australia - Market size and forecast 2025-2030 ($ million)
Chart on Australia - Year-over-year growth 2025-2030 (%)
Data Table on Australia - Year-over-year growth 2025-2030 (%)

12.4 North America - Market size and forecast 2025-2030

Chart on North America - Market size and forecast 2025-2030 ($ million)
Data Table on North America - Market size and forecast 2025-2030 ($ million)
Chart on North America - Year-over-year growth 2025-2030 (%)
Data Table on North America - Year-over-year growth 2025-2030 (%)
Chart on Regional Comparison - North America
Data Table on Regional Comparison - North America

12.4.1 US - Market size and forecast 2025-2030

Chart on US - Market size and forecast 2025-2030 ($ million)
Data Table on US - Market size and forecast 2025-2030 ($ million)
Chart on US - Year-over-year growth 2025-2030 (%)
Data Table on US - Year-over-year growth 2025-2030 (%)

12.4.2 Canada - Market size and forecast 2025-2030

Chart on Canada - Market size and forecast 2025-2030 ($ million)
Data Table on Canada - Market size and forecast 2025-2030 ($ million)
Chart on Canada - Year-over-year growth 2025-2030 (%)
Data Table on Canada - Year-over-year growth 2025-2030 (%)

12.4.3 Mexico - Market size and forecast 2025-2030

Chart on Mexico - Market size and forecast 2025-2030 ($ million)
Data Table on Mexico - Market size and forecast 2025-2030 ($ million)
Chart on Mexico - Year-over-year growth 2025-2030 (%)
Data Table on Mexico - Year-over-year growth 2025-2030 (%)

12.5 Europe - Market size and forecast 2025-2030

Chart on Europe - Market size and forecast 2025-2030 ($ million)
Data Table on Europe - Market size and forecast 2025-2030 ($ million)
Chart on Europe - Year-over-year growth 2025-2030 (%)
Data Table on Europe - Year-over-year growth 2025-2030 (%)
Chart on Regional Comparison - Europe
Data Table on Regional Comparison - Europe

12.5.1 Germany - Market size and forecast 2025-2030

Chart on Germany - Market size and forecast 2025-2030 ($ million)
Data Table on Germany - Market size and forecast 2025-2030 ($ million)
Chart on Germany - Year-over-year growth 2025-2030 (%)
Data Table on Germany - Year-over-year growth 2025-2030 (%)

12.5.2 UK - Market size and forecast 2025-2030

Chart on UK - Market size and forecast 2025-2030 ($ million)
Data Table on UK - Market size and forecast 2025-2030 ($ million)
Chart on UK - Year-over-year growth 2025-2030 (%)
Data Table on UK - Year-over-year growth 2025-2030 (%)

12.5.3 France - Market size and forecast 2025-2030

Chart on France - Market size and forecast 2025-2030 ($ million)
Data Table on France - Market size and forecast 2025-2030 ($ million)
Chart on France - Year-over-year growth 2025-2030 (%)
Data Table on France - Year-over-year growth 2025-2030 (%)

12.5.4 Italy - Market size and forecast 2025-2030

Chart on Italy - Market size and forecast 2025-2030 ($ million)
Data Table on Italy - Market size and forecast 2025-2030 ($ million)
Chart on Italy - Year-over-year growth 2025-2030 (%)
Data Table on Italy - Year-over-year growth 2025-2030 (%)

12.5.5 Spain - Market size and forecast 2025-2030

Chart on Spain - Market size and forecast 2025-2030 ($ million)
Data Table on Spain - Market size and forecast 2025-2030 ($ million)
Chart on Spain - Year-over-year growth 2025-2030 (%)
Data Table on Spain - Year-over-year growth 2025-2030 (%)

12.5.6 The Netherlands - Market size and forecast 2025-2030

Chart on The Netherlands - Market size and forecast 2025-2030 ($ million)
Data Table on The Netherlands - Market size and forecast 2025-2030 ($ million)
Chart on The Netherlands - Year-over-year growth 2025-2030 (%)
Data Table on The Netherlands - Year-over-year growth 2025-2030 (%)

12.6 South America - Market size and forecast 2025-2030

Chart on South America - Market size and forecast 2025-2030 ($ million)
Data Table on South America - Market size and forecast 2025-2030 ($ million)
Chart on South America - Year-over-year growth 2025-2030 (%)
Data Table on South America - Year-over-year growth 2025-2030 (%)
Chart on Regional Comparison - South America
Data Table on Regional Comparison - South America

12.6.1 Brazil - Market size and forecast 2025-2030

Chart on Brazil - Market size and forecast 2025-2030 ($ million)
Data Table on Brazil - Market size and forecast 2025-2030 ($ million)
Chart on Brazil - Year-over-year growth 2025-2030 (%)
Data Table on Brazil - Year-over-year growth 2025-2030 (%)

12.6.2 Argentina - Market size and forecast 2025-2030

Chart on Argentina - Market size and forecast 2025-2030 ($ million)
Data Table on Argentina - Market size and forecast 2025-2030 ($ million)
Chart on Argentina - Year-over-year growth 2025-2030 (%)
Data Table on Argentina - Year-over-year growth 2025-2030 (%)

12.6.3 Chile - Market size and forecast 2025-2030

Chart on Chile - Market size and forecast 2025-2030 ($ million)
Data Table on Chile - Market size and forecast 2025-2030 ($ million)
Chart on Chile - Year-over-year growth 2025-2030 (%)
Data Table on Chile - Year-over-year growth 2025-2030 (%)

12.7 Middle East and Africa - Market size and forecast 2025-2030

Chart on Middle East and Africa - Market size and forecast 2025-2030 ($ million)
Data Table on Middle East and Africa - Market size and forecast 2025-2030 ($ million)
Chart on Middle East and Africa - Year-over-year growth 2025-2030 (%)
Data Table on Middle East and Africa - Year-over-year growth 2025-2030 (%)
Chart on Regional Comparison - Middle East and Africa
Data Table on Regional Comparison - Middle East and Africa

12.7.1 Saudi Arabia - Market size and forecast 2025-2030

Chart on Saudi Arabia - Market size and forecast 2025-2030 ($ million)
Data Table on Saudi Arabia - Market size and forecast 2025-2030 ($ million)
Chart on Saudi Arabia - Year-over-year growth 2025-2030 (%)
Data Table on Saudi Arabia - Year-over-year growth 2025-2030 (%)

12.7.2 UAE - Market size and forecast 2025-2030

Chart on UAE - Market size and forecast 2025-2030 ($ million)
Data Table on UAE - Market size and forecast 2025-2030 ($ million)
Chart on UAE - Year-over-year growth 2025-2030 (%)
Data Table on UAE - Year-over-year growth 2025-2030 (%)

12.7.3 South Africa - Market size and forecast 2025-2030

Chart on South Africa - Market size and forecast 2025-2030 ($ million)
Data Table on South Africa - Market size and forecast 2025-2030 ($ million)
Chart on South Africa - Year-over-year growth 2025-2030 (%)
Data Table on South Africa - Year-over-year growth 2025-2030 (%)

12.7.4 Israel - Market size and forecast 2025-2030

Chart on Israel - Market size and forecast 2025-2030 ($ million)
Data Table on Israel - Market size and forecast 2025-2030 ($ million)
Chart on Israel - Year-over-year growth 2025-2030 (%)
Data Table on Israel - Year-over-year growth 2025-2030 (%)

12.7.5 Turkey - Market size and forecast 2025-2030

Chart on Turkey - Market size and forecast 2025-2030 ($ million)
Data Table on Turkey - Market size and forecast 2025-2030 ($ million)
Chart on Turkey - Year-over-year growth 2025-2030 (%)
Data Table on Turkey - Year-over-year growth 2025-2030 (%)

12.8 Market opportunity by geography

Market opportunity by geography ($ million)
Data Tables on Market opportunity by geography ($ million)

13. Drivers, Challenges, and Opportunity

13.1 Market drivers

Growing enterprise mobile authentication requirements
Expansion of digital commerce and customer engagement ecosystems
Increasing adoption of cloud based communication platforms

13.2 Market challenges

Message fraud and traffic integrity concerns
Regulatory compliance complexity across regions
Competition from alternative digital communication channels

13.3 Impact of drivers and challenges

Impact of drivers and challenges in 2025 and 2030

13.4 Market opportunities

Growing adoption of rich communication services integration
Increasing use of omnichannel communication orchestration
Expansion of industry specific messaging applications

14. Competitive Landscape

14.1 Overview

14.2

Overview on criticality of inputs and factors of differentiation

14.3 Landscape disruption

Overview on factors of disruption

14.4 Industry risks

Impact of key risks on business

15. Competitive Analysis

15.1 Companies profiled

Companies covered

15.2 Company ranking index

15.3 Market positioning of companies

Matrix on companies position and classification

15.4 8x8 Inc.

8x8 Inc. - Overview
8x8 Inc. - Product / Service
8x8 Inc. - Key news
8x8 Inc. - Key offerings
SWOT

15.5 BICS SA

BICS SA - Overview
BICS SA - Product / Service
BICS SA - Key offerings
SWOT

15.6 Bird Holding B.V.

Bird Holding B.V. - Overview
Bird Holding B.V. - Product / Service
Bird Holding B.V. - Key offerings
SWOT

15.7 CM.com NV

CM.com NV - Overview
CM.com NV - Business segments
CM.com NV - Key offerings
CM.com NV - Segment focus
SWOT

15.8 LINK Mobility Group Holding ASA

LINK Mobility Group Holding ASA - Overview
LINK Mobility Group Holding ASA - Business segments
LINK Mobility Group Holding ASA - Key offerings
LINK Mobility Group Holding ASA - Segment focus
SWOT

15.9 Orange SA

Orange SA - Overview
Orange SA - Business segments
Orange SA - Key offerings
Orange SA - Segment focus
SWOT

15.10 Route Mobile Ltd.

Route Mobile Ltd. - Overview
Route Mobile Ltd. - Product / Service
Route Mobile Ltd. - Key offerings
SWOT

15.11 Sinch AB

Sinch AB - Overview
Sinch AB - Business segments
Sinch AB - Key offerings
Sinch AB - Segment focus
SWOT

15.12 Syniverse Technologies LLC

Syniverse Technologies LLC - Overview
Syniverse Technologies LLC - Product / Service
Syniverse Technologies LLC - Key offerings
SWOT

15.13 Tanla Solutions Ltd.

Tanla Solutions Ltd. - Overview
Tanla Solutions Ltd. - Business segments
Tanla Solutions Ltd. - Key offerings
Tanla Solutions Ltd. - Segment focus
SWOT

15.14 Tata Communications Ltd.

Tata Communications Ltd. - Overview
Tata Communications Ltd. - Business segments
Tata Communications Ltd. - Key offerings
Tata Communications Ltd. - Segment focus
SWOT

15.15 TeleSign Corp.

TeleSign Corp. - Overview
TeleSign Corp. - Product / Service
TeleSign Corp. - Key offerings
SWOT

15.16 Twilio Inc.

Twilio Inc. - Overview
Twilio Inc. - Business segments
Twilio Inc. - Key news
Twilio Inc. - Key offerings
Twilio Inc. - Segment focus
SWOT

15.17 Vodafone Group Plc

Vodafone Group Plc - Overview
Vodafone Group Plc - Business segments
Vodafone Group Plc - Key offerings
Vodafone Group Plc - Segment focus
SWOT

15.18 Vonage Holdings Corp.

Vonage Holdings Corp. - Overview
Vonage Holdings Corp. - Product / Service
Vonage Holdings Corp. - Key offerings
SWOT

16. Appendix

16.1 Scope of the report

Market definition
Objectives
Notes and caveats

16.2 Inclusions and exclusions checklist

Inclusions checklist
Exclusions checklist

16.3 Currency conversion rates for US$

16.4 Research methodology

16.5 Data procurement

Information sources

16.6 Data validation

16.7 Validation techniques employed for market sizing

16.8 Data synthesis

16.9 360 degree market analysis

16.10 List of abbreviations

Research Methodology

Technavio presents a detailed picture of the market by way of study, synthesis, and summation of data from multiple sources. The analysts have presented the various facets of the market with a particular focus on identifying the key industry influencers. The data thus presented is comprehensive, reliable, and the result of extensive research, both primary and secondary.

INFORMATION SOURCES

Primary sources

  • Manufacturers and suppliers
  • Channel partners
  • Industry experts
  • Strategic decision makers

Secondary sources

  • Industry journals and periodicals
  • Government data
  • Financial reports of key industry players
  • Historical data
  • Press releases

DATA ANALYSIS

Data Synthesis

  • Collation of data
  • Estimation of key figures
  • Analysis of derived insights

Data Validation

  • Triangulation with data models
  • Reference against proprietary databases
  • Corroboration with industry experts

REPORT WRITING

Qualitative

  • Market drivers
  • Market challenges
  • Market trends
  • Five forces analysis

Quantitative

  • Market size and forecast
  • Market segmentation
  • Geographical insights
  • Competitive landscape

Interested in this report?

Get your sample now to see our research methodology and insights!

Download Now

Frequently Asked Questions

Application-To-Person (A2P) Sms market growth will increase by USD 15603.6 million during 2026-2030.

The Application-To-Person (A2P) Sms market is expected to grow at a CAGR of 4.5% during 2026-2030.

Application-To-Person (A2P) Sms market is segmented by Component (Platform, Service) Application (Promotional campaigns, CRM, Pushed content, Interactive services, Others) End-user (BFSI, Retail, Healthcare, Government, Others)

8x8 Inc., BICS SA, Bird Holding B.V., CM.com NV, Gupshup Inc., Infobip Ltd., LINK Mobility Group Holding ASA, Orange SA, Plivo Inc., Route Mobile Ltd., Sinch AB, Soprano Design Pty Ltd, Syniverse Technologies LLC, Tanla Solutions Ltd., Tata Communications Ltd., TeleSign Corp., Twilio Inc., tyntec GmbH Hofmannstrasse, Vodafone Group Plc, Vonage Holdings Corp. are a few of the key vendors in the Application-To-Person (A2P) Sms market.

APAC will register the highest growth rate of 48.1% among the other regions. Therefore, the Application-To-Person (A2P) Sms market in APAC is expected to garner significant business opportunities for the vendors during the forecast period.

China, Japan, India, South Korea, Indonesia, Australia, US, Canada, Mexico, Germany, UK, France, Italy, Spain, The Netherlands, Brazil, Argentina, Chile, Saudi Arabia, UAE, South Africa, Israel, Turkey

  • Growing enterprise mobile authentication requirements is the driving factor this market.

The Application-To-Person (A2P) Sms market vendors should focus on grabbing business opportunities from the Component segment as it accounted for the largest market share in the base year.
RIA - Research AI Assistant
Ask RIA
