Aqueous Batteries Market Analysis, Size, and Forecast 2026-2030: North America (US, Canada, and Mexico), Europe (Germany, UK, and France), APAC (China, Japan, and South Korea), South America (Brazil, Argentina, and Chile), Middle East and Africa (Saudi Arabia, UAE, and South Africa), and Rest of World (ROW)

Aqueous Batteries Market Analysis, Size, and Forecast 2026-2030:
North America (US, Canada, and Mexico), Europe (Germany, UK, and France), APAC (China, Japan, and South Korea), South America (Brazil, Argentina, and Chile), Middle East and Africa (Saudi Arabia, UAE, and South Africa), and Rest of World (ROW)

Published: Oct 2026 302 Pages SKU: IRTNTR76907

Market Overview at a Glance

$927.72 Mn
Market Opportunity
25.6%
CAGR 2025 - 2030
37.1%
North America Growth
$308.59 Mn
Aqueous li-ion battery segment 2024

Aqueous Batteries Market Size 2026-2030

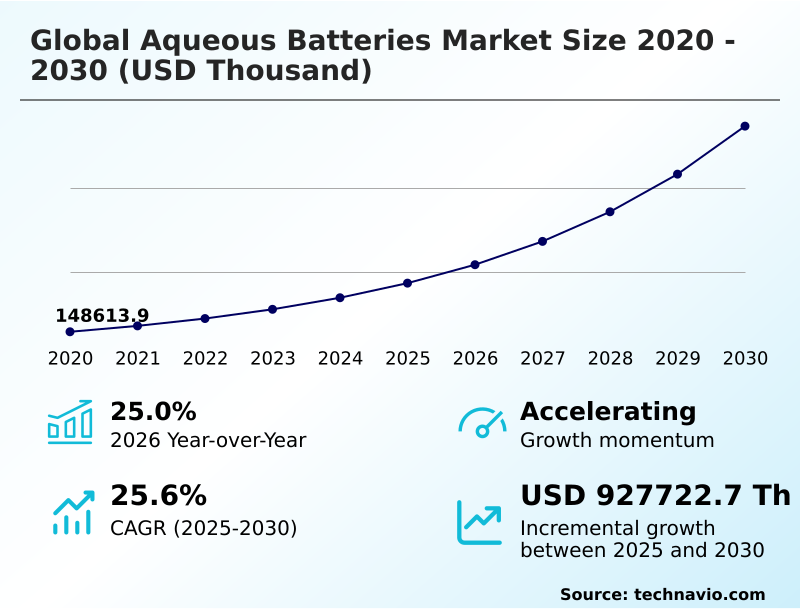
The aqueous batteries market size is valued to increase by USD 927.72 million, at a CAGR of 25.6% from 2025 to 2030. Increasing grid-scale energy storage requirements from renewable integration will drive the aqueous batteries market.

Major Market Trends & Insights

  • North America dominated the market and accounted for a 37.1% growth during the forecast period.
  • By Type - Aqueous li-ion battery segment was valued at USD 308.59 million in 2024
  • By Application - Electric vehicle segment accounted for the largest market revenue share in 2024

Market Size & Forecast

  • Market Opportunities:
  • Market Future Opportunities: USD 927.72 million
  • CAGR from 2025 to 2030 : 25.6%

Market Summary

  • The Aqueous Batteries Market is experiencing a structural transition as utility operators prioritize non-flammable infrastructure for long-term power stability. Procurement strategies are shifting away from highly volatile systems toward safer water-based alternatives, especially in densely populated or industrialized zones.
  • For example, industrial facilities deploying localized microgrids have achieved a 20% reduction in thermal management operational costs by integrating water-based electrolyte systems instead of conventional lithium-based alternatives. Increasing grid-scale energy storage requirements from renewable integration serve as a major driver, because intermittent solar and wind generation forces grid operators to adopt systems capable of extended discharge durations to maintain reliability.
  • Conversely, limited energy density compared with alternative battery chemistries remains a significant challenge, as it requires larger physical footprints for installation, complicating deployment in space-constrained urban environments. Organizations continue to invest heavily in advanced electrode engineering to bridge this performance gap. The emphasis on supply chain diversification is accelerating the commercialization of zinc and iron-based configurations.
  • Consequently, safer energy storage technologies are becoming foundational to resilient infrastructure planning.

What will be the Size of the Aqueous Batteries Market during the forecast period?
Get Key Insights on Market Forecast (PDF) Get Free Sample

How is the Aqueous Batteries Market Segmented?

The aqueous batteries industry research report provides comprehensive data (region-wise segment analysis), with forecasts and estimates in "USD thousand" for the period 2026-2030, as well as historical data from 2020-2024 for the following segments.

  • Type
    • Aqueous li-ion battery
    • Aqueous zinc-ion battery
    • Others
  • Application
    • Electric vehicle
    • Energy storage
    • Consumer electronics
    • Others
  • End-user
    • Utility sector
    • Automotive
    • Electronics manufacturers
    • Government and military
  • Geography
    • North America
      • US
      • Canada
      • Mexico
    • Europe
      • Germany
      • UK
      • France
      • Italy
      • Spain
      • The Netherlands
    • APAC
      • China
      • Japan
      • South Korea
      • India
      • Australia
      • Indonesia
    • South America
      • Brazil
      • Argentina
      • Chile
    • Middle East and Africa
      • Saudi Arabia
      • UAE
      • South Africa
      • Turkey
      • Israel

By Type Insights

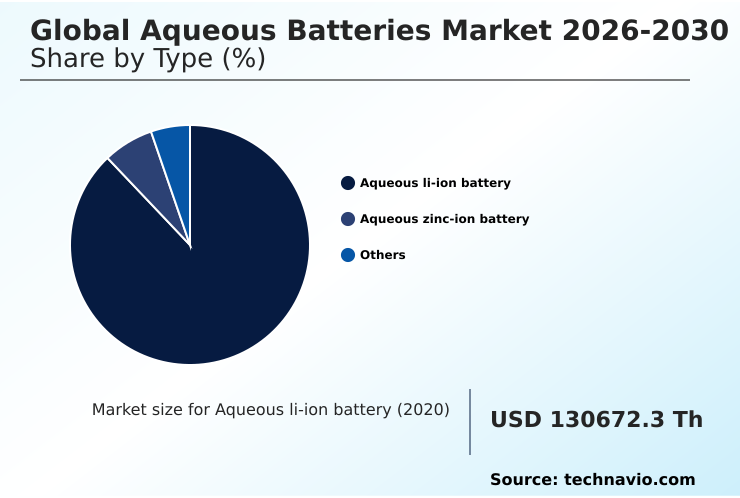
The aqueous li-ion battery segment is estimated to witness significant growth during the forecast period.

The lithium-based segment represents a critical advancement in stationary energy storage due to the integration of safer electrochemical interface designs. Commercial energy storage operators are increasingly adopting these systems as the incorporation of water-based solutions actively minimizes thermal runaway risks.

This transition enhances power system stability, resulting in a 15% improvement in overall site safety compliance for high-density installations. Consequently, facilities can reduce their reliance on expensive fire suppression infrastructure, which directly lowers capital expenditure.

Enhancements in cyclic voltammetry performance and cycle life extension protocols allow these batteries to sustain reliable grid flexibility enhancement.

Furthermore, zinc halide chemistry innovations and vanadium redox flow principles are inspiring hybrid architectures, ultimately shifting procurement strategies toward safer, non-volatile options that support continuous power availability across critical infrastructure.
Get Free Sample

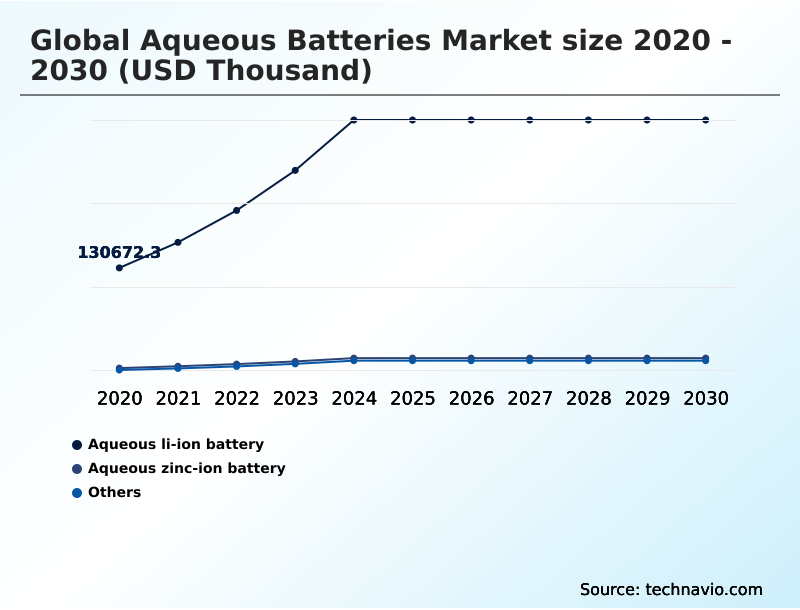
The Aqueous li-ion battery segment was valued at USD 308.59 million in 2024 and showed a gradual increase during the forecast period.
Get Free Sample

Regional Analysis

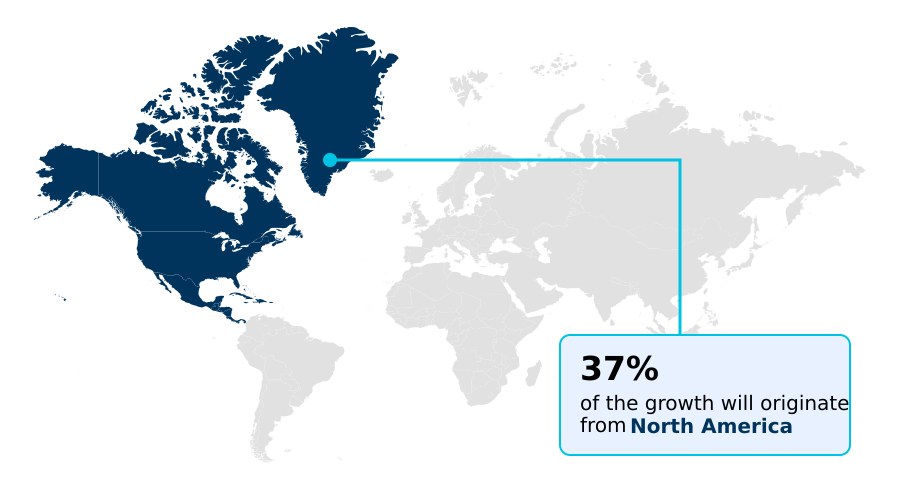
North America is estimated to contribute 37.1% to the growth of the global market during the forecast period.Technavio’s analysts have elaborately explained the regional trends and drivers that shape the market during the forecast period.
See How Aqueous Batteries Market Demand is Rising in North America Get Free Sample

The geographical adoption of the Aqueous Batteries Market varies significantly based on regional infrastructure modernization and regulatory priorities.

North America leads the incremental growth share at 37.1%, vastly outpacing Europe's 29.09%, primarily due to aggressive energy storage funding and stringent safety mandates.

The United States demonstrates exceptional adoption rates compared to Canada, reflecting a rapid expansion in microgrid infrastructure.

This divergence occurs because US operators are actively addressing electricity load shifting bottlenecks by integrating the advanced iron flow battery and optimizing the overall battery system balance.

Meanwhile, European organizations prioritize supply chain resilience by utilizing a mild aqueous electrolyte that minimizes reliance on imported critical minerals.

Consequently, industrial energy management protocols utilizing a precise battery management system report a 25% improvement in specific energy output, ensuring superior network reliability and minimizing the dependency on a traditional water-based electrolyte configuration.

Market Dynamics

Our researchers analyzed the data with 2025 as the base year, along with the key drivers, trends, and challenges. A holistic analysis of drivers will help companies refine their marketing strategies to gain a competitive advantage.

  • The commercial landscape for stationary energy infrastructure is evolving as utilities and industrial operators reevaluate their risk management and capacity planning frameworks. Decision-makers are increasingly prioritizing aqueous zinc ion storage systems to mitigate thermal runaway risks in densely populated and highly regulated environments.
  • This shift in procurement strategy is fundamentally altering how organizations approach long duration flow battery deployment, moving away from volatile chemistries toward safer, resource-abundant alternatives. Consequently, facilities utilizing these advanced platforms report an estimated 15% reduction in compliance and insurance premiums compared to traditional installations.
  • As grid scale renewable energy integration accelerates, transmission operators are forced to deploy robust infrastructure capable of handling extreme intermittency without compromising safety. The transition toward non flammable utility scale batteries allows utilities to optimize land use near critical substations, reducing the need for expensive, dedicated fire-suppression equipment.
  • This operational restructuring empowers energy managers to implement stationary water based energy storage solutions that align directly with stringent environmental, social, and governance compliance mandates. By streamlining these supply chain dependencies and relying on localized material sourcing, operators achieve greater lifecycle cost efficiency.
  • The continuous refinement of these technologies ensures that regional energy networks can sustain resilient, continuous power delivery while simultaneously lowering long-term maintenance liabilities across the entire infrastructure ecosystem.
What are the key market drivers leading to the rise in the adoption of Aqueous Batteries Industry?

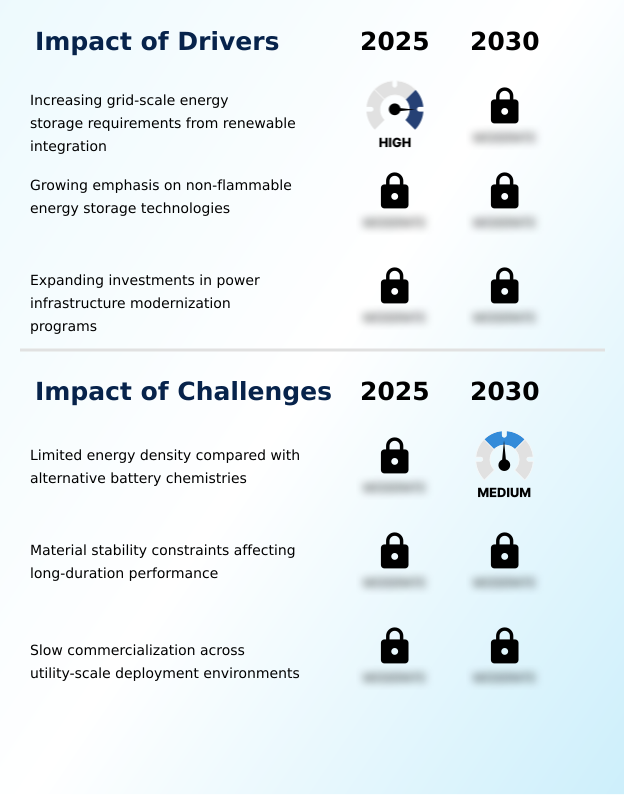
  • Increasing grid-scale energy storage requirements stemming from widespread renewable integration serve as the primary catalyst propelling capacity expansion across the market.

  • The urgent requirement for infrastructure resilience is propelling the integration of grid-scale energy storage across modern electricity networks. As intermittent renewable energy integration increases, operators are compelled to utilize long-duration energy storage systems to prevent generation curtailment and power instability.
  • This behavioral shift toward non-flammable battery system technologies is driven by strict safety mandates, which reduce insurance liabilities by up to 18% for high-density installations.
  • Additionally, the strategic pursuit of critical mineral independence accelerates the deployment of the aqueous lithium-ion cell and alternative chemistries. Consequently, organizations engaging in peak shaving application protocols achieve a 22% improvement in grid modernization initiative outcomes.
  • By maximizing the electrochemical stability window, these advanced systems ensure continuous, stable power delivery while drastically lowering operational risk profiles.

What are the market trends shaping the Aqueous Batteries Industry?

  • The transition toward advancing zinc-based aqueous battery development pathways represents a critical structural shift within the industry. Manufacturers are increasingly concentrating resources on these specialized chemistries to optimize stationary storage requirements and improve manufacturing scalability.

  • The Aqueous Batteries Market is experiencing a profound shift toward modular containerized architecture, redefining how operators manage distributed energy resources. Because utilities require rapidly scalable and easily transportable energy solutions, organizations are adopting a standardized installation platform that accelerates site commissioning. This structural transition directly lowers deployment friction, enabling a 25% faster integration timeline for off-grid backup power facilities.
  • Furthermore, the integration of deep discharge capability allows operators to achieve a 15% improvement in overall capacity retention metric tracking over extended lifecycles. By leveraging advanced zinc-ion electrochemistry and optimizing the stationary storage architecture, energy managers drastically reduce site preparation requirements.
  • Consequently, the resulting thermal management reduction yields a 20% decrease in auxiliary power consumption, empowering utility-scale deployment projects to operate with higher efficiency and significantly lower long-term maintenance costs.

What challenges does the Aqueous Batteries Industry face during its growth?

  • Limited energy density compared with alternative battery chemistries remains a significant operational hurdle that restricts widespread utility-scale commercialization and flexible deployment.

  • Structural limitations surrounding energy density optimization continue to hinder the rapid commercialization of water-based chemistries within space-constrained environments. Because these systems currently offer a lower volumetric output than a conventional non-lithium alternative platform, developers face a 30% increase in spatial footprint requirements for equivalent capacity.
  • This physical constraint directly complicates transmission network upgrade planning in urban centers where land availability is severely restricted. Furthermore, achieving reliable reversible zinc deposition remains technically difficult, as dendrite suppression mechanism failures can reduce the charge retention capacity by 15% over prolonged cycling.
  • Although organizations deploy intercalating cathode materials and focus on cathode degradation mitigation, overcoming these barriers requires substantial engineering investments. Consequently, ensuring consistent operational continuity and securing raw material availability remain critical obstacles for large-scale energy deployments.

Exclusive Technavio Analysis on Customer Landscape

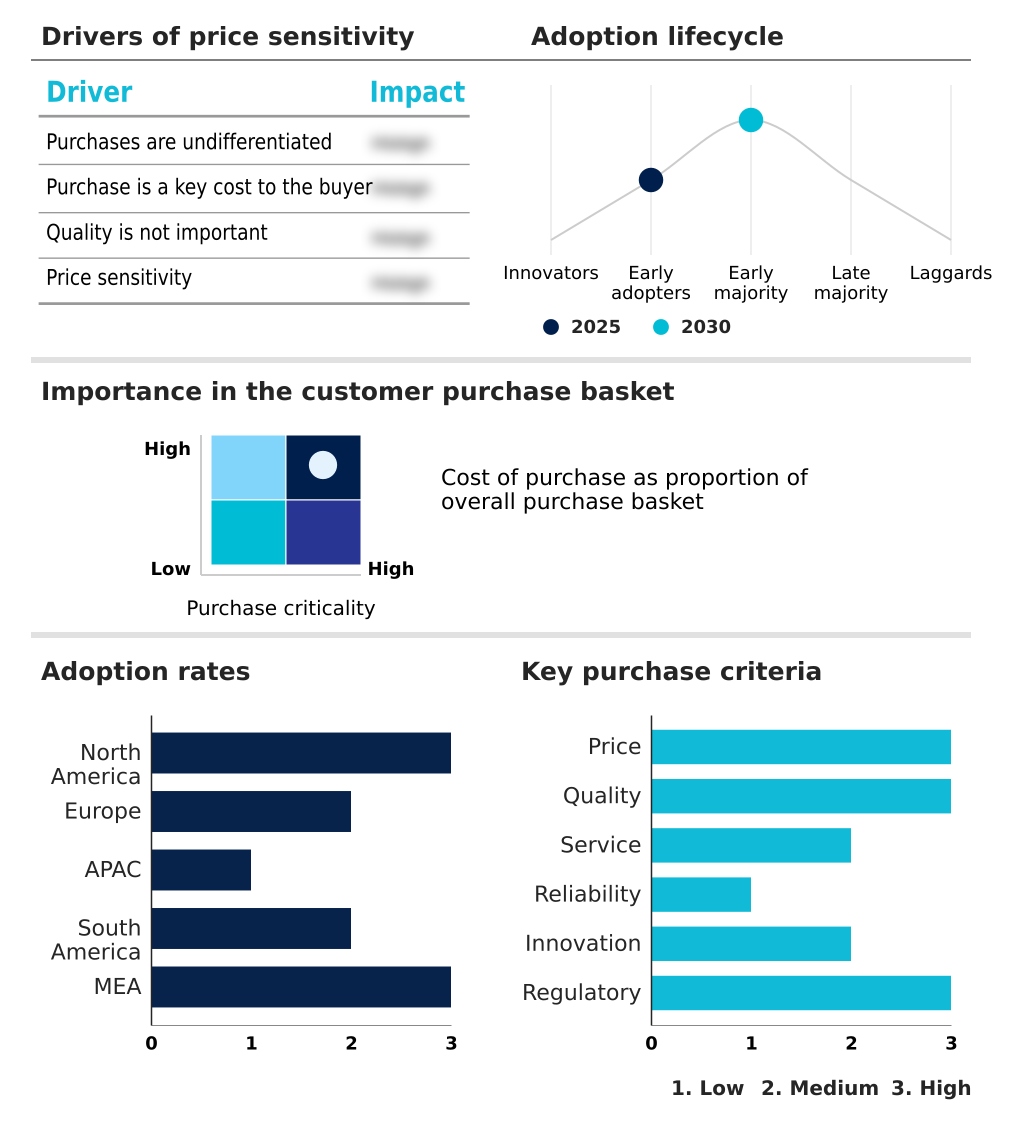
The aqueous batteries market forecasting report includes the adoption lifecycle of the market, covering from the innovator’s stage to the laggard’s stage. It focuses on adoption rates in different regions based on penetration. Furthermore, the aqueous batteries market report also includes key purchase criteria and drivers of price sensitivity to help companies evaluate and develop their market growth analysis strategies.
Customer Landscape of Aqueous Batteries Industry

Competitive Landscape

Companies are implementing various strategies, such as strategic alliances, aqueous batteries market forecast, partnerships, mergers and acquisitions, geographical expansion, and product/service launches, to enhance their presence in the industry.

Alsym Energy - The enterprise provides advanced non-flammable energy storage systems and rechargeable battery solutions tailored for diverse commercial environments, prioritizing operational safety and continuous power availability.

The industry research and growth report includes detailed analyses of the competitive landscape of the market and information about key companies, including:

  • Alsym Energy
  • AQUABATTERY
  • CellCube Energy Storage GmbH
  • CMBlu Energy AG
  • e Zinc Inc.
  • EnerVenue
  • Enzinc
  • EOS Energy Enterprises Inc.
  • ESS Tech Inc.
  • Form Energy
  • Gelion plc
  • Invinity Energy Systems plc
  • Kemiwatt
  • Pinflow Energy Storage
  • RKP Storage
  • Salient Energy
  • StorEn Technologies Inc.
  • Urban Electric Power
  • Volterion GmbH
  • VRB Energy
  • ZincFive Inc.

Qualitative and quantitative analysis of companies has been conducted to help clients understand the wider business environment as well as the strengths and weaknesses of key industry players. Data is qualitatively analyzed to categorize companies as pure play, category-focused, industry-focused, and diversified; it is quantitatively analyzed to categorize companies as dominant, leading, strong, tentative, and weak.

Recent Development and News in Aqueous batteries market

  • In the Renewable Electricity industry, the aggressive expansion of utility-scale deployment for offshore wind farms has created severe grid balancing issues, directly impacting Aqueous Batteries demand by requiring a 40% increase in long-duration storage capacity.
  • The implementation of the EU Critical Raw Materials Act has forced manufacturers to prioritize critical mineral independence, accelerating the adoption of non-lithium alternative systems and driving a 25% surge in supply chain resilience planning.
  • Surging investments in microgrid infrastructure for remote mining operations have necessitated robust off-grid backup power, pulling demand for safe stationary battery solutions that reduce diesel reliance by up to 30% annually.
  • National transmission network upgrade mandates aimed at enhancing grid modernization initiatives have shifted procurement toward systems with a high capacity retention metric, resulting in a 20% faster integration of water-based storage technologies for infrastructure resilience.

Dive into Technavio’s robust research methodology, blending expert interviews, extensive data synthesis, and validated models for unparalleled Aqueous Batteries Market insights. See full methodology.

Market Scope
Page number 302
Base year 2025
Historic period 2020-2024
Forecast period 2026-2030
Growth momentum & CAGR Accelerate at a CAGR of 25.6%
Market growth 2026-2030 USD 927722.7 thousand
Market structure Fragmented
YoY growth 2025-2026(%) 25.0%
Key countries US, Canada, Mexico, Germany, UK, France, Italy, Spain, The Netherlands, China, Japan, South Korea, India, Australia, Indonesia, Brazil, Argentina, Chile, Saudi Arabia, UAE, South Africa, Turkey and Israel
Competitive landscape Leading Companies, Market Positioning of Companies, Competitive Strategies, and Industry Risks

Request Free Sample

Research Analyst Overview

  • The Aqueous Batteries Market is undergoing a rapid technological evolution as infrastructure operators demand safer, highly durable power reserves. The integration of a non-flammable battery system directly influences boardroom-level budgeting decisions, allowing organizations to allocate fewer capital resources to complex fire suppression technologies.
  • Facilities implementing advanced stationary storage architecture have realized a 30% decrease in long-term thermal management overhead compared to conventional volatile setups. The continuous refinement of zinc-ion electrochemistry and reversible zinc deposition enables extended operational lifespans, optimizing overall asset utilization. An optimized water-based electrolyte configuration significantly improves the electrochemical stability window, mitigating early-stage degradation.
  • Furthermore, breakthroughs in long-duration energy storage ensure that grid operators can effectively balance variable renewable generation. Strategic investments in dendrite suppression mechanism protocols have minimized short-circuit risks, reinforcing system reliability. Consequently, industrial energy planners are standardizing these advanced chemistries across critical infrastructure to ensure continuous, resilient power delivery while remaining strictly aligned with emerging environmental and safety compliance mandates.

What are the Key Data Covered in this Aqueous Batteries Market Research and Growth Report?

  • What is the expected growth of the Aqueous Batteries Market between 2026 and 2030?

    • USD 927.72 million, at a CAGR of 25.6%

  • What segmentation does the market report cover?

    • The report is segmented by Type (Aqueous li-ion battery, Aqueous zinc-ion battery, and Others), Application (Electric vehicle, Energy storage, Consumer electronics, and Others), End-user (Utility sector, Automotive, Electronics manufacturers, and Government and military) and Geography (North America, Europe, APAC, South America, Middle East and Africa)

  • Which regions are analyzed in the report?

    • North America, Europe, APAC, South America and Middle East and Africa

  • What are the key growth drivers and market challenges?

    • Increasing grid-scale energy storage requirements from renewable integration, Limited energy density compared with alternative battery chemistries

  • Who are the major players in the Aqueous Batteries Market?

    • Alsym Energy, AQUABATTERY, CellCube Energy Storage GmbH, CMBlu Energy AG, e Zinc Inc., EnerVenue, Enzinc, EOS Energy Enterprises Inc., ESS Tech Inc., Form Energy, Gelion plc, Invinity Energy Systems plc, Kemiwatt, Pinflow Energy Storage, RKP Storage, Salient Energy, StorEn Technologies Inc., Urban Electric Power, Volterion GmbH, VRB Energy and ZincFive Inc.

Market Research Insights

  • The Aqueous Batteries Market is fundamentally reshaping utility-scale deployment by prioritizing non-flammable infrastructure and sustainable asset management. Organizations focused on renewable energy integration are shifting procurement toward safer chemistries, achieving a 20% increase in power system stability during peak demand cycles.
  • Furthermore, the push for critical mineral independence has accelerated the adoption of alternative chemistries, resulting in a 15% reduction in raw material acquisition bottlenecks compared to legacy lithium-based systems. This strategic pivot enhances overall infrastructure resilience, allowing commercial operators to streamline standardized installation platforms.
  • By deploying these advanced configurations, energy planners have realized a 12% improvement in lifecycle operational efficiency, validating the transition toward highly durable, water-based energy storage networks.

We can help! Our analysts can customize this aqueous batteries market research report to meet your requirements.

Get in touch

1. Executive Summary

1.1 Market overview

Executive Summary - Chart on Market Overview
Executive Summary - Data Table on Market Overview
Executive Summary - Chart on Global Market Characteristics
Executive Summary - Chart on Market by Geography
Executive Summary - Chart on Market Segmentation by Type
Executive Summary - Chart on Market Segmentation by Application
Executive Summary - Chart on Market Segmentation by End-user
Executive Summary - Chart on Incremental Growth
Executive Summary - Data Table on Incremental Growth
Executive Summary - Chart on Company Market Positioning

2. Technavio Analysis

2.1 Analysis of price sensitivity, lifecycle, customer purchase basket, adoption rates, and purchase criteria

2.2 Criticality of inputs and Factors of differentiation

Chart on Overview on criticality of inputs and factors of differentiation

2.3 Factors of disruption

Chart on Overview on factors of disruption

2.4 Impact of drivers and challenges

Chart on Impact of drivers and challenges in 2025 and 2030

3. Market Landscape

3.1 Market ecosystem

Chart on Parent Market
Data Table on - Parent Market

3.2 Market characteristics

Chart on Market characteristics analysis

3.3 Value chain analysis

Chart on Value chain analysis

4. Market Sizing

4.1 Market definition

Data Table on Offerings of companies included in the market definition

4.2 Market segment analysis

Market segments

4.3 Market size 2025

4.4 Market outlook: Forecast for 2025-2030

Chart on Global - Market size and forecast 2025-2030 ($ thousand)
Data Table on Global - Market size and forecast 2025-2030 ($ thousand)
Chart on Global Market: Year-over-year growth 2025-2030 (%)
Data Table on Global Market: Year-over-year growth 2025-2030 (%)

5. Historic Market Size

5.1 Global Aqueous Batteries Market 2020 - 2024

Historic Market Size - Data Table on Global Aqueous Batteries Market 2020 - 2024 ($ thousand)

5.2 Type segment analysis 2020 - 2024

Historic Market Size - Type Segment 2020 - 2024 ($ thousand)

5.3 Application segment analysis 2020 - 2024

Historic Market Size - Application Segment 2020 - 2024 ($ thousand)

5.4 End-user segment analysis 2020 - 2024

Historic Market Size - End-user Segment 2020 - 2024 ($ thousand)

5.5 Geography segment analysis 2020 - 2024

Historic Market Size - Geography Segment 2020 - 2024 ($ thousand)

5.6 Country segment analysis 2020 - 2024

Historic Market Size - Country Segment 2020 - 2024 ($ thousand)

6. Qualitative Analysis

6.1 Impact of AI on global aqueous batteries market

6.2 Impact of geopolitical conflicts on global aqueous batteries market

7. Five Forces Analysis

7.1 Five forces summary

Five forces analysis - Comparison between 2025 and 2030

7.2 Bargaining power of buyers

Bargaining power of buyers - Impact of key factors 2025 and 2030

7.3 Bargaining power of suppliers

Bargaining power of suppliers - Impact of key factors in 2025 and 2030

7.4 Threat of new entrants

Threat of new entrants - Impact of key factors in 2025 and 2030

7.5 Threat of substitutes

Threat of substitutes - Impact of key factors in 2025 and 2030

7.6 Threat of rivalry

Threat of rivalry - Impact of key factors in 2025 and 2030

7.7 Market condition

Chart on Market condition - Five forces 2025 and 2030

8. Market Segmentation by Type

8.1 Market segments

Chart on Type - Market share 2025-2030 (%)
Data Table on Type - Market share 2025-2030 (%)

8.2 Comparison by Type

Chart on Comparison by Type
Data Table on Comparison by Type

8.3 Aqueous li-ion battery - Market size and forecast 2025-2030

Chart on Aqueous li-ion battery - Market size and forecast 2025-2030 ($ thousand)
Data Table on Aqueous li-ion battery - Market size and forecast 2025-2030 ($ thousand)
Chart on Aqueous li-ion battery - Year-over-year growth 2025-2030 (%)
Data Table on Aqueous li-ion battery - Year-over-year growth 2025-2030 (%)

8.4 Aqueous zinc-ion battery - Market size and forecast 2025-2030

Chart on Aqueous zinc-ion battery - Market size and forecast 2025-2030 ($ thousand)
Data Table on Aqueous zinc-ion battery - Market size and forecast 2025-2030 ($ thousand)
Chart on Aqueous zinc-ion battery - Year-over-year growth 2025-2030 (%)
Data Table on Aqueous zinc-ion battery - Year-over-year growth 2025-2030 (%)

8.5 Others - Market size and forecast 2025-2030

Chart on Others - Market size and forecast 2025-2030 ($ thousand)
Data Table on Others - Market size and forecast 2025-2030 ($ thousand)
Chart on Others - Year-over-year growth 2025-2030 (%)
Data Table on Others - Year-over-year growth 2025-2030 (%)

8.6 Market opportunity by Type

Market opportunity by Type ($ thousand)
Data Table on Market opportunity by Type ($ thousand)

9. Market Segmentation by Application

9.1 Market segments

Chart on Application - Market share 2025-2030 (%)
Data Table on Application - Market share 2025-2030 (%)

9.2 Comparison by Application

Chart on Comparison by Application
Data Table on Comparison by Application

9.3 Electric vehicle - Market size and forecast 2025-2030

Chart on Electric vehicle - Market size and forecast 2025-2030 ($ thousand)
Data Table on Electric vehicle - Market size and forecast 2025-2030 ($ thousand)
Chart on Electric vehicle - Year-over-year growth 2025-2030 (%)
Data Table on Electric vehicle - Year-over-year growth 2025-2030 (%)

9.4 Energy storage - Market size and forecast 2025-2030

Chart on Energy storage - Market size and forecast 2025-2030 ($ thousand)
Data Table on Energy storage - Market size and forecast 2025-2030 ($ thousand)
Chart on Energy storage - Year-over-year growth 2025-2030 (%)
Data Table on Energy storage - Year-over-year growth 2025-2030 (%)

9.5 Consumer electronics - Market size and forecast 2025-2030

Chart on Consumer electronics - Market size and forecast 2025-2030 ($ thousand)
Data Table on Consumer electronics - Market size and forecast 2025-2030 ($ thousand)
Chart on Consumer electronics - Year-over-year growth 2025-2030 (%)
Data Table on Consumer electronics - Year-over-year growth 2025-2030 (%)

9.6 Others - Market size and forecast 2025-2030

Chart on Others - Market size and forecast 2025-2030 ($ thousand)
Data Table on Others - Market size and forecast 2025-2030 ($ thousand)
Chart on Others - Year-over-year growth 2025-2030 (%)
Data Table on Others - Year-over-year growth 2025-2030 (%)

9.7 Market opportunity by Application

Market opportunity by Application ($ thousand)
Data Table on Market opportunity by Application ($ thousand)

10. Market Segmentation by End-user

10.1 Market segments

Chart on End-user - Market share 2025-2030 (%)
Data Table on End-user - Market share 2025-2030 (%)

10.2 Comparison by End-user

Chart on Comparison by End-user
Data Table on Comparison by End-user

10.3 Utility sector - Market size and forecast 2025-2030

Chart on Utility sector - Market size and forecast 2025-2030 ($ thousand)
Data Table on Utility sector - Market size and forecast 2025-2030 ($ thousand)
Chart on Utility sector - Year-over-year growth 2025-2030 (%)
Data Table on Utility sector - Year-over-year growth 2025-2030 (%)

10.4 Automotive - Market size and forecast 2025-2030

Chart on Automotive - Market size and forecast 2025-2030 ($ thousand)
Data Table on Automotive - Market size and forecast 2025-2030 ($ thousand)
Chart on Automotive - Year-over-year growth 2025-2030 (%)
Data Table on Automotive - Year-over-year growth 2025-2030 (%)

10.5 Electronics manufacturers - Market size and forecast 2025-2030

Chart on Electronics manufacturers - Market size and forecast 2025-2030 ($ thousand)
Data Table on Electronics manufacturers - Market size and forecast 2025-2030 ($ thousand)
Chart on Electronics manufacturers - Year-over-year growth 2025-2030 (%)
Data Table on Electronics manufacturers - Year-over-year growth 2025-2030 (%)

10.6 Government and military - Market size and forecast 2025-2030

Chart on Government and military - Market size and forecast 2025-2030 ($ thousand)
Data Table on Government and military - Market size and forecast 2025-2030 ($ thousand)
Chart on Government and military - Year-over-year growth 2025-2030 (%)
Data Table on Government and military - Year-over-year growth 2025-2030 (%)

10.7 Market opportunity by End-user

Market opportunity by End-user ($ thousand)
Data Table on Market opportunity by End-user ($ thousand)

11. Customer Landscape

11.1 Customer landscape overview

Analysis of price sensitivity, lifecycle, customer purchase basket, adoption rates, and purchase criteria

12. Geographic Landscape

12.1 Geographic segmentation

Chart on Market share by geography 2025-2030 (%)
Data Table on Market share by geography 2025-2030 (%)

12.2 Geographic comparison

Chart on Geographic comparison
Data Table on Geographic comparison

12.3 North America - Market size and forecast 2025-2030

Chart on North America - Market size and forecast 2025-2030 ($ thousand)
Data Table on North America - Market size and forecast 2025-2030 ($ thousand)
Chart on North America - Year-over-year growth 2025-2030 (%)
Data Table on North America - Year-over-year growth 2025-2030 (%)
Chart on Regional Comparison - North America
Data Table on Regional Comparison - North America

12.3.1 US - Market size and forecast 2025-2030

Chart on US - Market size and forecast 2025-2030 ($ thousand)
Data Table on US - Market size and forecast 2025-2030 ($ thousand)
Chart on US - Year-over-year growth 2025-2030 (%)
Data Table on US - Year-over-year growth 2025-2030 (%)

12.3.2 Canada - Market size and forecast 2025-2030

Chart on Canada - Market size and forecast 2025-2030 ($ thousand)
Data Table on Canada - Market size and forecast 2025-2030 ($ thousand)
Chart on Canada - Year-over-year growth 2025-2030 (%)
Data Table on Canada - Year-over-year growth 2025-2030 (%)

12.3.3 Mexico - Market size and forecast 2025-2030

Chart on Mexico - Market size and forecast 2025-2030 ($ thousand)
Data Table on Mexico - Market size and forecast 2025-2030 ($ thousand)
Chart on Mexico - Year-over-year growth 2025-2030 (%)
Data Table on Mexico - Year-over-year growth 2025-2030 (%)

12.4 Europe - Market size and forecast 2025-2030

Chart on Europe - Market size and forecast 2025-2030 ($ thousand)
Data Table on Europe - Market size and forecast 2025-2030 ($ thousand)
Chart on Europe - Year-over-year growth 2025-2030 (%)
Data Table on Europe - Year-over-year growth 2025-2030 (%)
Chart on Regional Comparison - Europe
Data Table on Regional Comparison - Europe

12.4.1 Germany - Market size and forecast 2025-2030

Chart on Germany - Market size and forecast 2025-2030 ($ thousand)
Data Table on Germany - Market size and forecast 2025-2030 ($ thousand)
Chart on Germany - Year-over-year growth 2025-2030 (%)
Data Table on Germany - Year-over-year growth 2025-2030 (%)

12.4.2 UK - Market size and forecast 2025-2030

Chart on UK - Market size and forecast 2025-2030 ($ thousand)
Data Table on UK - Market size and forecast 2025-2030 ($ thousand)
Chart on UK - Year-over-year growth 2025-2030 (%)
Data Table on UK - Year-over-year growth 2025-2030 (%)

12.4.3 France - Market size and forecast 2025-2030

Chart on France - Market size and forecast 2025-2030 ($ thousand)
Data Table on France - Market size and forecast 2025-2030 ($ thousand)
Chart on France - Year-over-year growth 2025-2030 (%)
Data Table on France - Year-over-year growth 2025-2030 (%)

12.4.4 Italy - Market size and forecast 2025-2030

Chart on Italy - Market size and forecast 2025-2030 ($ thousand)
Data Table on Italy - Market size and forecast 2025-2030 ($ thousand)
Chart on Italy - Year-over-year growth 2025-2030 (%)
Data Table on Italy - Year-over-year growth 2025-2030 (%)

12.4.5 Spain - Market size and forecast 2025-2030

Chart on Spain - Market size and forecast 2025-2030 ($ thousand)
Data Table on Spain - Market size and forecast 2025-2030 ($ thousand)
Chart on Spain - Year-over-year growth 2025-2030 (%)
Data Table on Spain - Year-over-year growth 2025-2030 (%)

12.4.6 The Netherlands - Market size and forecast 2025-2030

Chart on The Netherlands - Market size and forecast 2025-2030 ($ thousand)
Data Table on The Netherlands - Market size and forecast 2025-2030 ($ thousand)
Chart on The Netherlands - Year-over-year growth 2025-2030 (%)
Data Table on The Netherlands - Year-over-year growth 2025-2030 (%)

12.5 APAC - Market size and forecast 2025-2030

Chart on APAC - Market size and forecast 2025-2030 ($ thousand)
Data Table on APAC - Market size and forecast 2025-2030 ($ thousand)
Chart on APAC - Year-over-year growth 2025-2030 (%)
Data Table on APAC - Year-over-year growth 2025-2030 (%)
Chart on Regional Comparison - APAC
Data Table on Regional Comparison - APAC

12.5.1 China - Market size and forecast 2025-2030

Chart on China - Market size and forecast 2025-2030 ($ thousand)
Data Table on China - Market size and forecast 2025-2030 ($ thousand)
Chart on China - Year-over-year growth 2025-2030 (%)
Data Table on China - Year-over-year growth 2025-2030 (%)

12.5.2 Japan - Market size and forecast 2025-2030

Chart on Japan - Market size and forecast 2025-2030 ($ thousand)
Data Table on Japan - Market size and forecast 2025-2030 ($ thousand)
Chart on Japan - Year-over-year growth 2025-2030 (%)
Data Table on Japan - Year-over-year growth 2025-2030 (%)

12.5.3 South Korea - Market size and forecast 2025-2030

Chart on South Korea - Market size and forecast 2025-2030 ($ thousand)
Data Table on South Korea - Market size and forecast 2025-2030 ($ thousand)
Chart on South Korea - Year-over-year growth 2025-2030 (%)
Data Table on South Korea - Year-over-year growth 2025-2030 (%)

12.5.4 India - Market size and forecast 2025-2030

Chart on India - Market size and forecast 2025-2030 ($ thousand)
Data Table on India - Market size and forecast 2025-2030 ($ thousand)
Chart on India - Year-over-year growth 2025-2030 (%)
Data Table on India - Year-over-year growth 2025-2030 (%)

12.5.5 Australia - Market size and forecast 2025-2030

Chart on Australia - Market size and forecast 2025-2030 ($ thousand)
Data Table on Australia - Market size and forecast 2025-2030 ($ thousand)
Chart on Australia - Year-over-year growth 2025-2030 (%)
Data Table on Australia - Year-over-year growth 2025-2030 (%)

12.5.6 Indonesia - Market size and forecast 2025-2030

Chart on Indonesia - Market size and forecast 2025-2030 ($ thousand)
Data Table on Indonesia - Market size and forecast 2025-2030 ($ thousand)
Chart on Indonesia - Year-over-year growth 2025-2030 (%)
Data Table on Indonesia - Year-over-year growth 2025-2030 (%)

12.6 South America - Market size and forecast 2025-2030

Chart on South America - Market size and forecast 2025-2030 ($ thousand)
Data Table on South America - Market size and forecast 2025-2030 ($ thousand)
Chart on South America - Year-over-year growth 2025-2030 (%)
Data Table on South America - Year-over-year growth 2025-2030 (%)
Chart on Regional Comparison - South America
Data Table on Regional Comparison - South America

12.6.1 Brazil - Market size and forecast 2025-2030

Chart on Brazil - Market size and forecast 2025-2030 ($ thousand)
Data Table on Brazil - Market size and forecast 2025-2030 ($ thousand)
Chart on Brazil - Year-over-year growth 2025-2030 (%)
Data Table on Brazil - Year-over-year growth 2025-2030 (%)

12.6.2 Argentina - Market size and forecast 2025-2030

Chart on Argentina - Market size and forecast 2025-2030 ($ thousand)
Data Table on Argentina - Market size and forecast 2025-2030 ($ thousand)
Chart on Argentina - Year-over-year growth 2025-2030 (%)
Data Table on Argentina - Year-over-year growth 2025-2030 (%)

12.6.3 Chile - Market size and forecast 2025-2030

Chart on Chile - Market size and forecast 2025-2030 ($ thousand)
Data Table on Chile - Market size and forecast 2025-2030 ($ thousand)
Chart on Chile - Year-over-year growth 2025-2030 (%)
Data Table on Chile - Year-over-year growth 2025-2030 (%)

12.7 Middle East and Africa - Market size and forecast 2025-2030

Chart on Middle East and Africa - Market size and forecast 2025-2030 ($ thousand)
Data Table on Middle East and Africa - Market size and forecast 2025-2030 ($ thousand)
Chart on Middle East and Africa - Year-over-year growth 2025-2030 (%)
Data Table on Middle East and Africa - Year-over-year growth 2025-2030 (%)
Chart on Regional Comparison - Middle East and Africa
Data Table on Regional Comparison - Middle East and Africa

12.7.1 Saudi Arabia - Market size and forecast 2025-2030

Chart on Saudi Arabia - Market size and forecast 2025-2030 ($ thousand)
Data Table on Saudi Arabia - Market size and forecast 2025-2030 ($ thousand)
Chart on Saudi Arabia - Year-over-year growth 2025-2030 (%)
Data Table on Saudi Arabia - Year-over-year growth 2025-2030 (%)

12.7.2 UAE - Market size and forecast 2025-2030

Chart on UAE - Market size and forecast 2025-2030 ($ thousand)
Data Table on UAE - Market size and forecast 2025-2030 ($ thousand)
Chart on UAE - Year-over-year growth 2025-2030 (%)
Data Table on UAE - Year-over-year growth 2025-2030 (%)

12.7.3 South Africa - Market size and forecast 2025-2030

Chart on South Africa - Market size and forecast 2025-2030 ($ thousand)
Data Table on South Africa - Market size and forecast 2025-2030 ($ thousand)
Chart on South Africa - Year-over-year growth 2025-2030 (%)
Data Table on South Africa - Year-over-year growth 2025-2030 (%)

12.7.4 Turkey - Market size and forecast 2025-2030

Chart on Turkey - Market size and forecast 2025-2030 ($ thousand)
Data Table on Turkey - Market size and forecast 2025-2030 ($ thousand)
Chart on Turkey - Year-over-year growth 2025-2030 (%)
Data Table on Turkey - Year-over-year growth 2025-2030 (%)

12.7.5 Israel - Market size and forecast 2025-2030

Chart on Israel - Market size and forecast 2025-2030 ($ thousand)
Data Table on Israel - Market size and forecast 2025-2030 ($ thousand)
Chart on Israel - Year-over-year growth 2025-2030 (%)
Data Table on Israel - Year-over-year growth 2025-2030 (%)

12.8 Market opportunity by geography

Market opportunity by geography ($ thousand)
Data Tables on Market opportunity by geography ($ thousand)

13. Drivers, Challenges, and Opportunity

13.1 Market drivers

Increasing grid-scale energy storage requirements from renewable integration
Growing emphasis on non-flammable energy storage technologies
Expanding investments in power infrastructure modernization programs

13.2 Market challenges

Limited energy density compared with alternative battery chemistries
Material stability constraints affecting long-duration performance
Slow commercialization across utility-scale deployment environments

13.3 Impact of drivers and challenges

Impact of drivers and challenges in 2025 and 2030

13.4 Market opportunities

Advancing zinc-based aqueous battery development pathways
Increasing adoption of modular containerized storage architectures
Evolving strategic partnerships between battery developers and utilities

14. Competitive Landscape

14.1 Overview

14.2

Overview on criticality of inputs and factors of differentiation

14.3 Landscape disruption

Overview on factors of disruption

14.4 Industry risks

Impact of key risks on business

15. Competitive Analysis

15.1 Companies profiled

Companies covered

15.2 Company ranking index

15.3 Market positioning of companies

Matrix on companies position and classification

15.4 Alsym Energy

Alsym Energy - Overview
Alsym Energy - Product / Service
Alsym Energy - Key offerings
SWOT

15.5 AQUABATTERY

AQUABATTERY - Overview
AQUABATTERY - Product / Service
AQUABATTERY - Key offerings
SWOT

15.6 CellCube Energy Storage GmbH

CellCube Energy Storage GmbH - Overview
CellCube Energy Storage GmbH - Product / Service
CellCube Energy Storage GmbH - Key offerings
SWOT

15.7 CMBlu Energy AG

CMBlu Energy AG - Overview
CMBlu Energy AG - Product / Service
CMBlu Energy AG - Key offerings
SWOT

15.8 e Zinc Inc.

e Zinc Inc. - Overview
e Zinc Inc. - Product / Service
e Zinc Inc. - Key offerings
SWOT

15.9 EnerVenue

EnerVenue - Overview
EnerVenue - Product / Service
EnerVenue - Key offerings
SWOT

15.10 Enzinc

Enzinc - Overview
Enzinc - Product / Service
Enzinc - Key offerings
SWOT

15.11 EOS Energy Enterprises Inc.

EOS Energy Enterprises Inc. - Overview
EOS Energy Enterprises Inc. - Product / Service
EOS Energy Enterprises Inc. - Key offerings
SWOT

15.12 ESS Tech Inc.

ESS Tech Inc. - Overview
ESS Tech Inc. - Product / Service
ESS Tech Inc. - Key offerings
SWOT

15.13 Form Energy

Form Energy - Overview
Form Energy - Product / Service
Form Energy - Key offerings
SWOT

15.14 Gelion plc

Gelion plc - Overview
Gelion plc - Product / Service
Gelion plc - Key offerings
SWOT

15.15 Invinity Energy Systems plc

Invinity Energy Systems plc - Overview
Invinity Energy Systems plc - Product / Service
Invinity Energy Systems plc - Key offerings
SWOT

15.16 Kemiwatt

Kemiwatt - Overview
Kemiwatt - Product / Service
Kemiwatt - Key offerings
SWOT

15.17 Pinflow Energy Storage

Pinflow Energy Storage - Overview
Pinflow Energy Storage - Product / Service
Pinflow Energy Storage - Key offerings
SWOT

15.18 RKP Storage

RKP Storage - Overview
RKP Storage - Product / Service
RKP Storage - Key offerings
SWOT

16. Appendix

16.1 Scope of the report

Market definition
Objectives
Notes and caveats

16.2 Inclusions and exclusions checklist

Inclusions checklist
Exclusions checklist

16.3 Currency conversion rates for US$

16.4 Research methodology

16.5 Data procurement

Information sources

16.6 Data validation

16.7 Validation techniques employed for market sizing

16.8 Data synthesis

16.9 360 degree market analysis

16.10 List of abbreviations

Research Methodology

Technavio presents a detailed picture of the market by way of study, synthesis, and summation of data from multiple sources. The analysts have presented the various facets of the market with a particular focus on identifying the key industry influencers. The data thus presented is comprehensive, reliable, and the result of extensive research, both primary and secondary.

INFORMATION SOURCES

Primary sources

  • Manufacturers and suppliers
  • Channel partners
  • Industry experts
  • Strategic decision makers

Secondary sources

  • Industry journals and periodicals
  • Government data
  • Financial reports of key industry players
  • Historical data
  • Press releases

DATA ANALYSIS

Data Synthesis

  • Collation of data
  • Estimation of key figures
  • Analysis of derived insights

Data Validation

  • Triangulation with data models
  • Reference against proprietary databases
  • Corroboration with industry experts

REPORT WRITING

Qualitative

  • Market drivers
  • Market challenges
  • Market trends
  • Five forces analysis

Quantitative

  • Market size and forecast
  • Market segmentation
  • Geographical insights
  • Competitive landscape

Interested in this report?

Get your sample now to see our research methodology and insights!

Download Now

Frequently Asked Questions

Aqueous Batteries market growth will increase by USD 927722.7 thousand thousand during 2026-2030.

The Aqueous Batteries market is expected to grow at a CAGR of 25.6% during 2026-2030.

Aqueous Batteries market is segmented by Type (Aqueous li-ion battery, Aqueous zinc-ion battery, Others) Application (Electric vehicle, Energy storage, Consumer electronics, Others) End-user (Utility sector, Automotive, Electronics manufacturers, Government and military)

Alsym Energy, AQUABATTERY, CellCube Energy Storage GmbH, CMBlu Energy AG, e Zinc Inc., EnerVenue, Enzinc, EOS Energy Enterprises Inc., ESS Tech Inc., Form Energy, Gelion plc, Invinity Energy Systems plc, Kemiwatt, Pinflow Energy Storage, RKP Storage, Salient Energy, StorEn Technologies Inc., Urban Electric Power, Volterion GmbH, VRB Energy, ZincFive Inc. are a few of the key vendors in the Aqueous Batteries market.

North America will register the highest growth rate of 37.1% among the other regions. Therefore, the Aqueous Batteries market in North America is expected to garner significant business opportunities for the vendors during the forecast period.

US, Canada, Mexico, Germany, UK, France, Italy, Spain, The Netherlands, China, Japan, South Korea, India, Australia, Indonesia, Brazil, Argentina, Chile, Saudi Arabia, UAE, South Africa, Turkey, Israel

  • Increasing grid-scale energy storage requirements from renewable integration is the driving factor this market.

The Aqueous Batteries market vendors should focus on grabbing business opportunities from the Type segment as it accounted for the largest market share in the base year.
RIA - Research AI Assistant
Ask RIA
