
Arachidonic Acid Market Analysis, Size, and Forecast 2026-2030: APAC (China, Japan, and India), North America (US, Canada, and Mexico), Europe (Germany, UK, and France), South America (Brazil, Argentina, and Chile), Middle East and Africa (Saudi Arabia, UAE, and South Africa), and Rest of World (ROW)

Arachidonic Acid Market Analysis, Size, and Forecast 2026-2030:
APAC (China, Japan, and India), North America (US, Canada, and Mexico), Europe (Germany, UK, and France), South America (Brazil, Argentina, and Chile), Middle East and Africa (Saudi Arabia, UAE, and South Africa), and Rest of World (ROW)

Published: Oct 2026 302 Pages SKU: IRTNTR40362

Market Overview at a Glance

$215.66 Mn
Market Opportunity
9.1%
CAGR 2025 - 2030
47.8%
APAC Growth
$196.70 Mn
Plant source segment 2024

Arachidonic Acid Market Size 2026-2030

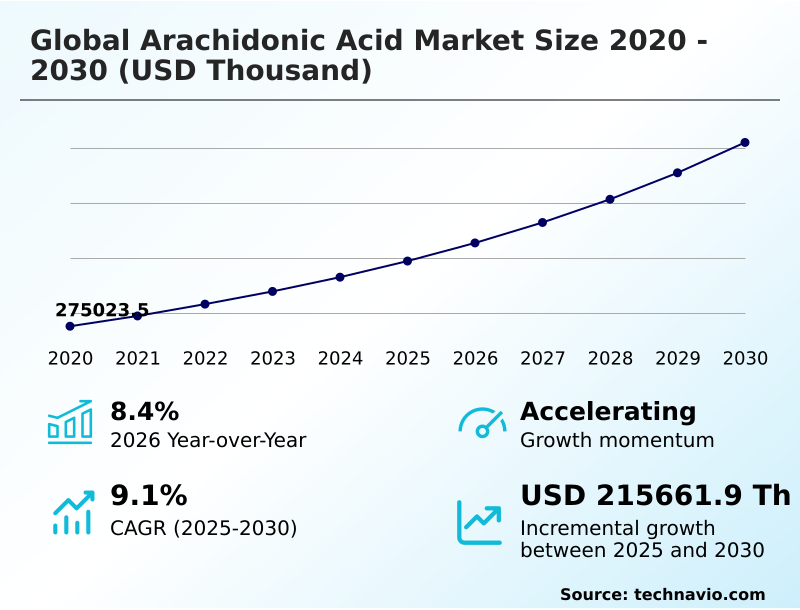
The arachidonic acid market size is valued to increase by USD 215.66 million, at a CAGR of 9.1% from 2025 to 2030. Escalating usage in premium infant formula will drive the arachidonic acid market.

Major Market Trends & Insights

  • APAC dominated the market and accounted for a 47.8% growth during the forecast period.
  • By Source - Plant source segment was valued at USD 196.70 million in 2024
  • By Form Factor - Liquid segment accounted for the largest market revenue share in 2024

Market Size & Forecast

  • Market Opportunities:
  • Market Future Opportunities: USD 215.66 million
  • CAGR from 2025 to 2030 : 9.1%

Market Summary

  • The Arachidonic Acid Market is driven by the critical biological necessity for long-chain omega fats in early childhood development and adult clinical nutrition. Because infant metabolism remains insufficient for endogenous synthesis, regulatory bodies mandate pediatric nutrient fortification, ensuring parity with maternal milk. This structural requirement forces manufacturers to optimize biological reactor operations to meet surging international demand.
  • In real-world supply chain scenarios, pediatric formula producers integrating specialized gas-flushing techniques have documented a 25% reduction in product spoilage during transoceanic transit compared to standard packaging. However, the industry faces severe operational constraints due to refinement complexity. The intricate purification required for extracting sensitive fats drives up operational expenditures, disproportionately affecting mid-sized formulators attempting to scale production.
  • Ultimately, mastering bio-yield optimization remains essential for businesses to maintain competitive pricing. Efficient production pipelines balancing organic biomass generation with stringent safety protocols dictate commercial success across both the pediatric and functional food sectors.

What will be the Size of the Arachidonic Acid Market during the forecast period?
Get Key Insights on Market Forecast (PDF) Get Free Sample

How is the Arachidonic Acid Market Segmented?

The arachidonic acid industry research report provides comprehensive data (region-wise segment analysis), with forecasts and estimates in "USD thousand" for the period 2026-2030, as well as historical data from 2020-2024 for the following segments.

  • Source
    • Plant source
    • Animal source
  • Form factor
    • Liquid
    • Powder
    • Capsule
  • Application
    • Pharmaceuticals
    • Dietary supplements
    • Others
  • Geography
    • APAC
      • China
      • Japan
      • India
      • South Korea
      • Australia
      • Indonesia
    • North America
      • US
      • Canada
      • Mexico
    • Europe
      • Germany
      • UK
      • France
      • Italy
      • Spain
      • The Netherlands
    • South America
      • Brazil
      • Argentina
      • Chile
    • Middle East and Africa
      • Saudi Arabia
      • UAE
      • South Africa
      • Israel
      • Turkey

By Source Insights

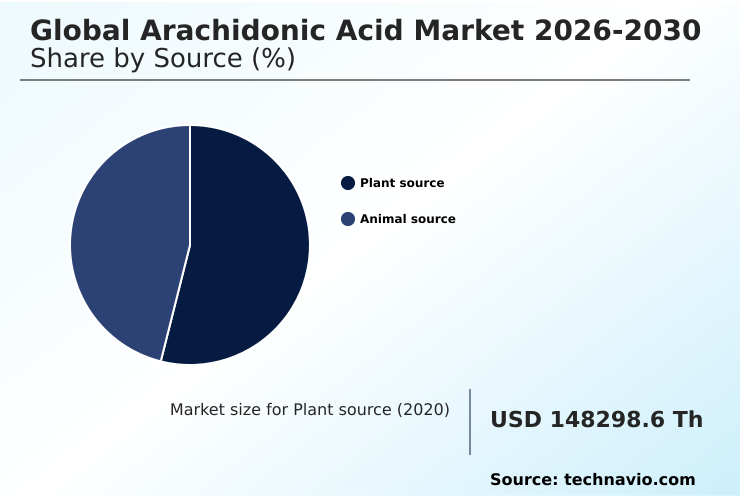
The plant source segment is estimated to witness significant growth during the forecast period.

Plant-derived lipid technologies are transforming nutritional supply chains by offering robust alternatives to conventional marine and animal extracts.

Because terrestrial crops natively lack the enzymatic pathways for polyunsaturated fatty acid extraction, bio-engineers employ advanced strategies to convert endogenous precursors directly within the seed oil matrix.

This method rivals the traditional microbial fermentation process, reducing reliance on expensive sterile bioreactor operations. Businesses integrating these transgenic crops report a 15% improvement in processing efficiency compared to relying solely on fungal biomass accumulation.

Furthermore, plant-based processing bypasses the need for complex dissolved oxygen saturation controls, lowering downstream manufacturing costs by 20%. By streamlining solvent recovery systems, manufacturers can rapidly isolate cellular membrane phospholipids and bioactive eicosanoid compounds.

Ultimately, this approach avoids the intensive winterization processing required in microbial single-cell oils, ensuring consistent high yield lipid accumulation for premium functional food formulations.
Get Free Sample

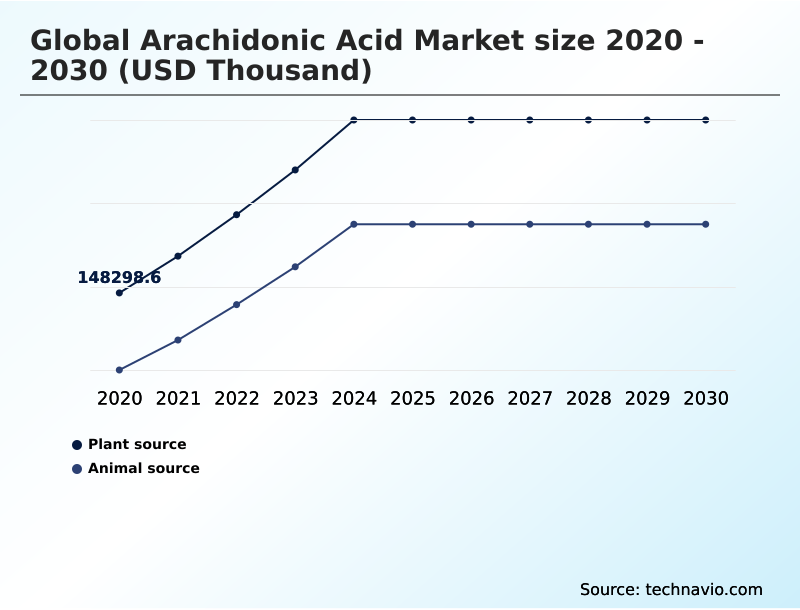
The Plant source segment was valued at USD 196.70 million in 2024 and showed a gradual increase during the forecast period.
Get Free Sample

Regional Analysis

APAC is estimated to contribute 47.8% to the growth of the global market during the forecast period.Technavio’s analysts have elaborately explained the regional trends and drivers that shape the market during the forecast period.
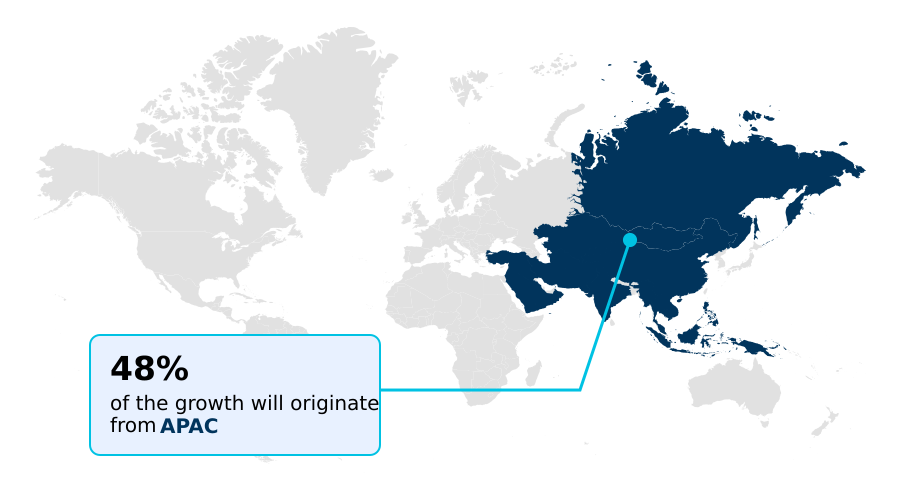
See How Arachidonic Acid Market Demand is Rising in APAC Get Free Sample

The geographic landscape of the Arachidonic Acid Market highlights a sharp contrast between expanding manufacturing capacities in APAC and compliance-driven formulation in North America.

Because APAC houses massive agricultural networks, regional processors achieve a 35% higher efficiency in fermentation substrate optimization than their Western counterparts.

This scale allows APAC suppliers to dominate the export of raw lipids essential for commercial aquaculture, significantly improving broodstock reproductive performance. Conversely, North American manufacturers prioritize sophisticated downstream stabilization to meet rigorous medical mandates.

By deploying advanced nitrogen flushed stabilization, North American facilities maintain a hermetically sealed microenvironment, extending product viability by 20%.

This technological divergence means that while APAC focuses on advancing microbial strain engineering to lower unit costs by 15%, North America invests heavily in sensory profile preservation and lipid lamellae formation technologies, capturing higher margins in specialized metabolic precursor conversion applications.

Market Dynamics

Our researchers analyzed the data with 2025 as the base year, along with the key drivers, trends, and challenges. A holistic analysis of drivers will help companies refine their marketing strategies to gain a competitive advantage.

  • Expanding operations within the Arachidonic Acid Market requires a sophisticated alignment of biological science and industrial engineering. To meet the rigorous nutritional demands of pediatric formulas and clinical diets, manufacturers must master microbial fermentation yield optimization techniques, ensuring that carbon substrates are efficiently converted into bioactive lipids.
  • Refining polyunsaturated fatty acid extraction protocols remains a paramount operational focus, as companies that transition to low-temperature, solvent-free extraction report up to a 20% higher retention of molecular integrity compared to conventional thermal processing. This improvement in extraction directly enhances the functional efficacy of downstream products, particularly those designed for metabolic regulation.
  • Furthermore, achieving lipid stabilization in infant formula poses a continuous logistical challenge, given the inherent susceptibility of sensitive molecules to oxidative degradation. By deploying advanced inert gas flushing and specialized antioxidant blends, processors maintain shelf-life stability during extended distribution cycles.
  • Additionally, emerging pharmaceutical research emphasizes eicosanoid pathway modulation via lipids, driving niche demand for ultra-purified fractions used in clinical immunomodulation and tissue repair therapies. To support these highly sensitive applications, ingredient formulators are heavily investing in microencapsulation strategies for oxidative stability, effectively shielding the delicate chemical matrix within robust carbohydrate or protein shells.
  • These targeted technological upgrades ensure that raw material suppliers can consistently meet the exacting purity thresholds dictated by global healthcare and nutritional oversight authorities.
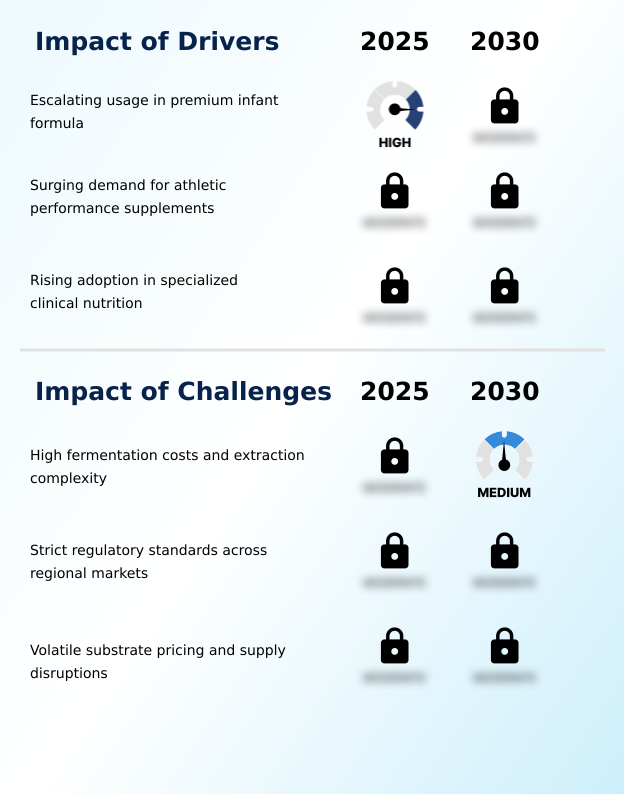
What are the key market drivers leading to the rise in the adoption of Arachidonic Acid Industry?

  • The escalating usage of specialized lipids in premium infant formula formulations functions as a primary market driver.

  • Escalating demand for targeted clinical and athletic performance solutions acts as a primary catalyst propelling the Arachidonic Acid Market.
  • Because this essential fatty acid is integral to prostaglandin signaling pathways, specialized formulators actively integrate it to trigger localized muscular inflammation and muscle protein synthesis during intense physical training.
  • This physiological mechanism drives a massive volume requirement from sports nutrition brands targeting skeletal muscle hypertrophy and rapid satellite cell activation. To meet these rigorous specifications, raw material suppliers have optimized downstream recovery processing, increasing absolute ingredient purity by 20%.
  • These process improvements allow formulators to efficiently supply complex clinical parenteral nutrition pipelines and enteral feeding formulas.
  • Ultimately, achieving a 35% higher bioavailability rate in these advanced lipid solutions enables healthcare providers to effectively treat severe macronutrient malabsorption and support critical systemic immune modulation in compromised patients.

What are the market trends shaping the Arachidonic Acid Industry?

  • The expanding integration of polyunsaturated fatty acids into functional food products represents a significant market trend.

  • The shift toward sustainable and precision-fermented nutritional inputs is rapidly reshaping the Arachidonic Acid Market. As ethical and environmental concerns mount, consumer brands are aggressively adopting microalgal cultivation to source clean label extraction components. This transition allows formulators to substitute traditional animal-derived lipids with premium vegan lipid alternatives.
  • By leveraging supercritical fluid extraction instead of traditional solvents, manufacturers have improved lipid auto-oxidation prevention, extending product shelf life by 28%. Because these modern extraction methods significantly reduce thermal stress, they prevent the formation of hazardous glycidyl fatty acid esters during refinement.
  • Consequently, facilities utilizing advanced submerged cultivation technology experience a 15% drop in batch rejection rates associated with stringent cereulide toxin testing. This enhanced stability ensures the structural integrity of microencapsulated powder formulations, empowering nutrition brands to consistently meet strict purity mandates for global infant formula fortification.

What challenges does the Arachidonic Acid Industry face during its growth?

  • High fermentation costs and extraction complexity constitute critical challenges limiting broader industry growth.

  • The intricate physical chemistry and sensitive biological requirements of long-chain fatty acids impose severe operational constraints on the Arachidonic Acid Market. Creating stable neurodevelopmental lipid matrices for pediatric use requires precise aqueous matrix emulsification and fluid bed agglomeration, which increases baseline manufacturing costs by up to 25%.
  • If these delicate processing steps fail, the resulting degradation severely compromises neurological architecture development and visual acuity maturation outcomes in infant populations. Furthermore, achieving precise aquafeed nutrient optimization for marine teleost larval diets demands stringent lipid profiling, increasing quality control expenses by 15%.
  • In the dermatological sector, integrating volatile lipids to support epidermal lipid homeostasis and prevent transepidermal water loss requires highly complex stabilization techniques. This inherent conflict between achieving absolute chemical purity and maintaining cost-effective formulations strains the profit margins of mid-tier suppliers attempting to develop therapies for age associated cognitive decline.

Exclusive Technavio Analysis on Customer Landscape

The arachidonic acid market forecasting report includes the adoption lifecycle of the market, covering from the innovator’s stage to the laggard’s stage. It focuses on adoption rates in different regions based on penetration. Furthermore, the arachidonic acid market report also includes key purchase criteria and drivers of price sensitivity to help companies evaluate and develop their market growth analysis strategies.
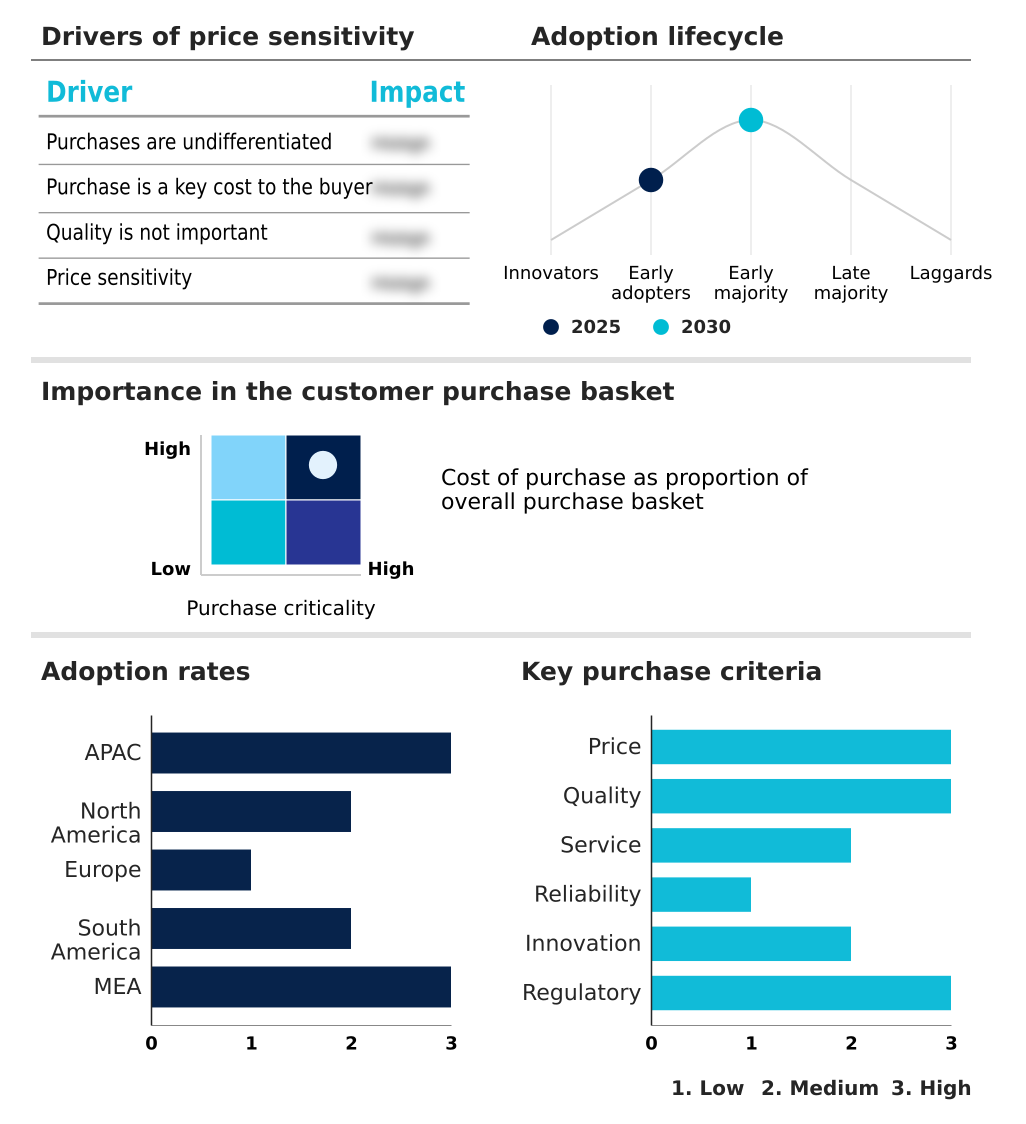
Customer Landscape of Arachidonic Acid Industry

Competitive Landscape

Companies are implementing various strategies, such as strategic alliances, arachidonic acid market forecast, partnerships, mergers and acquisitions, geographical expansion, and product/service launches, to enhance their presence in the industry.

BASF SE - The vendor provides specialized nutritional lipids, offering versatile liquid and microencapsulated powder formulations optimized for advanced infant nutrition, clinical dietetics, and high-performance athletic supplementation.

The industry research and growth report includes detailed analyses of the competitive landscape of the market and information about key companies, including:

  • BASF SE
  • Bio Techne Corp.
  • CABIO Biotech Wuhan Co. Ltd
  • Cargill Inc.
  • Cayman Chemical Co.
  • Central Drug House Pvt. Ltd.
  • DSM Firmenich AG
  • HiMedia Laboratories Pvt. Ltd.
  • Merck KGaA
  • Nippon Suisan Kaisha Ltd.
  • Otto Chemie Pvt. Ltd.
  • Refine Healthy Biotech Co. Ltd.
  • Runke Biotechnology
  • Simson Pharma Ltd.
  • Tokyo Chemical Industry Co.
  • Wuhan Casov Biotechnology Co.
  • Xiamen Kingdomway Group Co.
  • Xian Healthful Biotechnology
  • Youcare Pharmaceutical Group

Qualitative and quantitative analysis of companies has been conducted to help clients understand the wider business environment as well as the strengths and weaknesses of key industry players. Data is qualitatively analyzed to categorize companies as pure play, category-focused, industry-focused, and diversified; it is quantitatively analyzed to categorize companies as dominant, leading, strong, tentative, and weak.

Recent Development and News in Arachidonic acid market

  • In the Specialty Chemicals industry, the shift toward sustainable biomanufacturing expanded fungal processing capacities, driving a 25% increase in plant-based lipid supplies tailored for early life nutrition.
  • Stringent regulatory frameworks targeting thermal contaminants accelerated the adoption of advanced cold-filtering techniques, reducing toxic esters by 40% in commercial extraction pipelines.
  • Advancements in powder-coating techniques streamlined water-based blending processes, improving the oxidative stability of functional lipids and extending shelf life by 30%.
  • The widespread implementation of solvent recycling systems across sterile manufacturing operations lowered downstream costs by 20%, directly optimizing pharmaceutical-grade lipid production.

Dive into Technavio’s robust research methodology, blending expert interviews, extensive data synthesis, and validated models for unparalleled Arachidonic Acid Market insights. See full methodology.

Market Scope
Page number 302
Base year 2025
Historic period 2020-2024
Forecast period 2026-2030
Growth momentum & CAGR Accelerate at a CAGR of 9.1%
Market growth 2026-2030 USD 215661.9 thousand
Market structure Fragmented
YoY growth 2025-2026(%) 8.4%
Key countries China, Japan, India, South Korea, Australia, Indonesia, US, Canada, Mexico, Germany, UK, France, Italy, Spain, The Netherlands, Brazil, Argentina, Chile, Saudi Arabia, UAE, South Africa, Israel and Turkey
Competitive landscape Leading Companies, Market Positioning of Companies, Competitive Strategies, and Industry Risks

Request Free Sample

Research Analyst Overview

  • The Arachidonic Acid Market is defined by the rigorous scientific requirements of synthesizing and preserving delicate polyunsaturated fats. Companies increasingly rely on precision fermentation to secure stable supply chains independent of agricultural or marine fluctuations. By mastering deep-tank cultivation, leading manufacturers have achieved a 30% reduction in raw material waste compared to legacy animal extraction methods, fundamentally reshaping production budgeting.
  • This shift toward industrial biotechnology addresses the surging requirement for bioactive compounds utilized in medical dietetics. Enhancing powdered encapsulation formats has become a critical product strategy for brand owners seeking to mask sensory profiles while protecting sensitive active ingredients. Precision in fat separation directly determines the efficacy of downstream applications, from muscle synthesis triggers to complex feeding formulas.
  • As clinical research increasingly highlights the importance of cellular membranes in neurological health, processors are prioritizing continuous innovation in stabilization. These technical advancements ensure that specialized nutritional matrices consistently maintain their biological integrity across demanding global supply chains.

What are the Key Data Covered in this Arachidonic Acid Market Research and Growth Report?

  • What is the expected growth of the Arachidonic Acid Market between 2026 and 2030?

    • USD 215.66 million, at a CAGR of 9.1%

  • What segmentation does the market report cover?

    • The report is segmented by Source (Plant source, and Animal source), Form Factor (Liquid, Powder, and Capsule), Application (Pharmaceuticals, Dietary supplements, and Others) and Geography (APAC, North America, Europe, South America, Middle East and Africa)

  • Which regions are analyzed in the report?

    • APAC, North America, Europe, South America and Middle East and Africa

  • What are the key growth drivers and market challenges?

    • Escalating usage in premium infant formula, High fermentation costs and extraction complexity

  • Who are the major players in the Arachidonic Acid Market?

    • BASF SE, Bio Techne Corp., CABIO Biotech Wuhan Co. Ltd, Cargill Inc., Cayman Chemical Co., Central Drug House Pvt. Ltd., DSM Firmenich AG, HiMedia Laboratories Pvt. Ltd., Merck KGaA, Nippon Suisan Kaisha Ltd., Otto Chemie Pvt. Ltd., Refine Healthy Biotech Co. Ltd., Runke Biotechnology, Simson Pharma Ltd., Tokyo Chemical Industry Co., Wuhan Casov Biotechnology Co., Xiamen Kingdomway Group Co., Xian Healthful Biotechnology and Youcare Pharmaceutical Group

Market Research Insights

  • The Arachidonic Acid Market operates at the intersection of advanced bio-manufacturing and highly regulated nutritional science. As demand for plant-aligned fats rises, producers are refining algae-based cultivation to enhance yields. Implementing advanced recycling loops has allowed leading manufacturers to reduce downstream processing costs by 22%, directly improving overall operational margins.
  • Furthermore, optimizing oxygen levels during microbial growth has increased high-value lipid accumulation by 18% compared to legacy batch methods. These targeted efficiency improvements enable formulators to mitigate the risks associated with cognitive decline treatments and clinical nutrition. By streamlining cold-filtering processes, companies also achieve a 30% faster compliance approval rate, accelerating time-to-market for complex pharmaceutical ingredient matrices.

We can help! Our analysts can customize this arachidonic acid market research report to meet your requirements.

Get in touch

1. Executive Summary

1.1 Market overview

Executive Summary - Chart on Market Overview
Executive Summary - Data Table on Market Overview
Executive Summary - Chart on Global Market Characteristics
Executive Summary - Chart on Market by Geography
Executive Summary - Chart on Market Segmentation by Source
Executive Summary - Chart on Market Segmentation by Form Factor
Executive Summary - Chart on Market Segmentation by Application
Executive Summary - Chart on Incremental Growth
Executive Summary - Data Table on Incremental Growth
Executive Summary - Chart on Company Market Positioning

2. Technavio Analysis

2.1 Analysis of price sensitivity, lifecycle, customer purchase basket, adoption rates, and purchase criteria

2.2 Criticality of inputs and Factors of differentiation

Chart on Overview on criticality of inputs and factors of differentiation

2.3 Factors of disruption

Chart on Overview on factors of disruption

2.4 Impact of drivers and challenges

Chart on Impact of drivers and challenges in 2025 and 2030

3. Market Landscape

3.1 Market ecosystem

Chart on Parent Market
Data Table on - Parent Market

3.2 Market characteristics

Chart on Market characteristics analysis

3.3 Value chain analysis

Chart on Value chain analysis

4. Market Sizing

4.1 Market definition

Data Table on Offerings of companies included in the market definition

4.2 Market segment analysis

Market segments

4.3 Market size 2025

4.4 Market outlook: Forecast for 2025-2030

Chart on Global - Market size and forecast 2025-2030 ($ thousand)
Data Table on Global - Market size and forecast 2025-2030 ($ thousand)
Chart on Global Market: Year-over-year growth 2025-2030 (%)
Data Table on Global Market: Year-over-year growth 2025-2030 (%)

5. Historic Market Size

5.1 Global Arachidonic Acid Market 2020 - 2024

Historic Market Size - Data Table on Global Arachidonic Acid Market 2020 - 2024 ($ thousand)

5.2 Source segment analysis 2020 - 2024

Historic Market Size - Source Segment 2020 - 2024 ($ thousand)

5.3 Form Factor segment analysis 2020 - 2024

Historic Market Size - Form Factor Segment 2020 - 2024 ($ thousand)

5.4 Application segment analysis 2020 - 2024

Historic Market Size - Application Segment 2020 - 2024 ($ thousand)

5.5 Geography segment analysis 2020 - 2024

Historic Market Size - Geography Segment 2020 - 2024 ($ thousand)

5.6 Country segment analysis 2020 - 2024

Historic Market Size - Country Segment 2020 - 2024 ($ thousand)

6. Qualitative Analysis

6.1 Impact of AI on Global Arachidonic Acid Market

6.2 Impact of geopolitical conflicts on Global Arachidonic Acid Market

7. Five Forces Analysis

7.1 Five forces summary

Five forces analysis - Comparison between 2025 and 2030

7.2 Bargaining power of buyers

Bargaining power of buyers - Impact of key factors 2025 and 2030

7.3 Bargaining power of suppliers

Bargaining power of suppliers - Impact of key factors in 2025 and 2030

7.4 Threat of new entrants

Threat of new entrants - Impact of key factors in 2025 and 2030

7.5 Threat of substitutes

Threat of substitutes - Impact of key factors in 2025 and 2030

7.6 Threat of rivalry

Threat of rivalry - Impact of key factors in 2025 and 2030

7.7 Market condition

Chart on Market condition - Five forces 2025 and 2030

8. Market Segmentation by Source

8.1 Market segments

Chart on Source - Market share 2025-2030 (%)
Data Table on Source - Market share 2025-2030 (%)

8.2 Comparison by Source

Chart on Comparison by Source
Data Table on Comparison by Source

8.3 Plant source - Market size and forecast 2025-2030

Chart on Plant source - Market size and forecast 2025-2030 ($ thousand)
Data Table on Plant source - Market size and forecast 2025-2030 ($ thousand)
Chart on Plant source - Year-over-year growth 2025-2030 (%)
Data Table on Plant source - Year-over-year growth 2025-2030 (%)

8.4 Animal source - Market size and forecast 2025-2030

Chart on Animal source - Market size and forecast 2025-2030 ($ thousand)
Data Table on Animal source - Market size and forecast 2025-2030 ($ thousand)
Chart on Animal source - Year-over-year growth 2025-2030 (%)
Data Table on Animal source - Year-over-year growth 2025-2030 (%)

8.5 Market opportunity by Source

Market opportunity by Source ($ thousand)
Data Table on Market opportunity by Source ($ thousand)

9. Market Segmentation by Form Factor

9.1 Market segments

Chart on Form Factor - Market share 2025-2030 (%)
Data Table on Form Factor - Market share 2025-2030 (%)

9.2 Comparison by Form Factor

Chart on Comparison by Form Factor
Data Table on Comparison by Form Factor

9.3 Liquid - Market size and forecast 2025-2030

Chart on Liquid - Market size and forecast 2025-2030 ($ thousand)
Data Table on Liquid - Market size and forecast 2025-2030 ($ thousand)
Chart on Liquid - Year-over-year growth 2025-2030 (%)
Data Table on Liquid - Year-over-year growth 2025-2030 (%)

9.4 Powder - Market size and forecast 2025-2030

Chart on Powder - Market size and forecast 2025-2030 ($ thousand)
Data Table on Powder - Market size and forecast 2025-2030 ($ thousand)
Chart on Powder - Year-over-year growth 2025-2030 (%)
Data Table on Powder - Year-over-year growth 2025-2030 (%)

9.5 Capsule - Market size and forecast 2025-2030

Chart on Capsule - Market size and forecast 2025-2030 ($ thousand)
Data Table on Capsule - Market size and forecast 2025-2030 ($ thousand)
Chart on Capsule - Year-over-year growth 2025-2030 (%)
Data Table on Capsule - Year-over-year growth 2025-2030 (%)

9.6 Market opportunity by Form Factor

Market opportunity by Form Factor ($ thousand)
Data Table on Market opportunity by Form Factor ($ thousand)

10. Market Segmentation by Application

10.1 Market segments

Chart on Application - Market share 2025-2030 (%)
Data Table on Application - Market share 2025-2030 (%)

10.2 Comparison by Application

Chart on Comparison by Application
Data Table on Comparison by Application

10.3 Pharmaceuticals - Market size and forecast 2025-2030

Chart on Pharmaceuticals - Market size and forecast 2025-2030 ($ thousand)
Data Table on Pharmaceuticals - Market size and forecast 2025-2030 ($ thousand)
Chart on Pharmaceuticals - Year-over-year growth 2025-2030 (%)
Data Table on Pharmaceuticals - Year-over-year growth 2025-2030 (%)

10.4 Dietary supplements - Market size and forecast 2025-2030

Chart on Dietary supplements - Market size and forecast 2025-2030 ($ thousand)
Data Table on Dietary supplements - Market size and forecast 2025-2030 ($ thousand)
Chart on Dietary supplements - Year-over-year growth 2025-2030 (%)
Data Table on Dietary supplements - Year-over-year growth 2025-2030 (%)

10.5 Others - Market size and forecast 2025-2030

Chart on Others - Market size and forecast 2025-2030 ($ thousand)
Data Table on Others - Market size and forecast 2025-2030 ($ thousand)
Chart on Others - Year-over-year growth 2025-2030 (%)
Data Table on Others - Year-over-year growth 2025-2030 (%)

10.6 Market opportunity by Application

Market opportunity by Application ($ thousand)
Data Table on Market opportunity by Application ($ thousand)

11. Customer Landscape

11.1 Customer landscape overview

Analysis of price sensitivity, lifecycle, customer purchase basket, adoption rates, and purchase criteria

12. Geographic Landscape

12.1 Geographic segmentation

Chart on Market share by geography 2025-2030 (%)
Data Table on Market share by geography 2025-2030 (%)

12.2 Geographic comparison

Chart on Geographic comparison
Data Table on Geographic comparison

12.3 APAC - Market size and forecast 2025-2030

Chart on APAC - Market size and forecast 2025-2030 ($ thousand)
Data Table on APAC - Market size and forecast 2025-2030 ($ thousand)
Chart on APAC - Year-over-year growth 2025-2030 (%)
Data Table on APAC - Year-over-year growth 2025-2030 (%)
Chart on Regional Comparison - APAC
Data Table on Regional Comparison - APAC

12.3.1 China - Market size and forecast 2025-2030

Chart on China - Market size and forecast 2025-2030 ($ thousand)
Data Table on China - Market size and forecast 2025-2030 ($ thousand)
Chart on China - Year-over-year growth 2025-2030 (%)
Data Table on China - Year-over-year growth 2025-2030 (%)

12.3.2 Japan - Market size and forecast 2025-2030

Chart on Japan - Market size and forecast 2025-2030 ($ thousand)
Data Table on Japan - Market size and forecast 2025-2030 ($ thousand)
Chart on Japan - Year-over-year growth 2025-2030 (%)
Data Table on Japan - Year-over-year growth 2025-2030 (%)

12.3.3 India - Market size and forecast 2025-2030

Chart on India - Market size and forecast 2025-2030 ($ thousand)
Data Table on India - Market size and forecast 2025-2030 ($ thousand)
Chart on India - Year-over-year growth 2025-2030 (%)
Data Table on India - Year-over-year growth 2025-2030 (%)

12.3.4 South Korea - Market size and forecast 2025-2030

Chart on South Korea - Market size and forecast 2025-2030 ($ thousand)
Data Table on South Korea - Market size and forecast 2025-2030 ($ thousand)
Chart on South Korea - Year-over-year growth 2025-2030 (%)
Data Table on South Korea - Year-over-year growth 2025-2030 (%)

12.3.5 Australia - Market size and forecast 2025-2030

Chart on Australia - Market size and forecast 2025-2030 ($ thousand)
Data Table on Australia - Market size and forecast 2025-2030 ($ thousand)
Chart on Australia - Year-over-year growth 2025-2030 (%)
Data Table on Australia - Year-over-year growth 2025-2030 (%)

12.3.6 Indonesia - Market size and forecast 2025-2030

Chart on Indonesia - Market size and forecast 2025-2030 ($ thousand)
Data Table on Indonesia - Market size and forecast 2025-2030 ($ thousand)
Chart on Indonesia - Year-over-year growth 2025-2030 (%)
Data Table on Indonesia - Year-over-year growth 2025-2030 (%)

12.4 North America - Market size and forecast 2025-2030

Chart on North America - Market size and forecast 2025-2030 ($ thousand)
Data Table on North America - Market size and forecast 2025-2030 ($ thousand)
Chart on North America - Year-over-year growth 2025-2030 (%)
Data Table on North America - Year-over-year growth 2025-2030 (%)
Chart on Regional Comparison - North America
Data Table on Regional Comparison - North America

12.4.1 US - Market size and forecast 2025-2030

Chart on US - Market size and forecast 2025-2030 ($ thousand)
Data Table on US - Market size and forecast 2025-2030 ($ thousand)
Chart on US - Year-over-year growth 2025-2030 (%)
Data Table on US - Year-over-year growth 2025-2030 (%)

12.4.2 Canada - Market size and forecast 2025-2030

Chart on Canada - Market size and forecast 2025-2030 ($ thousand)
Data Table on Canada - Market size and forecast 2025-2030 ($ thousand)
Chart on Canada - Year-over-year growth 2025-2030 (%)
Data Table on Canada - Year-over-year growth 2025-2030 (%)

12.4.3 Mexico - Market size and forecast 2025-2030

Chart on Mexico - Market size and forecast 2025-2030 ($ thousand)
Data Table on Mexico - Market size and forecast 2025-2030 ($ thousand)
Chart on Mexico - Year-over-year growth 2025-2030 (%)
Data Table on Mexico - Year-over-year growth 2025-2030 (%)

12.5 Europe - Market size and forecast 2025-2030

Chart on Europe - Market size and forecast 2025-2030 ($ thousand)
Data Table on Europe - Market size and forecast 2025-2030 ($ thousand)
Chart on Europe - Year-over-year growth 2025-2030 (%)
Data Table on Europe - Year-over-year growth 2025-2030 (%)
Chart on Regional Comparison - Europe
Data Table on Regional Comparison - Europe

12.5.1 Germany - Market size and forecast 2025-2030

Chart on Germany - Market size and forecast 2025-2030 ($ thousand)
Data Table on Germany - Market size and forecast 2025-2030 ($ thousand)
Chart on Germany - Year-over-year growth 2025-2030 (%)
Data Table on Germany - Year-over-year growth 2025-2030 (%)

12.5.2 UK - Market size and forecast 2025-2030

Chart on UK - Market size and forecast 2025-2030 ($ thousand)
Data Table on UK - Market size and forecast 2025-2030 ($ thousand)
Chart on UK - Year-over-year growth 2025-2030 (%)
Data Table on UK - Year-over-year growth 2025-2030 (%)

12.5.3 France - Market size and forecast 2025-2030

Chart on France - Market size and forecast 2025-2030 ($ thousand)
Data Table on France - Market size and forecast 2025-2030 ($ thousand)
Chart on France - Year-over-year growth 2025-2030 (%)
Data Table on France - Year-over-year growth 2025-2030 (%)

12.5.4 Italy - Market size and forecast 2025-2030

Chart on Italy - Market size and forecast 2025-2030 ($ thousand)
Data Table on Italy - Market size and forecast 2025-2030 ($ thousand)
Chart on Italy - Year-over-year growth 2025-2030 (%)
Data Table on Italy - Year-over-year growth 2025-2030 (%)

12.5.5 Spain - Market size and forecast 2025-2030

Chart on Spain - Market size and forecast 2025-2030 ($ thousand)
Data Table on Spain - Market size and forecast 2025-2030 ($ thousand)
Chart on Spain - Year-over-year growth 2025-2030 (%)
Data Table on Spain - Year-over-year growth 2025-2030 (%)

12.5.6 The Netherlands - Market size and forecast 2025-2030

Chart on The Netherlands - Market size and forecast 2025-2030 ($ thousand)
Data Table on The Netherlands - Market size and forecast 2025-2030 ($ thousand)
Chart on The Netherlands - Year-over-year growth 2025-2030 (%)
Data Table on The Netherlands - Year-over-year growth 2025-2030 (%)

12.6 South America - Market size and forecast 2025-2030

Chart on South America - Market size and forecast 2025-2030 ($ thousand)
Data Table on South America - Market size and forecast 2025-2030 ($ thousand)
Chart on South America - Year-over-year growth 2025-2030 (%)
Data Table on South America - Year-over-year growth 2025-2030 (%)
Chart on Regional Comparison - South America
Data Table on Regional Comparison - South America

12.6.1 Brazil - Market size and forecast 2025-2030

Chart on Brazil - Market size and forecast 2025-2030 ($ thousand)
Data Table on Brazil - Market size and forecast 2025-2030 ($ thousand)
Chart on Brazil - Year-over-year growth 2025-2030 (%)
Data Table on Brazil - Year-over-year growth 2025-2030 (%)

12.6.2 Argentina - Market size and forecast 2025-2030

Chart on Argentina - Market size and forecast 2025-2030 ($ thousand)
Data Table on Argentina - Market size and forecast 2025-2030 ($ thousand)
Chart on Argentina - Year-over-year growth 2025-2030 (%)
Data Table on Argentina - Year-over-year growth 2025-2030 (%)

12.6.3 Chile - Market size and forecast 2025-2030

Chart on Chile - Market size and forecast 2025-2030 ($ thousand)
Data Table on Chile - Market size and forecast 2025-2030 ($ thousand)
Chart on Chile - Year-over-year growth 2025-2030 (%)
Data Table on Chile - Year-over-year growth 2025-2030 (%)

12.7 Middle East and Africa - Market size and forecast 2025-2030

Chart on Middle East and Africa - Market size and forecast 2025-2030 ($ thousand)
Data Table on Middle East and Africa - Market size and forecast 2025-2030 ($ thousand)
Chart on Middle East and Africa - Year-over-year growth 2025-2030 (%)
Data Table on Middle East and Africa - Year-over-year growth 2025-2030 (%)
Chart on Regional Comparison - Middle East and Africa
Data Table on Regional Comparison - Middle East and Africa

12.7.1 Saudi Arabia - Market size and forecast 2025-2030

Chart on Saudi Arabia - Market size and forecast 2025-2030 ($ thousand)
Data Table on Saudi Arabia - Market size and forecast 2025-2030 ($ thousand)
Chart on Saudi Arabia - Year-over-year growth 2025-2030 (%)
Data Table on Saudi Arabia - Year-over-year growth 2025-2030 (%)

12.7.2 UAE - Market size and forecast 2025-2030

Chart on UAE - Market size and forecast 2025-2030 ($ thousand)
Data Table on UAE - Market size and forecast 2025-2030 ($ thousand)
Chart on UAE - Year-over-year growth 2025-2030 (%)
Data Table on UAE - Year-over-year growth 2025-2030 (%)

12.7.3 South Africa - Market size and forecast 2025-2030

Chart on South Africa - Market size and forecast 2025-2030 ($ thousand)
Data Table on South Africa - Market size and forecast 2025-2030 ($ thousand)
Chart on South Africa - Year-over-year growth 2025-2030 (%)
Data Table on South Africa - Year-over-year growth 2025-2030 (%)

12.7.4 Israel - Market size and forecast 2025-2030

Chart on Israel - Market size and forecast 2025-2030 ($ thousand)
Data Table on Israel - Market size and forecast 2025-2030 ($ thousand)
Chart on Israel - Year-over-year growth 2025-2030 (%)
Data Table on Israel - Year-over-year growth 2025-2030 (%)

12.7.5 Turkey - Market size and forecast 2025-2030

Chart on Turkey - Market size and forecast 2025-2030 ($ thousand)
Data Table on Turkey - Market size and forecast 2025-2030 ($ thousand)
Chart on Turkey - Year-over-year growth 2025-2030 (%)
Data Table on Turkey - Year-over-year growth 2025-2030 (%)

12.8 Market opportunity by geography

Market opportunity by geography ($ thousand)
Data Tables on Market opportunity by geography ($ thousand)

13. Drivers, Challenges, and Opportunity

13.1 Market drivers

Escalating usage in premium infant formula
Surging demand for athletic performance supplements
Rising adoption in specialized clinical nutrition

13.2 Market challenges

High fermentation costs and extraction complexity
Strict regulatory standards across regional markets
Volatile substrate pricing and supply disruptions

13.3 Impact of drivers and challenges

Impact of drivers and challenges in 2025 and 2030

13.4 Market opportunities

Expanding integration in functional food products
Rising use in cosmeceutical skincare formulations
Emerging demand in aquaculture feed enrichment

14. Competitive Landscape

14.1 Overview

14.2

Overview on criticality of inputs and factors of differentiation

14.3 Landscape disruption

Overview on factors of disruption

14.4 Industry risks

Impact of key risks on business

15. Competitive Analysis

15.1 Companies profiled

Companies covered

15.2 Company ranking index

15.3 Market positioning of companies

Matrix on companies position and classification

15.4 BASF SE

BASF SE - Overview
BASF SE - Business segments
BASF SE - Key news
BASF SE - Key offerings
BASF SE - Segment focus
SWOT

15.5 Bio Techne Corp.

Bio Techne Corp. - Overview
Bio Techne Corp. - Business segments
Bio Techne Corp. - Key news
Bio Techne Corp. - Key offerings
Bio Techne Corp. - Segment focus
SWOT

15.6 CABIO Biotech Wuhan Co. Ltd

CABIO Biotech Wuhan Co. Ltd - Overview
CABIO Biotech Wuhan Co. Ltd - Product / Service
CABIO Biotech Wuhan Co. Ltd - Key offerings
SWOT

15.7 Cargill Inc.

Cargill Inc. - Overview
Cargill Inc. - Product / Service
Cargill Inc. - Key news
Cargill Inc. - Key offerings
SWOT

15.8 Cayman Chemical Co.

Cayman Chemical Co. - Overview
Cayman Chemical Co. - Product / Service
Cayman Chemical Co. - Key offerings
SWOT

15.9 Central Drug House Pvt. Ltd.

Central Drug House Pvt. Ltd. - Overview
Central Drug House Pvt. Ltd. - Product / Service
Central Drug House Pvt. Ltd. - Key offerings
SWOT

15.10 DSM Firmenich AG

DSM Firmenich AG - Overview
DSM Firmenich AG - Business segments
DSM Firmenich AG - Key offerings
DSM Firmenich AG - Segment focus
SWOT

15.11 HiMedia Laboratories Pvt. Ltd.

HiMedia Laboratories Pvt. Ltd. - Overview
HiMedia Laboratories Pvt. Ltd. - Product / Service
HiMedia Laboratories Pvt. Ltd. - Key offerings
SWOT

15.12 Merck KGaA

Merck KGaA - Overview
Merck KGaA - Business segments
Merck KGaA - Key news
Merck KGaA - Key offerings
Merck KGaA - Segment focus
SWOT

15.13 Nippon Suisan Kaisha Ltd.

Nippon Suisan Kaisha Ltd. - Overview
Nippon Suisan Kaisha Ltd. - Business segments
Nippon Suisan Kaisha Ltd. - Key offerings
Nippon Suisan Kaisha Ltd. - Segment focus
SWOT

15.14 Refine Healthy Biotech Co. Ltd.

Refine Healthy Biotech Co. Ltd. - Overview
Refine Healthy Biotech Co. Ltd. - Product / Service
Refine Healthy Biotech Co. Ltd. - Key offerings
SWOT

15.15 Simson Pharma Ltd.

Simson Pharma Ltd. - Overview
Simson Pharma Ltd. - Product / Service
Simson Pharma Ltd. - Key offerings
SWOT

15.16 Xiamen Kingdomway Group Co.

Xiamen Kingdomway Group Co. - Overview
Xiamen Kingdomway Group Co. - Business segments
Xiamen Kingdomway Group Co. - Key offerings
Xiamen Kingdomway Group Co. - Segment focus
SWOT

15.17 Xian Healthful Biotechnology

Xian Healthful Biotechnology - Overview
Xian Healthful Biotechnology - Product / Service
Xian Healthful Biotechnology - Key offerings
SWOT

15.18 Youcare Pharmaceutical Group

Youcare Pharmaceutical Group - Overview
Youcare Pharmaceutical Group - Product / Service
Youcare Pharmaceutical Group - Key offerings
SWOT

16. Appendix

16.1 Scope of the report

Market definition
Objectives
Notes and caveats

16.2 Inclusions and exclusions checklist

Inclusions checklist
Exclusions checklist

16.3 Currency conversion rates for US$

16.4 Research methodology

16.5 Data procurement

Information sources

16.6 Data validation

16.7 Validation techniques employed for market sizing

16.8 Data synthesis

16.9 360 degree market analysis

16.10 List of abbreviations

Research Methodology

Technavio presents a detailed picture of the market by way of study, synthesis, and summation of data from multiple sources. The analysts have presented the various facets of the market with a particular focus on identifying the key industry influencers. The data thus presented is comprehensive, reliable, and the result of extensive research, both primary and secondary.

INFORMATION SOURCES

Primary sources

  • Manufacturers and suppliers
  • Channel partners
  • Industry experts
  • Strategic decision makers

Secondary sources

  • Industry journals and periodicals
  • Government data
  • Financial reports of key industry players
  • Historical data
  • Press releases

DATA ANALYSIS

Data Synthesis

  • Collation of data
  • Estimation of key figures
  • Analysis of derived insights

Data Validation

  • Triangulation with data models
  • Reference against proprietary databases
  • Corroboration with industry experts

REPORT WRITING

Qualitative

  • Market drivers
  • Market challenges
  • Market trends
  • Five forces analysis

Quantitative

  • Market size and forecast
  • Market segmentation
  • Geographical insights
  • Competitive landscape

Interested in this report?

Get your sample now to see our research methodology and insights!

Download Now

Frequently Asked Questions

Arachidonic Acid market growth will increase by USD 215661.9 thousand thousand during 2026-2030.

The Arachidonic Acid market is expected to grow at a CAGR of 9.1% during 2026-2030.

Arachidonic Acid market is segmented by Source (Plant source, Animal source) Form factor (Liquid, Powder, Capsule) Application (Pharmaceuticals, Dietary supplements, Others)

BASF SE, Bio Techne Corp., CABIO Biotech Wuhan Co. Ltd, Cargill Inc., Cayman Chemical Co., Central Drug House Pvt. Ltd., DSM Firmenich AG, HiMedia Laboratories Pvt. Ltd., Merck KGaA, Nippon Suisan Kaisha Ltd., Otto Chemie Pvt. Ltd., Refine Healthy Biotech Co. Ltd., Runke Biotechnology, Simson Pharma Ltd., Tokyo Chemical Industry Co., Wuhan Casov Biotechnology Co., Xiamen Kingdomway Group Co., Xian Healthful Biotechnology, Youcare Pharmaceutical Group are a few of the key vendors in the Arachidonic Acid market.

APAC will register the highest growth rate of 47.8% among the other regions. Therefore, the Arachidonic Acid market in APAC is expected to garner significant business opportunities for the vendors during the forecast period.

China, Japan, India, South Korea, Australia, Indonesia, US, Canada, Mexico, Germany, UK, France, Italy, Spain, The Netherlands, Brazil, Argentina, Chile, Saudi Arabia, UAE, South Africa, Israel, Turkey

  • Escalating usage in premium infant formula is the driving factor this market.

The Arachidonic Acid market vendors should focus on grabbing business opportunities from the Source segment as it accounted for the largest market share in the base year.
RIA - Research AI Assistant
Ask RIA
