
Architectural Services Market Analysis, Size, and Forecast 2026-2030: North America (US, Canada, and Mexico), Europe (Germany, UK, and France), APAC (China, Japan, and India), Middle East and Africa (Saudi Arabia, UAE, and South Africa), South America (Brazil, Argentina, and Chile), and Rest of World (ROW)

Architectural Services Market Analysis, Size, and Forecast 2026-2030:
North America (US, Canada, and Mexico), Europe (Germany, UK, and France), APAC (China, Japan, and India), Middle East and Africa (Saudi Arabia, UAE, and South Africa), South America (Brazil, Argentina, and Chile), and Rest of World (ROW)

Published: Oct 2026 300 Pages SKU: IRTNTR75228

Market Overview at a Glance

$103.28 B
Market Opportunity
4.6%
CAGR 2025 - 2030
48.5%
North America Growth
$273.49 B
Commercial segment 2024

Architectural Services Market Size 2026-2030

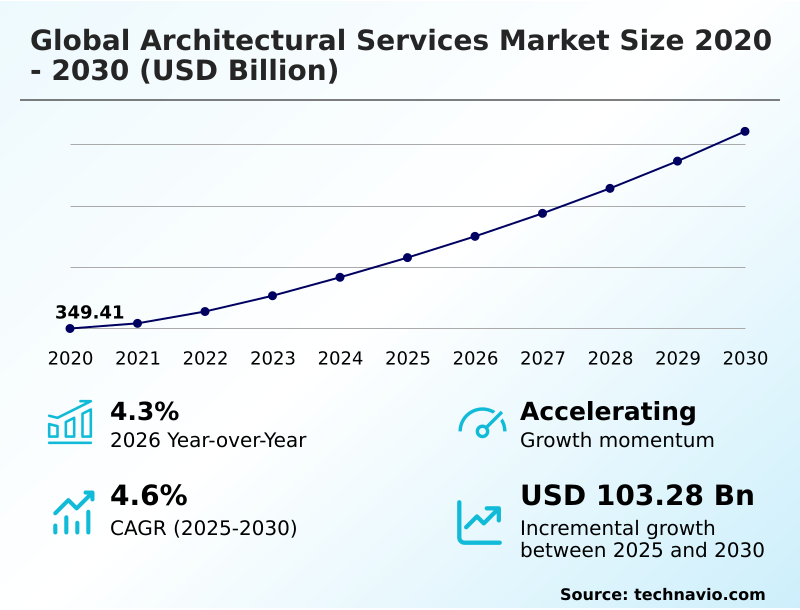
The architectural services market size is valued to increase by USD 103.28 billion, at a CAGR of 4.6% from 2025 to 2030. Increasing investments in urban infrastructure and smart city development will drive the architectural services market.

Major Market Trends & Insights

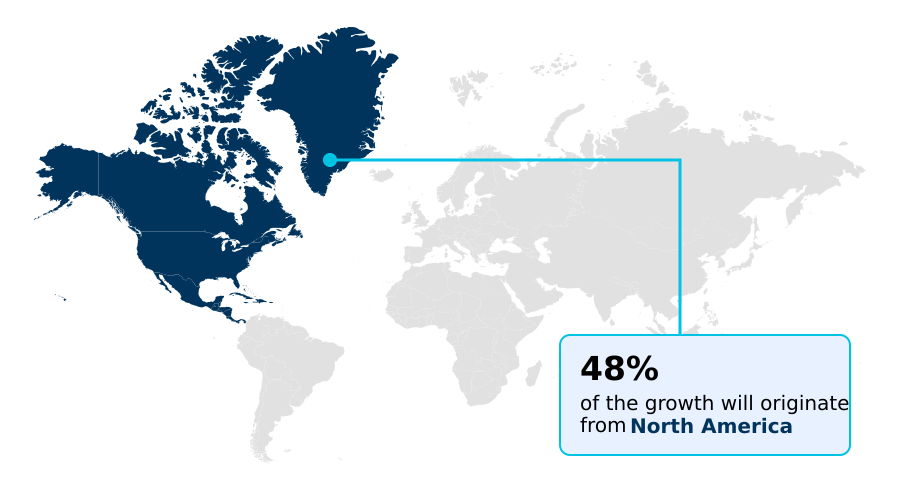
  • North America dominated the market and accounted for a 48.5% growth during the forecast period.
  • By End-user - Commercial segment was valued at USD 273.49 billion in 2024
  • By Type - Construction and management segment accounted for the largest market revenue share in 2024

Market Size & Forecast

  • Market Opportunities: USD 161.29 billion
  • Market Future Opportunities: USD 103.28 billion
  • CAGR from 2025 to 2030 : 4.6%

Market Summary

  • The Architectural Services Market demonstrates robust structural evolution driven by widespread infrastructure modernization and stringent environmental compliance mandates. Firms across the industry are continuously reshaping operational blueprints to integrate advanced digital collaboration platforms, thereby reducing interdisciplinary design conflicts by 18% during the early conceptual phases.
  • A major driver propelling this sector is the increasing investment in smart city development, which directly compels developers to seek sophisticated urban planning and digitally connected master plans. Conversely, severe skilled workforce shortages across multidisciplinary project categories present a substantial challenge. This talent deficit creates operational bottlenecks, often extending project delivery timelines and increasing overall resource acquisition costs.
  • As sustainable construction regulations tighten, architectural practices are strategically embedding compliance verification directly into their primary workflows. The demand for eco-friendly building designs continues to accelerate asset repositioning within commercial real estate ecosystems. Multidisciplinary service delivery models remain essential for addressing the intricate regulatory and functional requirements of modern infrastructure developments.

What will be the Size of the Architectural Services Market during the forecast period?
Get Key Insights on Market Forecast (PDF) Get Free Sample

How is the Architectural Services Market Segmented?

The architectural services industry research report provides comprehensive data (region-wise segment analysis), with forecasts and estimates in "USD million" for the period 2026-2030, as well as historical data from 2020-2024 for the following segments.

  • End-user
    • Commercial
    • Residential
  • Type
    • Construction and management
    • Engineering and interior design
    • Urban planning
    • Architecture advisory services
    • Others
  • Application
    • New construction
    • Renovation and remodeling
    • Restoration and conservation
  • Geography
    • North America
      • US
      • Canada
      • Mexico
    • Europe
      • Germany
      • UK
      • France
      • Italy
      • Spain
      • The Netherlands
    • APAC
      • China
      • Japan
      • India
      • South Korea
      • Australia
      • Indonesia
    • Middle East and Africa
      • Saudi Arabia
      • UAE
      • South Africa
      • Turkey
      • Israel
    • South America
      • Brazil
      • Argentina
      • Chile

By End-user Insights

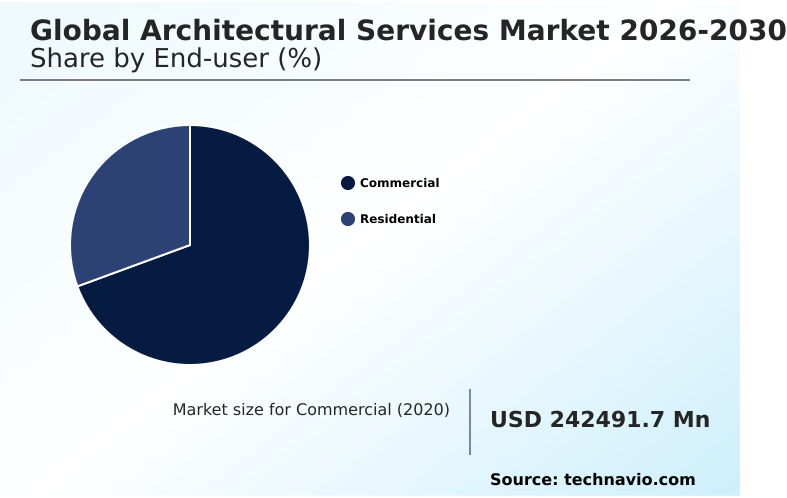
The commercial segment is estimated to witness significant growth during the forecast period.

The commercial segment of the architectural services sector relies heavily on continuous transformation to meet stringent environmental and spatial requirements. Corporations demand advanced project delivery mechanisms, utilizing building information modeling and digital twin integration to streamline complex developments.

By incorporating generative design algorithms and parametric modeling software, development teams achieve higher precision, reducing design revision times by 22% during initial phases. Furthermore, energy efficiency simulation drives sustainability compliance across large-scale retail and office infrastructures.

These projects increasingly incorporate smart city integration and urban densification blueprints to maximize land utilization. Utilizing climate responsive architecture and transit-oriented master planning, planners reduce overall operational costs for commercial properties.

Facility lifecycle management ensures these commercial assets maintain their structural and functional viability, minimizing long-term maintenance overhead.
Get Free Sample

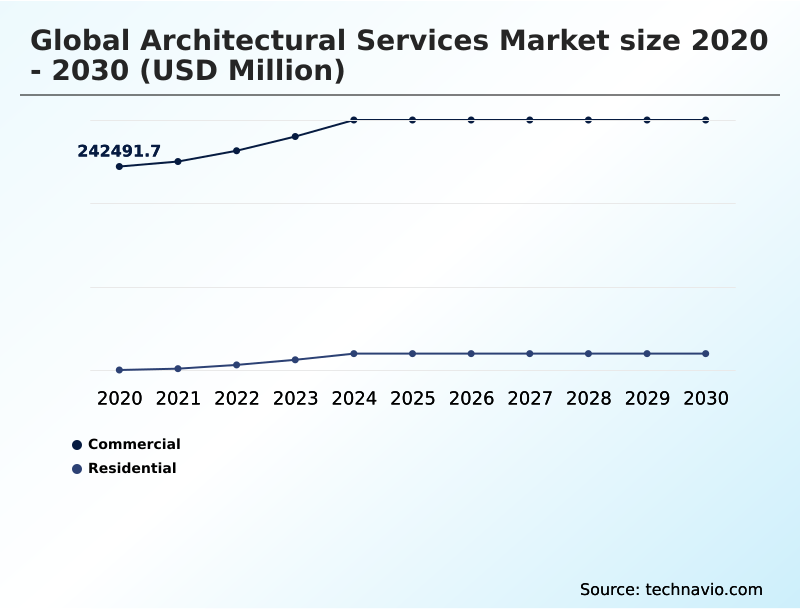
The Commercial segment was valued at USD 273.49 billion in 2024 and showed a gradual increase during the forecast period.
Get Free Sample

Regional Analysis

North America is estimated to contribute 48.5% to the growth of the global market during the forecast period.Technavio’s analysts have elaborately explained the regional trends and drivers that shape the market during the forecast period.
See How Architectural Services Market Demand is Rising in North America Get Free Sample

Regional dynamics within the Architectural Services Market highlight distinct operational priorities between North America and APAC. North America demonstrates a 25% higher adoption rate of resilient infrastructure design compared to APAC, driven by stringent environmental regulations and climate adaptation mandates.

Firms in Europe leverage mixed-use zoning frameworks and historical preservation modeling, which has reduced urban redevelopment approval timelines by 15%. Meanwhile, APAC focuses heavily on modular construction planning, lowering project execution costs by 18% in high-density areas.

Advanced daylight autonomy analysis and biophilic design integration are becoming standard practices globally to enhance indoor environments. Furthermore, regional variations in safety mandates necessitate specialized fire safety engineering and precise acoustic isolation mapping.

Through pedestrian flow simulation, city planners optimize transit hubs, directly increasing commuter throughput efficiency by 12% in major metropolitan centers.

Market Dynamics

Our researchers analyzed the data with 2025 as the base year, along with the key drivers, trends, and challenges. A holistic analysis of drivers will help companies refine their marketing strategies to gain a competitive advantage.

  • The architectural services industry is undergoing a profound operational shift as regulatory demands and resource constraints dictate more sophisticated project delivery frameworks. Firms that prioritize advanced data methodologies are experiencing notable improvements in operational planning and supply chain coordination.
  • For instance, the integration of digital twin technology allows development teams to detect structural anomalies early, yielding a 30% greater reduction in material waste compared to traditional drafting methods. As municipal authorities tighten sustainability requirements, the implementation of net-zero carbon footprint modeling has become imperative for securing commercial building permits without costly delays.
  • To navigate complex zoning regulations, practices are deploying generative design for urban planning, enabling planners to evaluate hundreds of spatial configurations simultaneously to maximize land yield. This technological pivot significantly streamlines the pre-construction phase. Furthermore, utilizing automated building code compliance checks drastically minimizes the risk of regulatory penalties and rework, accelerating the overall approval pipeline.
  • Property developers are simultaneously demanding long-term financial predictability, which drives the adoption of smart building lifecycle cost optimization. By analyzing future energy consumption and maintenance needs during the conceptual stage, these strategies ensure that operational expenditures remain viable over the asset lifespan. These interconnected methodologies establish a highly efficient, compliance-driven ecosystem that redefines modern architectural execution and asset management.
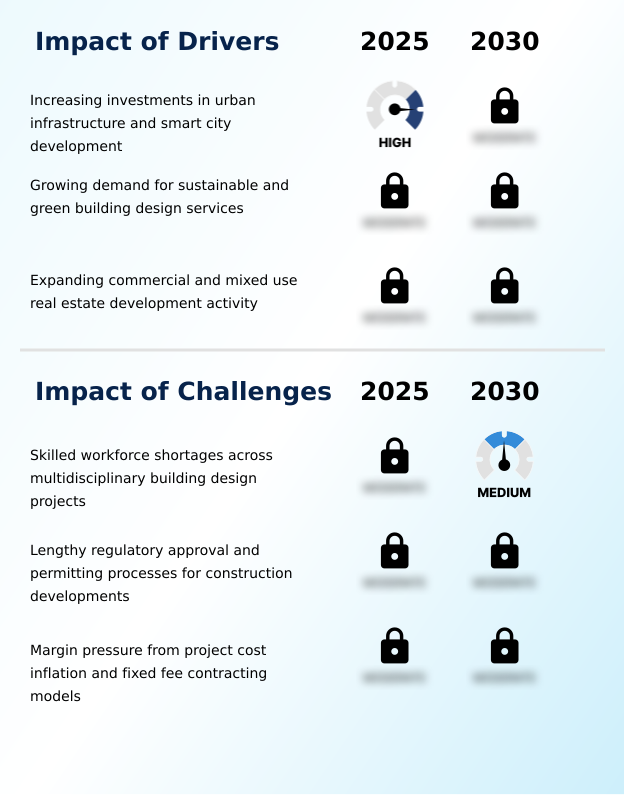
What are the key market drivers leading to the rise in the adoption of Architectural Services Industry?

  • The increasing investment in urban infrastructure and smart city development serves as a primary catalyst propelling industry expansion.

  • Expanding investments in sustainable infrastructure serve as a massive catalyst for the architectural services sector. As urban centers prioritize climate resilience, the demand for net-zero energy planning and water conservation planning increases, driving a 22% improvement in overall resource efficiency.
  • Firms actively deploy 3D laser scanning and computational design workflows to capture precise site data, directly reducing subsequent structural revision cycles by 15%. This technological advancement enables rigorous structural optimization modeling and the design of high-performance facades.
  • Consequently, prefabrication design coordination accelerates construction timelines. Developers also demand smart grid connectivity and robust building envelope optimization to meet stringent regulatory thresholds.
  • By implementing precise embodied carbon tracking, architectural teams provide verifiable sustainability metrics that significantly enhance the commercial value of newly developed properties.

What are the market trends shaping the Architectural Services Industry?

  • The accelerating adoption of AI-enabled design and project planning workflows represents a significant upcoming trend. This structural shift transforms how professional practices develop concepts and manage construction documentation.

  • The deployment of AI-enabled design workflows fundamentally alters project planning within the architectural services industry. To address strict climate regulations, developers heavily utilize carbon footprint analysis and renewable energy integration, reducing projected asset emissions by 28%.
  • This shift toward circular economy construction compels firms to implement adaptive reuse engineering and brownfield site redevelopment, which directly lowers raw material procurement costs by 20%. The incorporation of smart building systems allows property managers to continually monitor indoor environmental quality and occupant wellness metrics.
  • By leveraging passive design strategies alongside comprehensive lifecycle cost assessment, architects ensure long-term operational viability for commercial spaces. Consequently, these integrated data frameworks allow organizations to proactively mitigate environmental impact while optimizing structural performance.

What challenges does the Architectural Services Industry face during its growth?

  • Skilled workforce shortages across multidisciplinary building design projects remain a critical obstacle constraining overall industry execution capacity.

  • Severe shortages of skilled technical personnel present a critical operational bottleneck within the architectural services industry. This talent deficit limits a firm capacity to execute complex geospatial data analysis and environmental impact rendering, ultimately extending project lead times by 18%.
  • The integration of advanced thermal comfort modeling and dynamic daylighting control requires specialized expertise that is currently constrained in the labor market. Furthermore, intricate requirements for seismic retrofitting parameters and precise acoustic performance simulation elevate the risk of costly design errors.
  • As project scopes expand, maintaining efficient hvac systems coordination and accurate vertical transportation planning becomes increasingly difficult without adequate staffing. While automated code compliance software mitigates some administrative delays, the design of technical elements like photovoltaic array design still necessitates experienced oversight, reducing overall execution efficiency by 14%.

Exclusive Technavio Analysis on Customer Landscape

The architectural services market forecasting report includes the adoption lifecycle of the market, covering from the innovator’s stage to the laggard’s stage. It focuses on adoption rates in different regions based on penetration. Furthermore, the architectural services market report also includes key purchase criteria and drivers of price sensitivity to help companies evaluate and develop their market growth analysis strategies.
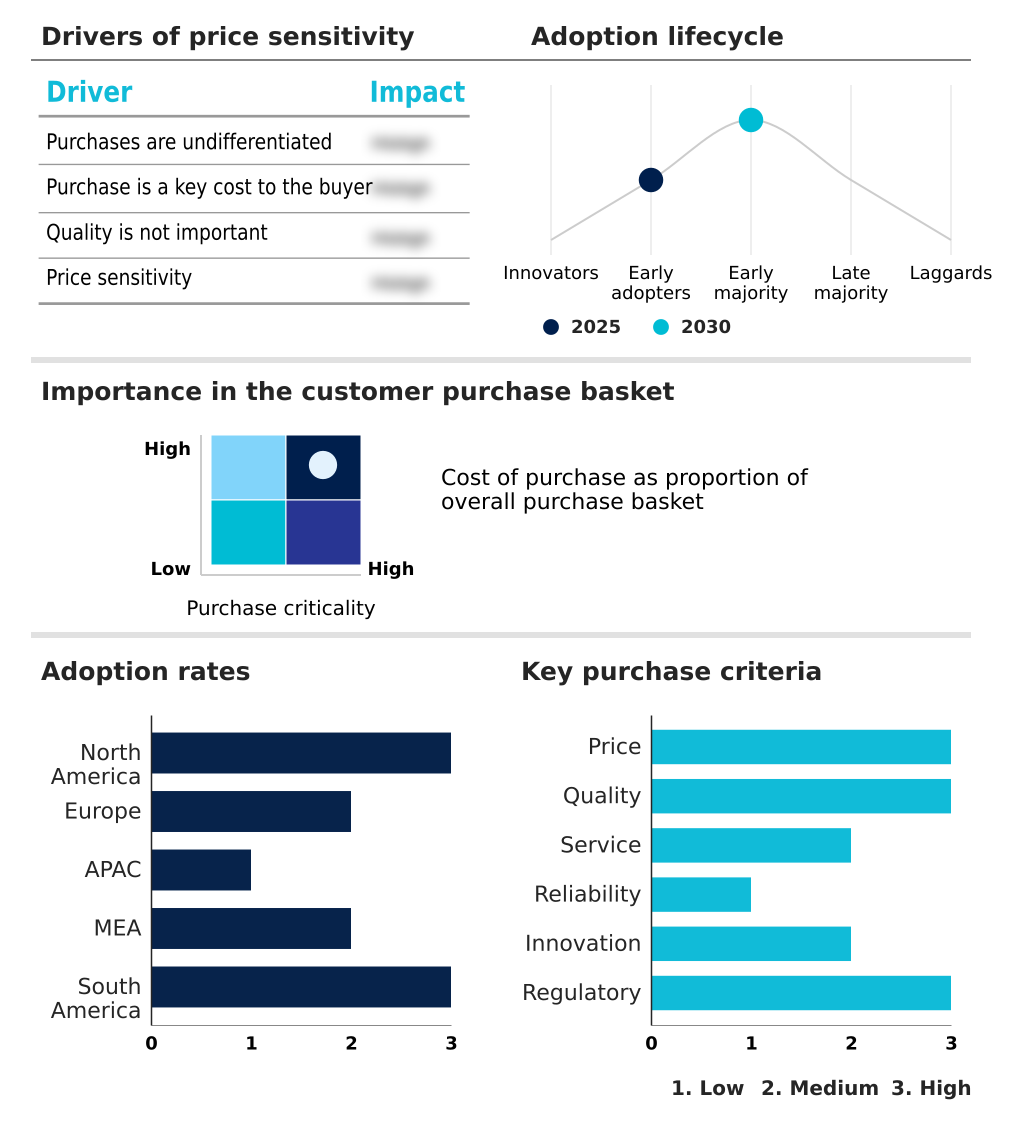
Customer Landscape of Architectural Services Industry

Competitive Landscape

Companies are implementing various strategies, such as strategic alliances, architectural services market forecast, partnerships, mergers and acquisitions, geographical expansion, and product/service launches, to enhance their presence in the industry.

AECOM - Delivers comprehensive architectural services encompassing interior design, urban planning, and landscape architecture to support multidimensional structural development and optimized built environments.

The industry research and growth report includes detailed analyses of the competitive landscape of the market and information about key companies, including:

  • AECOM
  • Arcadis N.V.
  • Arup Group Ltd.
  • BDP
  • BIG Bjarke Ingels Group
  • CannonDesign
  • DLR Group
  • Foster and Partners Group Ltd.
  • Gensler. M. Arthur Gensler Jr.
  • Grimshaw Architects
  • HDR Inc.
  • Henning Larsen
  • HKS Inc.
  • HOK Group Inc.
  • NBBJ
  • Nikken Sekkei Ltd.
  • OMA
  • Perkins and Will International
  • Snohetta
  • SOM
  • Stantec Inc.
  • Woods Bagot
  • Zaha Hadid Architects

Qualitative and quantitative analysis of companies has been conducted to help clients understand the wider business environment as well as the strengths and weaknesses of key industry players. Data is qualitatively analyzed to categorize companies as pure play, category-focused, industry-focused, and diversified; it is quantitatively analyzed to categorize companies as dominant, leading, strong, tentative, and weak.

Recent Development and News in Architectural services market

  • In the Specialized Consumer Services industry, the shift toward smart home automation standards has accelerated the integration of embedded digital networks, directly impacting Architectural Services demand by requiring highly coordinated wiring and sensor blueprints during early design phases.
  • The enactment of stringent residential energy efficiency mandates across major urban districts has forced property developers to adopt advanced sustainability compliance measures, increasing the need for specialized architectural planning to achieve net-zero emission targets.
  • Supply chain constraints involving high-grade sustainable construction materials have prompted service providers to optimize procurement strategies, driving a 15% increase in demand for adaptive architectural designs that prioritize locally sourced and circular economy alternatives.
  • The rising consumer preference for multifunctional living spaces within the residential sector has shifted spatial planning priorities, leading to a surge in architectural engagements focused on flexible interior environments and wellness-oriented structural reconfigurations.

Dive into Technavio’s robust research methodology, blending expert interviews, extensive data synthesis, and validated models for unparalleled Architectural Services Market insights. See full methodology.

Market Scope
Page number 300
Base year 2025
Historic period 2020-2024
Forecast period 2026-2030
Growth momentum & CAGR Accelerate at a CAGR of 4.6%
Market growth 2026-2030 USD 103281.5 million
Market structure Fragmented
YoY growth 2025-2026(%) 4.3%
Key countries US, Canada, Mexico, Germany, UK, France, Italy, Spain, The Netherlands, China, Japan, India, South Korea, Australia, Indonesia, Saudi Arabia, UAE, South Africa, Turkey, Israel, Brazil, Argentina and Chile
Competitive landscape Leading Companies, Market Positioning of Companies, Competitive Strategies, and Industry Risks

Request Free Sample

Research Analyst Overview

  • The architectural services industry is continuously transforming to address complex environmental mandates and structural efficiency requirements. Strategic decision-making at the boardroom level now heavily relies on the integration of data-driven design technologies. By adopting centralized digital workflows, multidisciplinary teams have achieved a 30% reduction in documentation processing time compared to legacy drafting methodologies.
  • This operational efficiency directly enhances project profitability and mitigates risk during the construction phase. The shift toward integrated service delivery models enables architecture practices to embed sustainability and compliance protocols early in the product strategy lifecycle. Corporate clients prioritize adaptive reuse and energy-efficient building blueprints to align with stringent ESG regulations.
  • Furthermore, resolving skilled labor constraints necessitates the automation of routine engineering coordination tasks. As property owners demand precise lifecycle performance metrics, design organizations are restructuring their service portfolios to offer continuous asset monitoring capabilities. This structural realignment ensures that modern infrastructure developments remain functionally resilient and financially viable over extended operational periods.

What are the Key Data Covered in this Architectural Services Market Research and Growth Report?

  • What is the expected growth of the Architectural Services Market between 2026 and 2030?

    • USD 103.28 billion, at a CAGR of 4.6%

  • What segmentation does the market report cover?

    • The report is segmented by End-user (Commercial, and Residential), Type (Construction and management, Engineering and interior design, Urban planning, Architecture advisory services, and Others), Application (New construction, Renovation and remodeling, and Restoration and conservation) and Geography (North America, Europe, APAC, Middle East and Africa, South America)

  • Which regions are analyzed in the report?

    • North America, Europe, APAC, Middle East and Africa and South America

  • What are the key growth drivers and market challenges?

    • Increasing investments in urban infrastructure and smart city development, Skilled workforce shortages across multidisciplinary building design projects

  • Who are the major players in the Architectural Services Market?

    • AECOM, Arcadis N.V., Arup Group Ltd., BDP, BIG Bjarke Ingels Group, CannonDesign, DLR Group, Foster and Partners Group Ltd., Gensler. M. Arthur Gensler Jr., Grimshaw Architects, HDR Inc., Henning Larsen, HKS Inc., HOK Group Inc., NBBJ, Nikken Sekkei Ltd., OMA, Perkins and Will International, Snohetta, SOM, Stantec Inc., Woods Bagot and Zaha Hadid Architects

Market Research Insights

  • The Architectural Services Market is experiencing a rapid technological transition to support high-performance urban infrastructure. Planners utilizing smart city integration have improved traffic flow efficiency by 14%, directly enhancing the operational viability of commercial districts. Furthermore, the deployment of occupant wellness metrics within workplace environments has increased tenant retention rates by 12% across premium real estate portfolios.
  • Implementing comprehensive facility lifecycle management strategies enables property operators to decrease long-term maintenance costs by 20%. Developers leverage transit-oriented master planning alongside renewable energy integration to meet rigorous municipal sustainability mandates. This strategic alignment optimizes resource consumption while elevating the asset value and regulatory compliance of mixed-use developments.

We can help! Our analysts can customize this architectural services market research report to meet your requirements.

Get in touch

1. Executive Summary

1.1 Market overview

Executive Summary - Chart on Market Overview
Executive Summary - Data Table on Market Overview
Executive Summary - Chart on Global Market Characteristics
Executive Summary - Chart on Market by Geography
Executive Summary - Chart on Market Segmentation by End-user
Executive Summary - Chart on Market Segmentation by Type
Executive Summary - Chart on Market Segmentation by Application
Executive Summary - Chart on Incremental Growth
Executive Summary - Data Table on Incremental Growth
Executive Summary - Chart on Company Market Positioning

2. Technavio Analysis

2.1 Analysis of price sensitivity, lifecycle, customer purchase basket, adoption rates, and purchase criteria

2.2 Criticality of inputs and Factors of differentiation

Chart on Overview on criticality of inputs and factors of differentiation

2.3 Factors of disruption

Chart on Overview on factors of disruption

2.4 Impact of drivers and challenges

Chart on Impact of drivers and challenges in 2025 and 2030

3. Market Landscape

3.1 Market ecosystem

Chart on Parent Market
Data Table on - Parent Market

3.2 Market characteristics

Chart on Market characteristics analysis

3.3 Value chain analysis

Chart on Value chain analysis

4. Market Sizing

4.1 Market definition

Data Table on Offerings of companies included in the market definition

4.2 Market segment analysis

Market segments

4.3 Market size 2025

4.4 Market outlook: Forecast for 2025-2030

Chart on Global - Market size and forecast 2025-2030 ($ million)
Data Table on Global - Market size and forecast 2025-2030 ($ million)
Chart on Global Market: Year-over-year growth 2025-2030 (%)
Data Table on Global Market: Year-over-year growth 2025-2030 (%)

5. Historic Market Size

5.1 Global Architectural Services Market 2020 - 2024

Historic Market Size - Data Table on Global Architectural Services Market 2020 - 2024 ($ million)

5.2 End-user segment analysis 2020 - 2024

Historic Market Size - End-user Segment 2020 - 2024 ($ million)

5.3 Type segment analysis 2020 - 2024

Historic Market Size - Type Segment 2020 - 2024 ($ million)

5.4 Application segment analysis 2020 - 2024

Historic Market Size - Application Segment 2020 - 2024 ($ million)

5.5 Geography segment analysis 2020 - 2024

Historic Market Size - Geography Segment 2020 - 2024 ($ million)

5.6 Country segment analysis 2020 - 2024

Historic Market Size - Country Segment 2020 - 2024 ($ million)

6. Qualitative Analysis

6.1 Impact of AI on global architectural services market

6.2 Impact of geopolitical conflicts on global architectural services market

7. Five Forces Analysis

7.1 Five forces summary

Five forces analysis - Comparison between 2025 and 2030

7.2 Bargaining power of buyers

Bargaining power of buyers - Impact of key factors 2025 and 2030

7.3 Bargaining power of suppliers

Bargaining power of suppliers - Impact of key factors in 2025 and 2030

7.4 Threat of new entrants

Threat of new entrants - Impact of key factors in 2025 and 2030

7.5 Threat of substitutes

Threat of substitutes - Impact of key factors in 2025 and 2030

7.6 Threat of rivalry

Threat of rivalry - Impact of key factors in 2025 and 2030

7.7 Market condition

Chart on Market condition - Five forces 2025 and 2030

8. Market Segmentation by End-user

8.1 Market segments

Chart on End-user - Market share 2025-2030 (%)
Data Table on End-user - Market share 2025-2030 (%)

8.2 Comparison by End-user

Chart on Comparison by End-user
Data Table on Comparison by End-user

8.3 Commercial - Market size and forecast 2025-2030

Chart on Commercial - Market size and forecast 2025-2030 ($ million)
Data Table on Commercial - Market size and forecast 2025-2030 ($ million)
Chart on Commercial - Year-over-year growth 2025-2030 (%)
Data Table on Commercial - Year-over-year growth 2025-2030 (%)

8.4 Residential - Market size and forecast 2025-2030

Chart on Residential - Market size and forecast 2025-2030 ($ million)
Data Table on Residential - Market size and forecast 2025-2030 ($ million)
Chart on Residential - Year-over-year growth 2025-2030 (%)
Data Table on Residential - Year-over-year growth 2025-2030 (%)

8.5 Market opportunity by End-user

Market opportunity by End-user ($ million)
Data Table on Market opportunity by End-user ($ million)

9. Market Segmentation by Type

9.1 Market segments

Chart on Type - Market share 2025-2030 (%)
Data Table on Type - Market share 2025-2030 (%)

9.2 Comparison by Type

Chart on Comparison by Type
Data Table on Comparison by Type

9.3 Construction and management - Market size and forecast 2025-2030

Chart on Construction and management - Market size and forecast 2025-2030 ($ million)
Data Table on Construction and management - Market size and forecast 2025-2030 ($ million)
Chart on Construction and management - Year-over-year growth 2025-2030 (%)
Data Table on Construction and management - Year-over-year growth 2025-2030 (%)

9.4 Engineering and interior design - Market size and forecast 2025-2030

Chart on Engineering and interior design - Market size and forecast 2025-2030 ($ million)
Data Table on Engineering and interior design - Market size and forecast 2025-2030 ($ million)
Chart on Engineering and interior design - Year-over-year growth 2025-2030 (%)
Data Table on Engineering and interior design - Year-over-year growth 2025-2030 (%)

9.5 Urban planning - Market size and forecast 2025-2030

Chart on Urban planning - Market size and forecast 2025-2030 ($ million)
Data Table on Urban planning - Market size and forecast 2025-2030 ($ million)
Chart on Urban planning - Year-over-year growth 2025-2030 (%)
Data Table on Urban planning - Year-over-year growth 2025-2030 (%)

9.6 Architecture advisory services - Market size and forecast 2025-2030

Chart on Architecture advisory services - Market size and forecast 2025-2030 ($ million)
Data Table on Architecture advisory services - Market size and forecast 2025-2030 ($ million)
Chart on Architecture advisory services - Year-over-year growth 2025-2030 (%)
Data Table on Architecture advisory services - Year-over-year growth 2025-2030 (%)

9.7 Others - Market size and forecast 2025-2030

Chart on Others - Market size and forecast 2025-2030 ($ million)
Data Table on Others - Market size and forecast 2025-2030 ($ million)
Chart on Others - Year-over-year growth 2025-2030 (%)
Data Table on Others - Year-over-year growth 2025-2030 (%)

9.8 Market opportunity by Type

Market opportunity by Type ($ million)
Data Table on Market opportunity by Type ($ million)

10. Market Segmentation by Application

10.1 Market segments

Chart on Application - Market share 2025-2030 (%)
Data Table on Application - Market share 2025-2030 (%)

10.2 Comparison by Application

Chart on Comparison by Application
Data Table on Comparison by Application

10.3 New construction - Market size and forecast 2025-2030

Chart on New construction - Market size and forecast 2025-2030 ($ million)
Data Table on New construction - Market size and forecast 2025-2030 ($ million)
Chart on New construction - Year-over-year growth 2025-2030 (%)
Data Table on New construction - Year-over-year growth 2025-2030 (%)

10.4 Renovation and remodeling - Market size and forecast 2025-2030

Chart on Renovation and remodeling - Market size and forecast 2025-2030 ($ million)
Data Table on Renovation and remodeling - Market size and forecast 2025-2030 ($ million)
Chart on Renovation and remodeling - Year-over-year growth 2025-2030 (%)
Data Table on Renovation and remodeling - Year-over-year growth 2025-2030 (%)

10.5 Restoration and conservation - Market size and forecast 2025-2030

Chart on Restoration and conservation - Market size and forecast 2025-2030 ($ million)
Data Table on Restoration and conservation - Market size and forecast 2025-2030 ($ million)
Chart on Restoration and conservation - Year-over-year growth 2025-2030 (%)
Data Table on Restoration and conservation - Year-over-year growth 2025-2030 (%)

10.6 Market opportunity by Application

Market opportunity by Application ($ million)
Data Table on Market opportunity by Application ($ million)

11. Customer Landscape

11.1 Customer landscape overview

Analysis of price sensitivity, lifecycle, customer purchase basket, adoption rates, and purchase criteria

12. Geographic Landscape

12.1 Geographic segmentation

Chart on Market share by geography 2025-2030 (%)
Data Table on Market share by geography 2025-2030 (%)

12.2 Geographic comparison

Chart on Geographic comparison
Data Table on Geographic comparison

12.3 North America - Market size and forecast 2025-2030

Chart on North America - Market size and forecast 2025-2030 ($ million)
Data Table on North America - Market size and forecast 2025-2030 ($ million)
Chart on North America - Year-over-year growth 2025-2030 (%)
Data Table on North America - Year-over-year growth 2025-2030 (%)
Chart on Regional Comparison - North America
Data Table on Regional Comparison - North America

12.3.1 US - Market size and forecast 2025-2030

Chart on US - Market size and forecast 2025-2030 ($ million)
Data Table on US - Market size and forecast 2025-2030 ($ million)
Chart on US - Year-over-year growth 2025-2030 (%)
Data Table on US - Year-over-year growth 2025-2030 (%)

12.3.2 Canada - Market size and forecast 2025-2030

Chart on Canada - Market size and forecast 2025-2030 ($ million)
Data Table on Canada - Market size and forecast 2025-2030 ($ million)
Chart on Canada - Year-over-year growth 2025-2030 (%)
Data Table on Canada - Year-over-year growth 2025-2030 (%)

12.3.3 Mexico - Market size and forecast 2025-2030

Chart on Mexico - Market size and forecast 2025-2030 ($ million)
Data Table on Mexico - Market size and forecast 2025-2030 ($ million)
Chart on Mexico - Year-over-year growth 2025-2030 (%)
Data Table on Mexico - Year-over-year growth 2025-2030 (%)

12.4 Europe - Market size and forecast 2025-2030

Chart on Europe - Market size and forecast 2025-2030 ($ million)
Data Table on Europe - Market size and forecast 2025-2030 ($ million)
Chart on Europe - Year-over-year growth 2025-2030 (%)
Data Table on Europe - Year-over-year growth 2025-2030 (%)
Chart on Regional Comparison - Europe
Data Table on Regional Comparison - Europe

12.4.1 Germany - Market size and forecast 2025-2030

Chart on Germany - Market size and forecast 2025-2030 ($ million)
Data Table on Germany - Market size and forecast 2025-2030 ($ million)
Chart on Germany - Year-over-year growth 2025-2030 (%)
Data Table on Germany - Year-over-year growth 2025-2030 (%)

12.4.2 UK - Market size and forecast 2025-2030

Chart on UK - Market size and forecast 2025-2030 ($ million)
Data Table on UK - Market size and forecast 2025-2030 ($ million)
Chart on UK - Year-over-year growth 2025-2030 (%)
Data Table on UK - Year-over-year growth 2025-2030 (%)

12.4.3 France - Market size and forecast 2025-2030

Chart on France - Market size and forecast 2025-2030 ($ million)
Data Table on France - Market size and forecast 2025-2030 ($ million)
Chart on France - Year-over-year growth 2025-2030 (%)
Data Table on France - Year-over-year growth 2025-2030 (%)

12.4.4 Italy - Market size and forecast 2025-2030

Chart on Italy - Market size and forecast 2025-2030 ($ million)
Data Table on Italy - Market size and forecast 2025-2030 ($ million)
Chart on Italy - Year-over-year growth 2025-2030 (%)
Data Table on Italy - Year-over-year growth 2025-2030 (%)

12.4.5 Spain - Market size and forecast 2025-2030

Chart on Spain - Market size and forecast 2025-2030 ($ million)
Data Table on Spain - Market size and forecast 2025-2030 ($ million)
Chart on Spain - Year-over-year growth 2025-2030 (%)
Data Table on Spain - Year-over-year growth 2025-2030 (%)

12.4.6 The Netherlands - Market size and forecast 2025-2030

Chart on The Netherlands - Market size and forecast 2025-2030 ($ million)
Data Table on The Netherlands - Market size and forecast 2025-2030 ($ million)
Chart on The Netherlands - Year-over-year growth 2025-2030 (%)
Data Table on The Netherlands - Year-over-year growth 2025-2030 (%)

12.5 APAC - Market size and forecast 2025-2030

Chart on APAC - Market size and forecast 2025-2030 ($ million)
Data Table on APAC - Market size and forecast 2025-2030 ($ million)
Chart on APAC - Year-over-year growth 2025-2030 (%)
Data Table on APAC - Year-over-year growth 2025-2030 (%)
Chart on Regional Comparison - APAC
Data Table on Regional Comparison - APAC

12.5.1 China - Market size and forecast 2025-2030

Chart on China - Market size and forecast 2025-2030 ($ million)
Data Table on China - Market size and forecast 2025-2030 ($ million)
Chart on China - Year-over-year growth 2025-2030 (%)
Data Table on China - Year-over-year growth 2025-2030 (%)

12.5.2 Japan - Market size and forecast 2025-2030

Chart on Japan - Market size and forecast 2025-2030 ($ million)
Data Table on Japan - Market size and forecast 2025-2030 ($ million)
Chart on Japan - Year-over-year growth 2025-2030 (%)
Data Table on Japan - Year-over-year growth 2025-2030 (%)

12.5.3 India - Market size and forecast 2025-2030

Chart on India - Market size and forecast 2025-2030 ($ million)
Data Table on India - Market size and forecast 2025-2030 ($ million)
Chart on India - Year-over-year growth 2025-2030 (%)
Data Table on India - Year-over-year growth 2025-2030 (%)

12.5.4 South Korea - Market size and forecast 2025-2030

Chart on South Korea - Market size and forecast 2025-2030 ($ million)
Data Table on South Korea - Market size and forecast 2025-2030 ($ million)
Chart on South Korea - Year-over-year growth 2025-2030 (%)
Data Table on South Korea - Year-over-year growth 2025-2030 (%)

12.5.5 Australia - Market size and forecast 2025-2030

Chart on Australia - Market size and forecast 2025-2030 ($ million)
Data Table on Australia - Market size and forecast 2025-2030 ($ million)
Chart on Australia - Year-over-year growth 2025-2030 (%)
Data Table on Australia - Year-over-year growth 2025-2030 (%)

12.5.6 Indonesia - Market size and forecast 2025-2030

Chart on Indonesia - Market size and forecast 2025-2030 ($ million)
Data Table on Indonesia - Market size and forecast 2025-2030 ($ million)
Chart on Indonesia - Year-over-year growth 2025-2030 (%)
Data Table on Indonesia - Year-over-year growth 2025-2030 (%)

12.6 Middle East and Africa - Market size and forecast 2025-2030

Chart on Middle East and Africa - Market size and forecast 2025-2030 ($ million)
Data Table on Middle East and Africa - Market size and forecast 2025-2030 ($ million)
Chart on Middle East and Africa - Year-over-year growth 2025-2030 (%)
Data Table on Middle East and Africa - Year-over-year growth 2025-2030 (%)
Chart on Regional Comparison - Middle East and Africa
Data Table on Regional Comparison - Middle East and Africa

12.6.1 Saudi Arabia - Market size and forecast 2025-2030

Chart on Saudi Arabia - Market size and forecast 2025-2030 ($ million)
Data Table on Saudi Arabia - Market size and forecast 2025-2030 ($ million)
Chart on Saudi Arabia - Year-over-year growth 2025-2030 (%)
Data Table on Saudi Arabia - Year-over-year growth 2025-2030 (%)

12.6.2 UAE - Market size and forecast 2025-2030

Chart on UAE - Market size and forecast 2025-2030 ($ million)
Data Table on UAE - Market size and forecast 2025-2030 ($ million)
Chart on UAE - Year-over-year growth 2025-2030 (%)
Data Table on UAE - Year-over-year growth 2025-2030 (%)

12.6.3 South Africa - Market size and forecast 2025-2030

Chart on South Africa - Market size and forecast 2025-2030 ($ million)
Data Table on South Africa - Market size and forecast 2025-2030 ($ million)
Chart on South Africa - Year-over-year growth 2025-2030 (%)
Data Table on South Africa - Year-over-year growth 2025-2030 (%)

12.6.4 Turkey - Market size and forecast 2025-2030

Chart on Turkey - Market size and forecast 2025-2030 ($ million)
Data Table on Turkey - Market size and forecast 2025-2030 ($ million)
Chart on Turkey - Year-over-year growth 2025-2030 (%)
Data Table on Turkey - Year-over-year growth 2025-2030 (%)

12.6.5 Israel - Market size and forecast 2025-2030

Chart on Israel - Market size and forecast 2025-2030 ($ million)
Data Table on Israel - Market size and forecast 2025-2030 ($ million)
Chart on Israel - Year-over-year growth 2025-2030 (%)
Data Table on Israel - Year-over-year growth 2025-2030 (%)

12.7 South America - Market size and forecast 2025-2030

Chart on South America - Market size and forecast 2025-2030 ($ million)
Data Table on South America - Market size and forecast 2025-2030 ($ million)
Chart on South America - Year-over-year growth 2025-2030 (%)
Data Table on South America - Year-over-year growth 2025-2030 (%)
Chart on Regional Comparison - South America
Data Table on Regional Comparison - South America

12.7.1 Brazil - Market size and forecast 2025-2030

Chart on Brazil - Market size and forecast 2025-2030 ($ million)
Data Table on Brazil - Market size and forecast 2025-2030 ($ million)
Chart on Brazil - Year-over-year growth 2025-2030 (%)
Data Table on Brazil - Year-over-year growth 2025-2030 (%)

12.7.2 Argentina - Market size and forecast 2025-2030

Chart on Argentina - Market size and forecast 2025-2030 ($ million)
Data Table on Argentina - Market size and forecast 2025-2030 ($ million)
Chart on Argentina - Year-over-year growth 2025-2030 (%)
Data Table on Argentina - Year-over-year growth 2025-2030 (%)

12.7.3 Chile - Market size and forecast 2025-2030

Chart on Chile - Market size and forecast 2025-2030 ($ million)
Data Table on Chile - Market size and forecast 2025-2030 ($ million)
Chart on Chile - Year-over-year growth 2025-2030 (%)
Data Table on Chile - Year-over-year growth 2025-2030 (%)

12.8 Market opportunity by geography

Market opportunity by geography ($ million)
Data Tables on Market opportunity by geography ($ million)

13. Drivers, Challenges, and Opportunity

13.1 Market drivers

Increasing investments in urban infrastructure and smart city development
Growing demand for sustainable and green building design services
Expanding commercial and mixed use real estate development activity

13.2 Market challenges

Skilled workforce shortages across multidisciplinary building design projects
Lengthy regulatory approval and permitting processes for construction developments
Margin pressure from project cost inflation and fixed fee contracting models

13.3 Impact of drivers and challenges

Impact of drivers and challenges in 2025 and 2030

13.4 Market opportunities

Accelerating adoption of AI-enabled design and project planning workflows
Increasing integration of digital twin technology in building lifecycle management
Evolving shift toward integrated design and multidisciplinary service delivery models

14. Competitive Landscape

14.1 Overview

14.2

Overview on criticality of inputs and factors of differentiation

14.3 Landscape disruption

Overview on factors of disruption

14.4 Industry risks

Impact of key risks on business

15. Competitive Analysis

15.1 Companies profiled

Companies covered

15.2 Company ranking index

15.3 Market positioning of companies

Matrix on companies position and classification

15.4 AECOM

AECOM - Overview
AECOM - Business segments
AECOM - Key offerings
AECOM - Segment focus
SWOT

15.5 Arcadis N.V.

Arcadis N.V. - Overview
Arcadis N.V. - Product / Service
Arcadis N.V. - Key offerings
SWOT

15.6 Arup Group Ltd.

Arup Group Ltd. - Overview
Arup Group Ltd. - Product / Service
Arup Group Ltd. - Key offerings
SWOT

15.7 BDP

BDP - Overview
BDP - Product / Service
BDP - Key offerings
SWOT

15.8 BIG Bjarke Ingels Group

BIG Bjarke Ingels Group - Overview
BIG Bjarke Ingels Group - Product / Service
BIG Bjarke Ingels Group - Key offerings
SWOT

15.9 DLR Group

DLR Group - Overview
DLR Group - Product / Service
DLR Group - Key offerings
SWOT

15.10 Foster and Partners Group Ltd.

Foster and Partners Group Ltd. - Overview
Foster and Partners Group Ltd. - Product / Service
Foster and Partners Group Ltd. - Key offerings
SWOT

15.11 Grimshaw Architects

Grimshaw Architects - Overview
Grimshaw Architects - Product / Service
Grimshaw Architects - Key offerings
SWOT

15.12 HDR Inc.

HDR Inc. - Overview
HDR Inc. - Product / Service
HDR Inc. - Key offerings
SWOT

15.13 HKS Inc.

HKS Inc. - Overview
HKS Inc. - Product / Service
HKS Inc. - Key offerings
SWOT

15.14 HOK Group Inc.

HOK Group Inc. - Overview
HOK Group Inc. - Product / Service
HOK Group Inc. - Key offerings
SWOT

15.15 NBBJ

NBBJ - Overview
NBBJ - Product / Service
NBBJ - Key offerings
SWOT

15.16 Nikken Sekkei Ltd.

Nikken Sekkei Ltd. - Overview
Nikken Sekkei Ltd. - Product / Service
Nikken Sekkei Ltd. - Key offerings
SWOT

15.17 Stantec Inc.

Stantec Inc. - Overview
Stantec Inc. - Business segments
Stantec Inc. - Key offerings
Stantec Inc. - Segment focus
SWOT

15.18 Woods Bagot

Woods Bagot - Overview
Woods Bagot - Product / Service
Woods Bagot - Key offerings
SWOT

16. Appendix

16.1 Scope of the report

Market definition
Objectives
Notes and caveats

16.2 Inclusions and exclusions checklist

Inclusions checklist
Exclusions checklist

16.3 Currency conversion rates for US$

16.4 Research methodology

16.5 Data procurement

Information sources

16.6 Data validation

16.7 Validation techniques employed for market sizing

16.8 Data synthesis

16.9 360 degree market analysis

16.10 List of abbreviations

Research Methodology

Technavio presents a detailed picture of the market by way of study, synthesis, and summation of data from multiple sources. The analysts have presented the various facets of the market with a particular focus on identifying the key industry influencers. The data thus presented is comprehensive, reliable, and the result of extensive research, both primary and secondary.

INFORMATION SOURCES

Primary sources

  • Manufacturers and suppliers
  • Channel partners
  • Industry experts
  • Strategic decision makers

Secondary sources

  • Industry journals and periodicals
  • Government data
  • Financial reports of key industry players
  • Historical data
  • Press releases

DATA ANALYSIS

Data Synthesis

  • Collation of data
  • Estimation of key figures
  • Analysis of derived insights

Data Validation

  • Triangulation with data models
  • Reference against proprietary databases
  • Corroboration with industry experts

REPORT WRITING

Qualitative

  • Market drivers
  • Market challenges
  • Market trends
  • Five forces analysis

Quantitative

  • Market size and forecast
  • Market segmentation
  • Geographical insights
  • Competitive landscape

Interested in this report?

Get your sample now to see our research methodology and insights!

Download Now

Frequently Asked Questions

Architectural Services market growth will increase by USD 103281.5 million during 2026-2030.

The Architectural Services market is expected to grow at a CAGR of 4.6% during 2026-2030.

Architectural Services market is segmented by End-user (Commercial, Residential) Type (Construction and management, Engineering and interior design, Urban planning, Architecture advisory services, Others) Application (New construction, Renovation and remodeling, Restoration and conservation)

AECOM, Arcadis N.V., Arup Group Ltd., BDP, BIG Bjarke Ingels Group, CannonDesign, DLR Group, Foster and Partners Group Ltd., Gensler. M. Arthur Gensler Jr., Grimshaw Architects, HDR Inc., Henning Larsen, HKS Inc., HOK Group Inc., NBBJ, Nikken Sekkei Ltd., OMA, Perkins and Will International, Snohetta, SOM, Stantec Inc., Woods Bagot, Zaha Hadid Architects are a few of the key vendors in the Architectural Services market.

North America will register the highest growth rate of 48.5% among the other regions. Therefore, the Architectural Services market in North America is expected to garner significant business opportunities for the vendors during the forecast period.

US, Canada, Mexico, Germany, UK, France, Italy, Spain, The Netherlands, China, Japan, India, South Korea, Australia, Indonesia, Saudi Arabia, UAE, South Africa, Turkey, Israel, Brazil, Argentina, Chile

  • Increasing investments in urban infrastructure and smart city development is the driving factor this market.

The Architectural Services market vendors should focus on grabbing business opportunities from the End-user segment as it accounted for the largest market share in the base year.
RIA - Research AI Assistant
Ask RIA
