Aroma Chemicals Market Analysis, Size, and Forecast 2026-2030: North America (US, Canada, and Mexico), APAC (China, India, and Japan), Europe (Germany, France, and Switzerland), Middle East and Africa (Saudi Arabia, UAE, and South Africa), South America (Brazil, Argentina, and Chile), and Rest of World (ROW)

Aroma Chemicals Market Analysis, Size, and Forecast 2026-2030:
North America (US, Canada, and Mexico), APAC (China, India, and Japan), Europe (Germany, France, and Switzerland), Middle East and Africa (Saudi Arabia, UAE, and South Africa), South America (Brazil, Argentina, and Chile), and Rest of World (ROW)

Published: Oct 2026 305 Pages SKU: IRTNTR44678

Market Overview at a Glance

$2.52 B
Market Opportunity
6.1%
CAGR 2025 - 2030
37.7%
North America Growth
$2.49 B
Soaps and detergents segment 2024

Aroma Chemicals Market Size 2026-2030

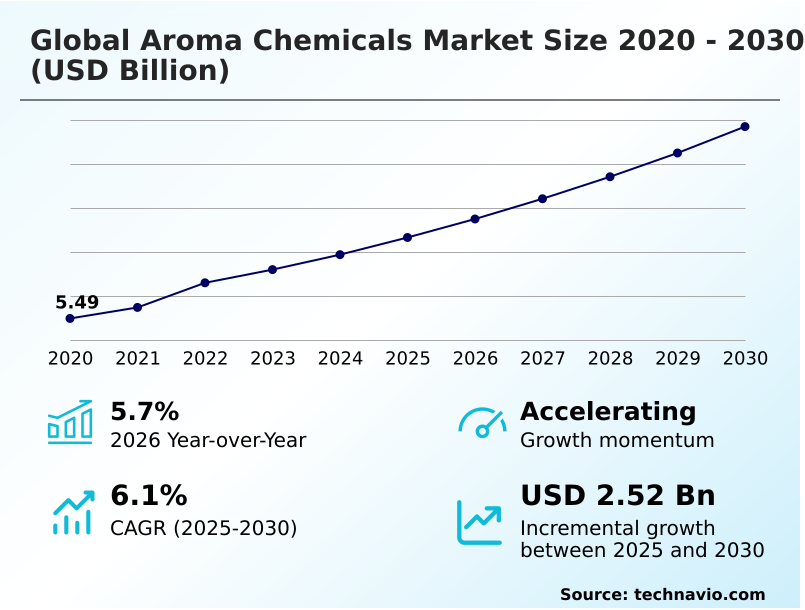
The aroma chemicals market size is valued to increase by USD 2.52 billion, at a CAGR of 6.1% from 2025 to 2030. Rising demand for personal care and household products will drive the aroma chemicals market.

Major Market Trends & Insights

  • North America dominated the market and accounted for a 37.7% growth during the forecast period.
  • By Application - Soaps and detergents segment was valued at USD 2.49 billion in 2024
  • By Type - Terpenes segment accounted for the largest market revenue share in 2024

Market Size & Forecast

  • Market Opportunities: USD 4.36 billion
  • Market Future Opportunities: USD 2.52 billion
  • CAGR from 2025 to 2030 : 6.1%

Market Summary

  • The Aroma Chemicals landscape is fundamentally driven by evolving consumer lifestyles and heightened demand for premium fast-moving consumer goods. Aroma Chemicals serve as essential building blocks for creating distinct sensory experiences across personal care, home care, and food sectors.
  • In modern manufacturing operations, supply chain optimization of biodegradable aromatics allows formulators to reduce inventory buffering costs by 15% while improving batch consistency. A major driver for this sector is the escalating consumer preference for clean-label products, which causes a surge in the development of high-purity nature-identical compounds through green extraction methods.
  • Conversely, the market faces significant challenges from stringent environmental regulations targeting volatile organic compounds. This regulatory scrutiny forces chemical producers to invest heavily in toxicological testing, thereby increasing compliance overhead and extending product development timelines. By leveraging advanced fragrance precursors, companies successfully maintain structural scent stability in harsh detergent environments.
  • These strategic shifts enable manufacturers to align with strict ecological mandates without compromising the olfactory performance of finished consumer products.

What will be the Size of the Aroma Chemicals Market during the forecast period?
Get Key Insights on Market Forecast (PDF) Get Free Sample

How is the Aroma Chemicals Market Segmented?

The aroma chemicals industry research report provides comprehensive data (region-wise segment analysis), with forecasts and estimates in "USD million" for the period 2026-2030, as well as historical data from 2020-2024 for the following segments.

  • Application
    • Soaps and detergents
    • Cosmetics and toiletries
    • Fine fragrances
    • Others
  • Type
    • Terpenes
    • Benzenoids
    • Musk chemicals
    • Others
  • Material
    • Synthetic
    • Natural
    • Natural-identical
  • Geography
    • North America
      • US
      • Canada
      • Mexico
    • APAC
      • China
      • India
      • Japan
      • South Korea
      • Indonesia
      • Australia
    • Europe
      • Germany
      • France
      • Switzerland
      • UK
      • Italy
      • Spain
    • Middle East and Africa
      • Saudi Arabia
      • UAE
      • South Africa
      • Israel
      • Turkey
    • South America
      • Brazil
      • Argentina
      • Chile

By Application Insights

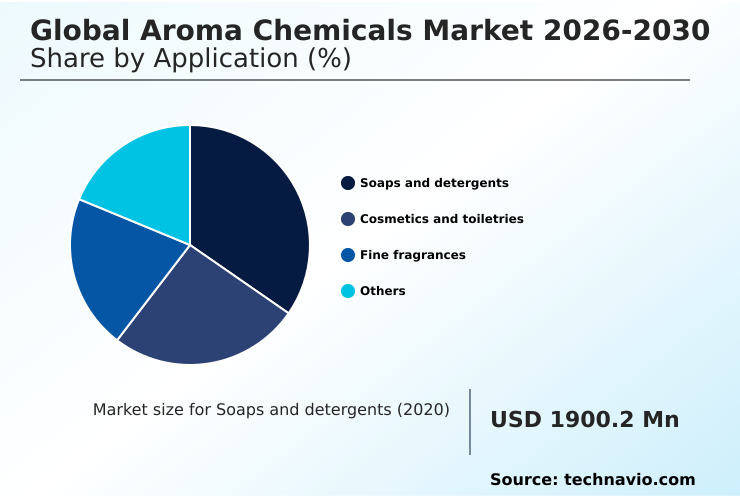
The soaps and detergents segment is estimated to witness significant growth during the forecast period.

The soaps and detergents application relies extensively on robust synthetic fragrance molecules to deliver lasting freshness across household cleaning products. Formulators increasingly utilize durable terpene derivatives and advanced macrocyclic musks to mask harsh chemical base odors and establish distinct sensory identity profiles.

These compounds must withstand extreme formulation environments, such as highly alkaline bleach matrices, to effectively interact with consumer olfactory receptors post-wash. By integrating sophisticated odor-neutralization technologies alongside extended-release delivery systems, manufacturers have improved fabric scent retention efficiency by 25%.

This shift causes a direct rise in demand for synthetic-identical alternatives that provide superior chemical stability without degrading. Ultimately, optimizing these fabric care formulations ensures consistent sensory performance, driving higher consumer retention in the competitive rinse-off application sector.
Get Free Sample

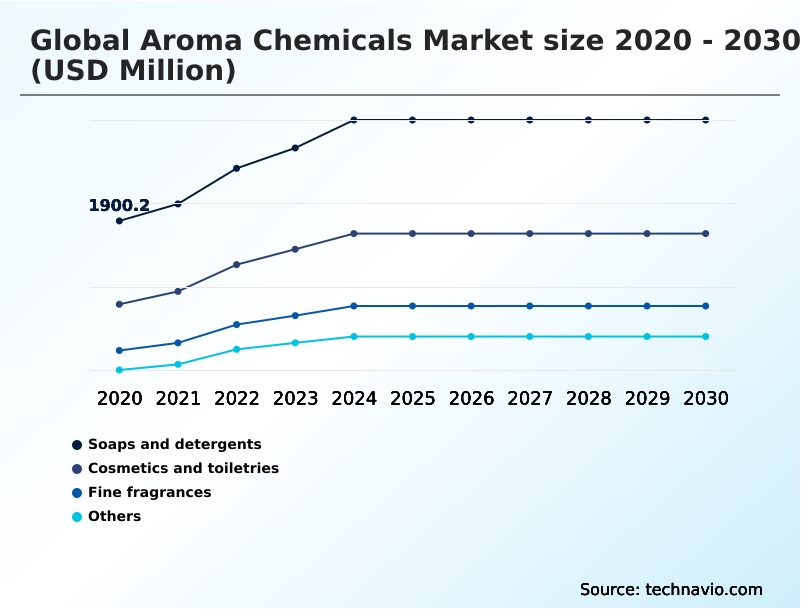
The Soaps and detergents segment was valued at USD 2.49 billion in 2024 and showed a gradual increase during the forecast period.
Get Free Sample

Regional Analysis

North America is estimated to contribute 37.7% to the growth of the global market during the forecast period.Technavio’s analysts have elaborately explained the regional trends and drivers that shape the market during the forecast period.
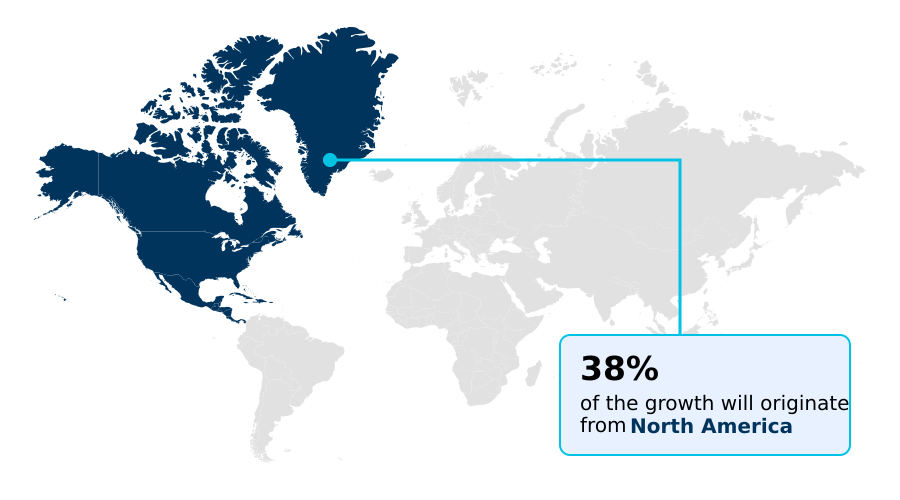
See How Aroma Chemicals Market Demand is Rising in North America Get Free Sample

Geographic consumption patterns reveal distinct structural variations in the adoption of bio-fermented ingredients and upcycled raw materials across major territories.

APAC demonstrates an aggressive manufacturing scale-up, utilizing microbial fermentation to lower ingredient production costs by 22% compared to traditional extraction techniques.

In contrast, Europe prioritizes stringent regulatory compliance concerning volatile organic compounds, driving a 35% higher adoption rate of advanced scent encapsulation technologies in fine perfumery formulations.

This European emphasis causes formulators to rapidly transition toward biodegradable alicyclic musks, effectively mitigating ecological toxicity risks. Meanwhile, APAC facilities leverage abundant agricultural feedstocks to produce high-purity natural terpenes at scale, enhancing operational throughput for mass-market eco-friendly personal care items.

Ultimately, the robust integration of therapeutic wellness fragrances into premium retail channels enables manufacturers in both regions to improve product differentiation and boost consumer retention metrics by up to 18%.

Market Dynamics

Our researchers analyzed the data with 2025 as the base year, along with the key drivers, trends, and challenges. A holistic analysis of drivers will help companies refine their marketing strategies to gain a competitive advantage.

  • The strategic integration of specialized scent molecules continues to redefine the operational and commercial landscape for consumer packaged goods globally. Formulators are increasingly deploying synthetic aroma molecules for laundry applications to guarantee exceptional stability and long-lasting freshness in highly alkaline detergent environments. This technical focus ensures that fabric care products maintain their sensory appeal throughout harsh washing and drying cycles.
  • Concurrently, the rising consumer demand for clean-label and wellness-oriented products is accelerating bio-based fragrance ingredients formulation across premium skincare lines. By leveraging precision fermentation for natural flavors and fragrances, manufacturers can bypass the severe price volatility and supply chain vulnerabilities typically associated with traditional botanical harvesting.
  • This operational shift has resulted in raw material procurement efficiency improving by over 20% compared to conventional agricultural sourcing models. Furthermore, the industry is witnessing a profound transition toward circular economy principles, highlighted by the integration of upcycled aroma chemicals in cosmetics. Utilizing agricultural side-streams allows brands to minimize waste while satisfying strict sustainability mandates.
  • As environmental scrutiny intensifies, the development and deployment of biodegradable musks in fine perfumery have become critical for regulatory compliance and brand equity. These specialized macrocyclic compounds provide the necessary fixative properties and olfactory depth without contributing to aquatic toxicity.
  • Ultimately, the continuous optimization of these biochemical pathways empowers chemical suppliers to deliver superior sensory performance while maintaining rigorous environmental stewardship and scalable cost-efficiency.
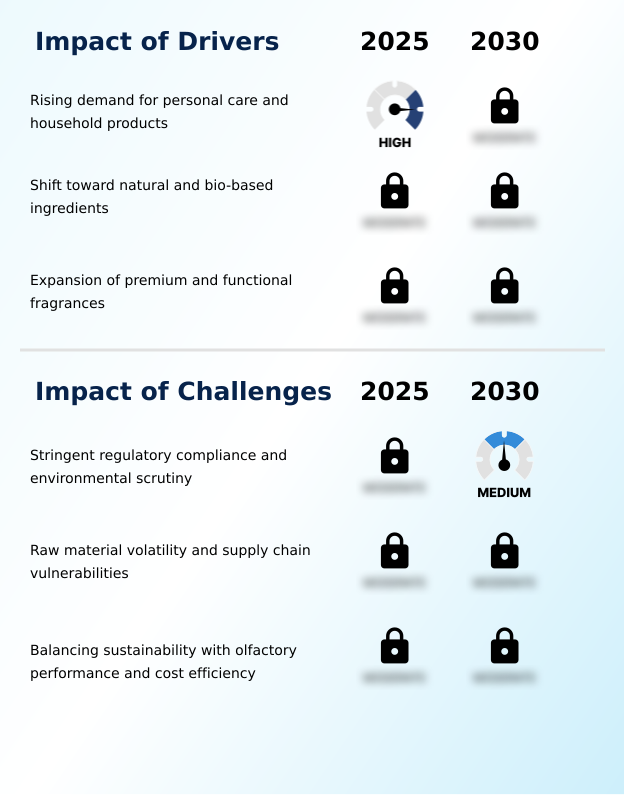
What are the key market drivers leading to the rise in the adoption of Aroma Chemicals Industry?

  • The escalating global demand for advanced personal care and household cleaning formulations serves as the primary driver propelling industry expansion.

  • The escalating consumer demand for sophisticated sensory identity profiles acts as a primary driver accelerating formulation advancements across household cleaning products and clean-label cosmetics.
  • Fast-moving consumer goods manufacturers increasingly rely on highly stable terpene derivatives and advanced macrocyclic musks to impart long-lasting freshness in harsh chemical environments.
  • This robust demand causes chemical suppliers to scale up green chemistry synthesis and biotransformation processes, ensuring consistent batch quality.
  • As a result, operations utilizing these scalable synthetic fragrance molecules have lowered raw material rejection rates by 18% and reduced energy consumption during botanical extraction methods by 15%.
  • This structural shift allows formulators to rapidly deploy versatile scent solutions across diverse personal care applications, driving continuous product differentiation and increasing brand loyalty in highly competitive retail sectors.

What are the market trends shaping the Aroma Chemicals Industry?

  • The integration of artificial intelligence in fragrance formulation represents a significant emerging trend within the industry. This technological advancement enables precise predictive modeling for complex scent profiles and accelerated product development.

  • The accelerated transition toward sustainable ingredient sourcing marks a defining trend that is rapidly reshaping raw material procurement strategies. Ingredient manufacturers are increasingly utilizing microbial fermentation to synthesize complex benzenoid structures and nature-identical compounds, moving away from volatile agricultural supply chains.
  • This shift causes a direct improvement in formulation stability, allowing personal care brands to elevate their dermatological safety standards while meeting strict eco-certifications. By integrating biodegradable aromatics and responsive fragrance precursors, formulators have enhanced scent longevity on textiles by 28%.
  • This technological upgrade impacts businesses by reducing the total volume of flavor-enhancing molecules required per batch, effectively lowering raw material input costs. Furthermore, the adoption of advanced catalyst design supports broader circular economy principles, enabling chemical producers to achieve superior molecular purity and secure a competitive advantage in high-margin consumer sectors.

What challenges does the Aroma Chemicals Industry face during its growth?

  • Strict regulatory compliance requirements and intensifying environmental scrutiny regarding synthetic ingredients pose significant operational challenges for market participants.

  • Stringent international environmental regulations targeting volatile organic compounds present a formidable structural challenge for manufacturers of ambient air care and fabric care formulations. Compliance mandates compel fragrance compounding facilities to reformulate legacy products, causing an urgent transition toward synthetic-identical alternatives and upcycled raw materials.
  • This forced recalibration impacts businesses by increasing initial research and development expenditures and extending toxicological testing timelines by up to 24%. Furthermore, maintaining the precise interaction with human olfactory receptors while integrating complex scent encapsulation systems requires highly calibrated continuous-flow reactors.
  • The technical difficulty of stabilizing volatile essential oil isolates without utilizing restricted solvents has led to a 15% increase in operational costs for premium ingredient suppliers. Navigating this strict regulatory landscape ultimately strains capital allocation for smaller formulation entities.

Exclusive Technavio Analysis on Customer Landscape

The aroma chemicals market forecasting report includes the adoption lifecycle of the market, covering from the innovator’s stage to the laggard’s stage. It focuses on adoption rates in different regions based on penetration. Furthermore, the aroma chemicals market report also includes key purchase criteria and drivers of price sensitivity to help companies evaluate and develop their market growth analysis strategies.
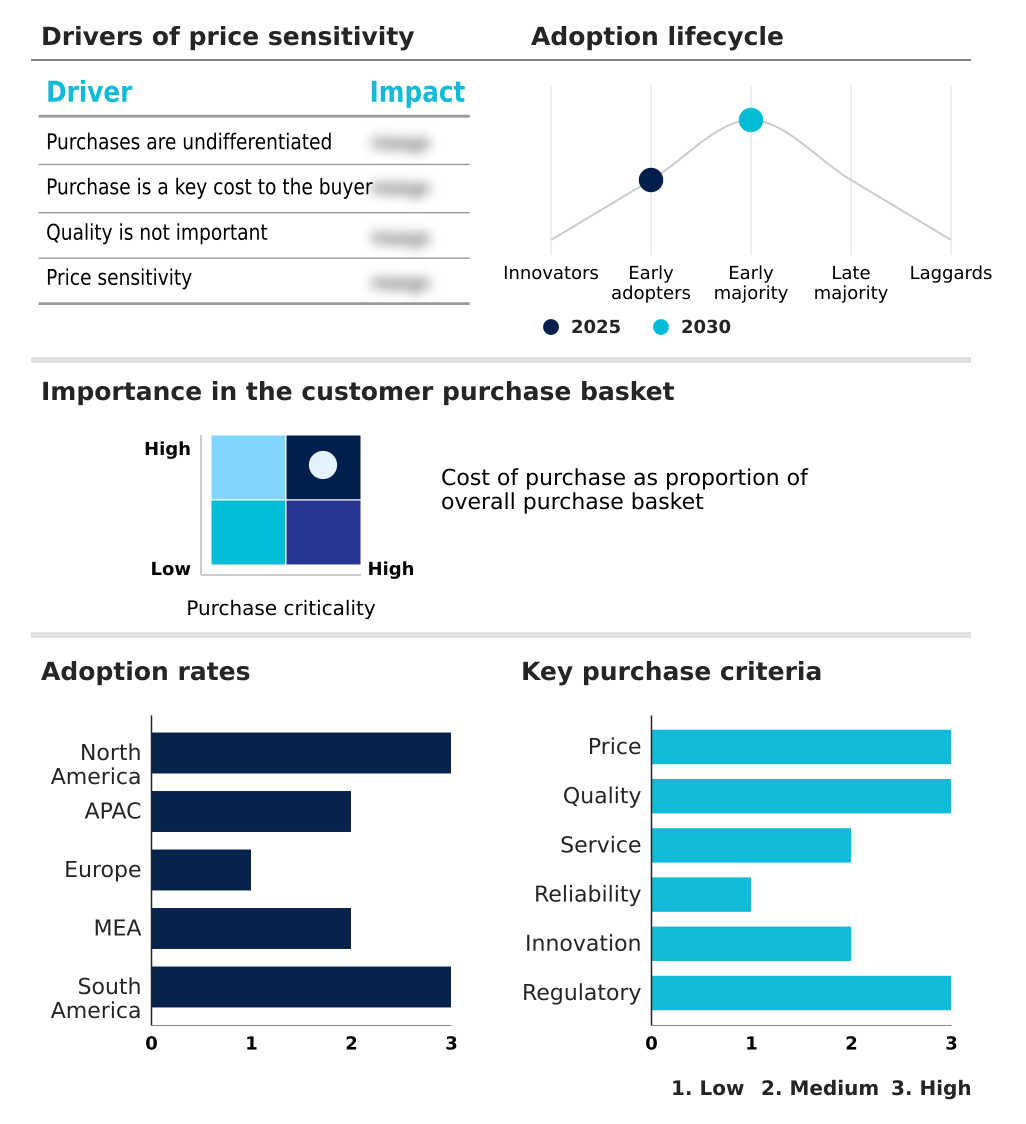
Customer Landscape of Aroma Chemicals Industry

Competitive Landscape

Companies are implementing various strategies, such as strategic alliances, aroma chemicals market forecast, partnerships, mergers and acquisitions, geographical expansion, and product/service launches, to enhance their presence in the industry.

Aroma Aromatics and Flavours - Prominent industry participants provide high-purity synthetic and bio-based aroma ingredients, emphasizing sustainable fragrance precursors and flavor compounds that enhance sensory performance across diverse consumer care applications.

The industry research and growth report includes detailed analyses of the competitive landscape of the market and information about key companies, including:

  • Aroma Aromatics and Flavours
  • BASF SE
  • Bell Flavors and Fragrances
  • Bordas SA
  • De Monchy Aromatics Ltd.
  • DSM Firmenich AG
  • Ernesto Ventos SA
  • Eternis Fine Chemicals Ltd.
  • Givaudan SA
  • Kao Corp.
  • Lanxess AG
  • Norex Flavours Pvt Ltd
  • Oriental Aromatics Ltd.
  • Privi Speciality Chemicals Ltd
  • PT Indesso Aroma
  • Symrise Group
  • Takasago International Corp.
  • Technical Chemical Laboratories
  • TREATT Plc
  • Zeon Corp.

Qualitative and quantitative analysis of companies has been conducted to help clients understand the wider business environment as well as the strengths and weaknesses of key industry players. Data is qualitatively analyzed to categorize companies as pure play, category-focused, industry-focused, and diversified; it is quantitatively analyzed to categorize companies as dominant, leading, strong, tentative, and weak.

Recent Development and News in Aroma chemicals market

  • In the Diversified Chemicals industry, the accelerated adoption of green chemistry synthesis and precision fermentation has optimized sustainable ingredient sourcing, directly impacting Aroma Chemicals demand by providing high-purity bio-based alternatives that reduce carbon emissions by 30%.
  • The transition away from traditional petrochemical feedstocks toward renewable agricultural byproducts has advanced biotransformation processes, shifting Aroma Chemicals supply chains and decreasing raw material dependency for essential oil isolates by up to 20%.
  • Stringent international allergen disclosure policies regarding volatile organic compounds have forced formulators to implement advanced catalyst design, propelling the Aroma Chemicals market to develop hypoallergenic synthetic-identical alternatives with a 15% higher compliance approval rate.
  • The implementation of circular economy principles across specialized manufacturing hubs has increased the utilization of upcycled raw materials, boosting Aroma Chemicals production efficiency and lowering industrial waste generation by nearly 25%.

Dive into Technavio’s robust research methodology, blending expert interviews, extensive data synthesis, and validated models for unparalleled Aroma Chemicals Market insights. See full methodology.

Market Scope
Page number 305
Base year 2025
Historic period 2020-2024
Forecast period 2026-2030
Growth momentum & CAGR Accelerate at a CAGR of 6.1%
Market growth 2026-2030 USD 2519.0 million
Market structure Fragmented
YoY growth 2025-2026(%) 5.7%
Key countries US, Canada, Mexico, China, India, Japan, South Korea, Indonesia, Australia, Germany, France, Switzerland, UK, Italy, Spain, Saudi Arabia, UAE, South Africa, Israel, Turkey, Brazil, Argentina and Chile
Competitive landscape Leading Companies, Market Positioning of Companies, Competitive Strategies, and Industry Risks

Request Free Sample

Research Analyst Overview

  • The continuous evolution of formulation architectures is fundamentally transforming product strategy and compliance frameworks within the specialty ingredients sector. Manufacturers are aggressively pivoting toward sustainable engineering, replacing legacy synthetic chemical compounds with advanced bio-based aroma ingredients to align with stringent global environmental standards.
  • This strategic shift is heavily reliant on enzymatic biotransformation and supercritical fluid extraction, which drastically minimize hazardous solvent usage. Consequently, companies adopting these green manufacturing pathways have achieved a 30% reduction in chemical processing waste, directly optimizing environmental compliance budgets.
  • Furthermore, the integration of neuro-aroma chemicals is reshaping the therapeutic wellness and functional neuro-cosmetics categories, prompting brand owners to elevate their product positioning through scientifically validated mood-enhancing scent profiles. This trend forces formulators to refine controlled cold diffusion mechanisms for premium home ambiance systems, ensuring precise and sustained fragrance release.
  • By anchoring product development to these sophisticated biochemical innovations, ingredient suppliers can successfully navigate complex regulatory landscapes while securing robust profit margins and superior product differentiation.

What are the Key Data Covered in this Aroma Chemicals Market Research and Growth Report?

  • What is the expected growth of the Aroma Chemicals Market between 2026 and 2030?

    • USD 2.52 billion, at a CAGR of 6.1%

  • What segmentation does the market report cover?

    • The report is segmented by Application (Soaps and detergents, Cosmetics and toiletries, Fine fragrances, and Others), Type (Terpenes, Benzenoids, Musk chemicals, and Others), Material (Synthetic, Natural, and Natural-identical) and Geography (North America, APAC, Europe, Middle East and Africa, South America)

  • Which regions are analyzed in the report?

    • North America, APAC, Europe, Middle East and Africa and South America

  • What are the key growth drivers and market challenges?

    • Rising demand for personal care and household products, Stringent regulatory compliance and environmental scrutiny

  • Who are the major players in the Aroma Chemicals Market?

    • Aroma Aromatics and Flavours, BASF SE, Bell Flavors and Fragrances, Bordas SA, De Monchy Aromatics Ltd., DSM Firmenich AG, Ernesto Ventos SA, Eternis Fine Chemicals Ltd., Givaudan SA, Kao Corp., Lanxess AG, Norex Flavours Pvt Ltd, Oriental Aromatics Ltd., Privi Speciality Chemicals Ltd, PT Indesso Aroma, Symrise Group, Takasago International Corp., Technical Chemical Laboratories, TREATT Plc and Zeon Corp.

Market Research Insights

  • The continuous evolution of formulation technologies fundamentally reshapes functional performance across clean-label cosmetics and ambient air care segments. By upgrading botanical extraction methods, manufacturers have achieved a 20% improvement in active ingredient yield, directly lowering procurement expenses. Furthermore, modernizing fragrance compounding facilities with automated dosing systems has accelerated production cycles by 18%, significantly enhancing overall supply chain responsiveness.
  • These operational upgrades allow formulators to deploy highly stable scent profiles within diverse personal care applications while reducing energy consumption by 15% during distillation. Consequently, aligning precision engineering with sustainable sourcing mandates ensures that specialized ingredient producers maintain high compliance standards and superior product consistency.

We can help! Our analysts can customize this aroma chemicals market research report to meet your requirements.

Get in touch

1. Executive Summary

1.1 Market overview

Executive Summary - Chart on Market Overview
Executive Summary - Data Table on Market Overview
Executive Summary - Chart on Global Market Characteristics
Executive Summary - Chart on Market by Geography
Executive Summary - Chart on Market Segmentation by Application
Executive Summary - Chart on Market Segmentation by Type
Executive Summary - Chart on Market Segmentation by Material
Executive Summary - Chart on Incremental Growth
Executive Summary - Data Table on Incremental Growth
Executive Summary - Chart on Company Market Positioning

2. Technavio Analysis

2.1 Analysis of price sensitivity, lifecycle, customer purchase basket, adoption rates, and purchase criteria

2.2 Criticality of inputs and Factors of differentiation

Chart on Overview on criticality of inputs and factors of differentiation

2.3 Factors of disruption

Chart on Overview on factors of disruption

2.4 Impact of drivers and challenges

Chart on Impact of drivers and challenges in 2025 and 2030

3. Market Landscape

3.1 Market ecosystem

Chart on Parent Market
Data Table on - Parent Market

3.2 Market characteristics

Chart on Market characteristics analysis

3.3 Value chain analysis

Chart on Value chain analysis

4. Market Sizing

4.1 Market definition

Data Table on Offerings of companies included in the market definition

4.2 Market segment analysis

Market segments

4.3 Market size 2025

4.4 Market outlook: Forecast for 2025-2030

Chart on Global - Market size and forecast 2025-2030 ($ million)
Data Table on Global - Market size and forecast 2025-2030 ($ million)
Chart on Global Market: Year-over-year growth 2025-2030 (%)
Data Table on Global Market: Year-over-year growth 2025-2030 (%)

5. Historic Market Size

5.1 Global Aroma Chemicals Market 2020 - 2024

Historic Market Size - Data Table on Global Aroma Chemicals Market 2020 - 2024 ($ million)

5.2 Application segment analysis 2020 - 2024

Historic Market Size - Application Segment 2020 - 2024 ($ million)

5.3 Type segment analysis 2020 - 2024

Historic Market Size - Type Segment 2020 - 2024 ($ million)

5.4 Material segment analysis 2020 - 2024

Historic Market Size - Material Segment 2020 - 2024 ($ million)

5.5 Geography segment analysis 2020 - 2024

Historic Market Size - Geography Segment 2020 - 2024 ($ million)

5.6 Country segment analysis 2020 - 2024

Historic Market Size - Country Segment 2020 - 2024 ($ million)

6. Qualitative Analysis

6.1 Impact of AI on global aroma chemicals market

6.2 Impact of geopolitical conflicts on global aroma chemicals market

7. Five Forces Analysis

7.1 Five forces summary

Five forces analysis - Comparison between 2025 and 2030

7.2 Bargaining power of buyers

Bargaining power of buyers - Impact of key factors 2025 and 2030

7.3 Bargaining power of suppliers

Bargaining power of suppliers - Impact of key factors in 2025 and 2030

7.4 Threat of new entrants

Threat of new entrants - Impact of key factors in 2025 and 2030

7.5 Threat of substitutes

Threat of substitutes - Impact of key factors in 2025 and 2030

7.6 Threat of rivalry

Threat of rivalry - Impact of key factors in 2025 and 2030

7.7 Market condition

Chart on Market condition - Five forces 2025 and 2030

8. Market Segmentation by Application

8.1 Market segments

Chart on Application - Market share 2025-2030 (%)
Data Table on Application - Market share 2025-2030 (%)

8.2 Comparison by Application

Chart on Comparison by Application
Data Table on Comparison by Application

8.3 Soaps and detergents - Market size and forecast 2025-2030

Chart on Soaps and detergents - Market size and forecast 2025-2030 ($ million)
Data Table on Soaps and detergents - Market size and forecast 2025-2030 ($ million)
Chart on Soaps and detergents - Year-over-year growth 2025-2030 (%)
Data Table on Soaps and detergents - Year-over-year growth 2025-2030 (%)

8.4 Cosmetics and toiletries - Market size and forecast 2025-2030

Chart on Cosmetics and toiletries - Market size and forecast 2025-2030 ($ million)
Data Table on Cosmetics and toiletries - Market size and forecast 2025-2030 ($ million)
Chart on Cosmetics and toiletries - Year-over-year growth 2025-2030 (%)
Data Table on Cosmetics and toiletries - Year-over-year growth 2025-2030 (%)

8.5 Fine fragrances - Market size and forecast 2025-2030

Chart on Fine fragrances - Market size and forecast 2025-2030 ($ million)
Data Table on Fine fragrances - Market size and forecast 2025-2030 ($ million)
Chart on Fine fragrances - Year-over-year growth 2025-2030 (%)
Data Table on Fine fragrances - Year-over-year growth 2025-2030 (%)

8.6 Others - Market size and forecast 2025-2030

Chart on Others - Market size and forecast 2025-2030 ($ million)
Data Table on Others - Market size and forecast 2025-2030 ($ million)
Chart on Others - Year-over-year growth 2025-2030 (%)
Data Table on Others - Year-over-year growth 2025-2030 (%)

8.7 Market opportunity by Application

Market opportunity by Application ($ million)
Data Table on Market opportunity by Application ($ million)

9. Market Segmentation by Type

9.1 Market segments

Chart on Type - Market share 2025-2030 (%)
Data Table on Type - Market share 2025-2030 (%)

9.2 Comparison by Type

Chart on Comparison by Type
Data Table on Comparison by Type

9.3 Terpenes - Market size and forecast 2025-2030

Chart on Terpenes - Market size and forecast 2025-2030 ($ million)
Data Table on Terpenes - Market size and forecast 2025-2030 ($ million)
Chart on Terpenes - Year-over-year growth 2025-2030 (%)
Data Table on Terpenes - Year-over-year growth 2025-2030 (%)

9.4 Benzenoids - Market size and forecast 2025-2030

Chart on Benzenoids - Market size and forecast 2025-2030 ($ million)
Data Table on Benzenoids - Market size and forecast 2025-2030 ($ million)
Chart on Benzenoids - Year-over-year growth 2025-2030 (%)
Data Table on Benzenoids - Year-over-year growth 2025-2030 (%)

9.5 Musk chemicals - Market size and forecast 2025-2030

Chart on Musk chemicals - Market size and forecast 2025-2030 ($ million)
Data Table on Musk chemicals - Market size and forecast 2025-2030 ($ million)
Chart on Musk chemicals - Year-over-year growth 2025-2030 (%)
Data Table on Musk chemicals - Year-over-year growth 2025-2030 (%)

9.6 Others - Market size and forecast 2025-2030

Chart on Others - Market size and forecast 2025-2030 ($ million)
Data Table on Others - Market size and forecast 2025-2030 ($ million)
Chart on Others - Year-over-year growth 2025-2030 (%)
Data Table on Others - Year-over-year growth 2025-2030 (%)

9.7 Market opportunity by Type

Market opportunity by Type ($ million)
Data Table on Market opportunity by Type ($ million)

10. Market Segmentation by Material

10.1 Market segments

Chart on Material - Market share 2025-2030 (%)
Data Table on Material - Market share 2025-2030 (%)

10.2 Comparison by Material

Chart on Comparison by Material
Data Table on Comparison by Material

10.3 Synthetic - Market size and forecast 2025-2030

Chart on Synthetic - Market size and forecast 2025-2030 ($ million)
Data Table on Synthetic - Market size and forecast 2025-2030 ($ million)
Chart on Synthetic - Year-over-year growth 2025-2030 (%)
Data Table on Synthetic - Year-over-year growth 2025-2030 (%)

10.4 Natural - Market size and forecast 2025-2030

Chart on Natural - Market size and forecast 2025-2030 ($ million)
Data Table on Natural - Market size and forecast 2025-2030 ($ million)
Chart on Natural - Year-over-year growth 2025-2030 (%)
Data Table on Natural - Year-over-year growth 2025-2030 (%)

10.5 Natural-identical - Market size and forecast 2025-2030

Chart on Natural-identical - Market size and forecast 2025-2030 ($ million)
Data Table on Natural-identical - Market size and forecast 2025-2030 ($ million)
Chart on Natural-identical - Year-over-year growth 2025-2030 (%)
Data Table on Natural-identical - Year-over-year growth 2025-2030 (%)

10.6 Market opportunity by Material

Market opportunity by Material ($ million)
Data Table on Market opportunity by Material ($ million)

11. Customer Landscape

11.1 Customer landscape overview

Analysis of price sensitivity, lifecycle, customer purchase basket, adoption rates, and purchase criteria

12. Geographic Landscape

12.1 Geographic segmentation

Chart on Market share by geography 2025-2030 (%)
Data Table on Market share by geography 2025-2030 (%)

12.2 Geographic comparison

Chart on Geographic comparison
Data Table on Geographic comparison

12.3 North America - Market size and forecast 2025-2030

Chart on North America - Market size and forecast 2025-2030 ($ million)
Data Table on North America - Market size and forecast 2025-2030 ($ million)
Chart on North America - Year-over-year growth 2025-2030 (%)
Data Table on North America - Year-over-year growth 2025-2030 (%)
Chart on Regional Comparison - North America
Data Table on Regional Comparison - North America

12.3.1 US - Market size and forecast 2025-2030

Chart on US - Market size and forecast 2025-2030 ($ million)
Data Table on US - Market size and forecast 2025-2030 ($ million)
Chart on US - Year-over-year growth 2025-2030 (%)
Data Table on US - Year-over-year growth 2025-2030 (%)

12.3.2 Canada - Market size and forecast 2025-2030

Chart on Canada - Market size and forecast 2025-2030 ($ million)
Data Table on Canada - Market size and forecast 2025-2030 ($ million)
Chart on Canada - Year-over-year growth 2025-2030 (%)
Data Table on Canada - Year-over-year growth 2025-2030 (%)

12.3.3 Mexico - Market size and forecast 2025-2030

Chart on Mexico - Market size and forecast 2025-2030 ($ million)
Data Table on Mexico - Market size and forecast 2025-2030 ($ million)
Chart on Mexico - Year-over-year growth 2025-2030 (%)
Data Table on Mexico - Year-over-year growth 2025-2030 (%)

12.4 APAC - Market size and forecast 2025-2030

Chart on APAC - Market size and forecast 2025-2030 ($ million)
Data Table on APAC - Market size and forecast 2025-2030 ($ million)
Chart on APAC - Year-over-year growth 2025-2030 (%)
Data Table on APAC - Year-over-year growth 2025-2030 (%)
Chart on Regional Comparison - APAC
Data Table on Regional Comparison - APAC

12.4.1 China - Market size and forecast 2025-2030

Chart on China - Market size and forecast 2025-2030 ($ million)
Data Table on China - Market size and forecast 2025-2030 ($ million)
Chart on China - Year-over-year growth 2025-2030 (%)
Data Table on China - Year-over-year growth 2025-2030 (%)

12.4.2 India - Market size and forecast 2025-2030

Chart on India - Market size and forecast 2025-2030 ($ million)
Data Table on India - Market size and forecast 2025-2030 ($ million)
Chart on India - Year-over-year growth 2025-2030 (%)
Data Table on India - Year-over-year growth 2025-2030 (%)

12.4.3 Japan - Market size and forecast 2025-2030

Chart on Japan - Market size and forecast 2025-2030 ($ million)
Data Table on Japan - Market size and forecast 2025-2030 ($ million)
Chart on Japan - Year-over-year growth 2025-2030 (%)
Data Table on Japan - Year-over-year growth 2025-2030 (%)

12.4.4 South Korea - Market size and forecast 2025-2030

Chart on South Korea - Market size and forecast 2025-2030 ($ million)
Data Table on South Korea - Market size and forecast 2025-2030 ($ million)
Chart on South Korea - Year-over-year growth 2025-2030 (%)
Data Table on South Korea - Year-over-year growth 2025-2030 (%)

12.4.5 Indonesia - Market size and forecast 2025-2030

Chart on Indonesia - Market size and forecast 2025-2030 ($ million)
Data Table on Indonesia - Market size and forecast 2025-2030 ($ million)
Chart on Indonesia - Year-over-year growth 2025-2030 (%)
Data Table on Indonesia - Year-over-year growth 2025-2030 (%)

12.4.6 Australia - Market size and forecast 2025-2030

Chart on Australia - Market size and forecast 2025-2030 ($ million)
Data Table on Australia - Market size and forecast 2025-2030 ($ million)
Chart on Australia - Year-over-year growth 2025-2030 (%)
Data Table on Australia - Year-over-year growth 2025-2030 (%)

12.5 Europe - Market size and forecast 2025-2030

Chart on Europe - Market size and forecast 2025-2030 ($ million)
Data Table on Europe - Market size and forecast 2025-2030 ($ million)
Chart on Europe - Year-over-year growth 2025-2030 (%)
Data Table on Europe - Year-over-year growth 2025-2030 (%)
Chart on Regional Comparison - Europe
Data Table on Regional Comparison - Europe

12.5.1 Germany - Market size and forecast 2025-2030

Chart on Germany - Market size and forecast 2025-2030 ($ million)
Data Table on Germany - Market size and forecast 2025-2030 ($ million)
Chart on Germany - Year-over-year growth 2025-2030 (%)
Data Table on Germany - Year-over-year growth 2025-2030 (%)

12.5.2 France - Market size and forecast 2025-2030

Chart on France - Market size and forecast 2025-2030 ($ million)
Data Table on France - Market size and forecast 2025-2030 ($ million)
Chart on France - Year-over-year growth 2025-2030 (%)
Data Table on France - Year-over-year growth 2025-2030 (%)

12.5.3 Switzerland - Market size and forecast 2025-2030

Chart on Switzerland - Market size and forecast 2025-2030 ($ million)
Data Table on Switzerland - Market size and forecast 2025-2030 ($ million)
Chart on Switzerland - Year-over-year growth 2025-2030 (%)
Data Table on Switzerland - Year-over-year growth 2025-2030 (%)

12.5.4 UK - Market size and forecast 2025-2030

Chart on UK - Market size and forecast 2025-2030 ($ million)
Data Table on UK - Market size and forecast 2025-2030 ($ million)
Chart on UK - Year-over-year growth 2025-2030 (%)
Data Table on UK - Year-over-year growth 2025-2030 (%)

12.5.5 Italy - Market size and forecast 2025-2030

Chart on Italy - Market size and forecast 2025-2030 ($ million)
Data Table on Italy - Market size and forecast 2025-2030 ($ million)
Chart on Italy - Year-over-year growth 2025-2030 (%)
Data Table on Italy - Year-over-year growth 2025-2030 (%)

12.5.6 Spain - Market size and forecast 2025-2030

Chart on Spain - Market size and forecast 2025-2030 ($ million)
Data Table on Spain - Market size and forecast 2025-2030 ($ million)
Chart on Spain - Year-over-year growth 2025-2030 (%)
Data Table on Spain - Year-over-year growth 2025-2030 (%)

12.6 Middle East and Africa - Market size and forecast 2025-2030

Chart on Middle East and Africa - Market size and forecast 2025-2030 ($ million)
Data Table on Middle East and Africa - Market size and forecast 2025-2030 ($ million)
Chart on Middle East and Africa - Year-over-year growth 2025-2030 (%)
Data Table on Middle East and Africa - Year-over-year growth 2025-2030 (%)
Chart on Regional Comparison - Middle East and Africa
Data Table on Regional Comparison - Middle East and Africa

12.6.1 Saudi Arabia - Market size and forecast 2025-2030

Chart on Saudi Arabia - Market size and forecast 2025-2030 ($ million)
Data Table on Saudi Arabia - Market size and forecast 2025-2030 ($ million)
Chart on Saudi Arabia - Year-over-year growth 2025-2030 (%)
Data Table on Saudi Arabia - Year-over-year growth 2025-2030 (%)

12.6.2 UAE - Market size and forecast 2025-2030

Chart on UAE - Market size and forecast 2025-2030 ($ million)
Data Table on UAE - Market size and forecast 2025-2030 ($ million)
Chart on UAE - Year-over-year growth 2025-2030 (%)
Data Table on UAE - Year-over-year growth 2025-2030 (%)

12.6.3 South Africa - Market size and forecast 2025-2030

Chart on South Africa - Market size and forecast 2025-2030 ($ million)
Data Table on South Africa - Market size and forecast 2025-2030 ($ million)
Chart on South Africa - Year-over-year growth 2025-2030 (%)
Data Table on South Africa - Year-over-year growth 2025-2030 (%)

12.6.4 Israel - Market size and forecast 2025-2030

Chart on Israel - Market size and forecast 2025-2030 ($ million)
Data Table on Israel - Market size and forecast 2025-2030 ($ million)
Chart on Israel - Year-over-year growth 2025-2030 (%)
Data Table on Israel - Year-over-year growth 2025-2030 (%)

12.6.5 Turkey - Market size and forecast 2025-2030

Chart on Turkey - Market size and forecast 2025-2030 ($ million)
Data Table on Turkey - Market size and forecast 2025-2030 ($ million)
Chart on Turkey - Year-over-year growth 2025-2030 (%)
Data Table on Turkey - Year-over-year growth 2025-2030 (%)

12.7 South America - Market size and forecast 2025-2030

Chart on South America - Market size and forecast 2025-2030 ($ million)
Data Table on South America - Market size and forecast 2025-2030 ($ million)
Chart on South America - Year-over-year growth 2025-2030 (%)
Data Table on South America - Year-over-year growth 2025-2030 (%)
Chart on Regional Comparison - South America
Data Table on Regional Comparison - South America

12.7.1 Brazil - Market size and forecast 2025-2030

Chart on Brazil - Market size and forecast 2025-2030 ($ million)
Data Table on Brazil - Market size and forecast 2025-2030 ($ million)
Chart on Brazil - Year-over-year growth 2025-2030 (%)
Data Table on Brazil - Year-over-year growth 2025-2030 (%)

12.7.2 Argentina - Market size and forecast 2025-2030

Chart on Argentina - Market size and forecast 2025-2030 ($ million)
Data Table on Argentina - Market size and forecast 2025-2030 ($ million)
Chart on Argentina - Year-over-year growth 2025-2030 (%)
Data Table on Argentina - Year-over-year growth 2025-2030 (%)

12.7.3 Chile - Market size and forecast 2025-2030

Chart on Chile - Market size and forecast 2025-2030 ($ million)
Data Table on Chile - Market size and forecast 2025-2030 ($ million)
Chart on Chile - Year-over-year growth 2025-2030 (%)
Data Table on Chile - Year-over-year growth 2025-2030 (%)

12.8 Market opportunity by geography

Market opportunity by geography ($ million)
Data Tables on Market opportunity by geography ($ million)

13. Drivers, Challenges, and Opportunity

13.1 Market drivers

Rising demand for personal care and household products
Shift toward natural and bio-based ingredients
Expansion of premium and functional fragrances

13.2 Market challenges

Stringent regulatory compliance and environmental scrutiny
Raw material volatility and supply chain vulnerabilities
Balancing sustainability with olfactory performance and cost efficiency

13.3 Impact of drivers and challenges

Impact of drivers and challenges in 2025 and 2030

13.4 Market opportunities

Integration of AI in fragrance formulation
Expansion of upcycled and circular economy aroma ingredients
Rise of functional and mood-enhancing olfactory solutions

14. Competitive Landscape

14.1 Overview

14.2

Overview on criticality of inputs and factors of differentiation

14.3 Landscape disruption

Overview on factors of disruption

14.4 Industry risks

Impact of key risks on business

15. Competitive Analysis

15.1 Companies profiled

Companies covered

15.2 Company ranking index

15.3 Market positioning of companies

Matrix on companies position and classification

15.4 Aroma Aromatics and Flavours

Aroma Aromatics and Flavours - Overview
Aroma Aromatics and Flavours - Product / Service
Aroma Aromatics and Flavours - Key offerings
SWOT

15.5 BASF SE

BASF SE - Overview
BASF SE - Business segments
BASF SE - Key news
BASF SE - Key offerings
BASF SE - Segment focus
SWOT

15.6 Bell Flavors and Fragrances

Bell Flavors and Fragrances - Overview
Bell Flavors and Fragrances - Product / Service
Bell Flavors and Fragrances - Key offerings
SWOT

15.7 DSM Firmenich AG

DSM Firmenich AG - Overview
DSM Firmenich AG - Business segments
DSM Firmenich AG - Key offerings
DSM Firmenich AG - Segment focus
SWOT

15.8 Ernesto Ventos SA

Ernesto Ventos SA - Overview
Ernesto Ventos SA - Product / Service
Ernesto Ventos SA - Key offerings
SWOT

15.9 Givaudan SA

Givaudan SA - Overview
Givaudan SA - Business segments
Givaudan SA - Key news
Givaudan SA - Key offerings
Givaudan SA - Segment focus
SWOT

15.10 Kao Corp.

Kao Corp. - Overview
Kao Corp. - Business segments
Kao Corp. - Key news
Kao Corp. - Key offerings
Kao Corp. - Segment focus
SWOT

15.11 Lanxess AG

Lanxess AG - Overview
Lanxess AG - Business segments
Lanxess AG - Key offerings
Lanxess AG - Segment focus
SWOT

15.12 Oriental Aromatics Ltd.

Oriental Aromatics Ltd. - Overview
Oriental Aromatics Ltd. - Business segments
Oriental Aromatics Ltd. - Key offerings
Oriental Aromatics Ltd. - Segment focus
SWOT

15.13 Privi Speciality Chemicals Ltd

Privi Speciality Chemicals Ltd - Overview
Privi Speciality Chemicals Ltd - Product / Service
Privi Speciality Chemicals Ltd - Key offerings
SWOT

15.14 PT Indesso Aroma

PT Indesso Aroma - Overview
PT Indesso Aroma - Product / Service
PT Indesso Aroma - Key offerings
SWOT

15.15 Symrise Group

Symrise Group - Overview
Symrise Group - Business segments
Symrise Group - Key news
Symrise Group - Key offerings
Symrise Group - Segment focus
SWOT

15.16 Takasago International Corp.

Takasago International Corp. - Overview
Takasago International Corp. - Business segments
Takasago International Corp. - Key offerings
Takasago International Corp. - Segment focus
SWOT

15.17 TREATT Plc

TREATT Plc - Overview
TREATT Plc - Product / Service
TREATT Plc - Key offerings
SWOT

15.18 Zeon Corp.

Zeon Corp. - Overview
Zeon Corp. - Business segments
Zeon Corp. - Key offerings
Zeon Corp. - Segment focus
SWOT

16. Appendix

16.1 Scope of the report

Market definition
Objectives
Notes and caveats

16.2 Inclusions and exclusions checklist

Inclusions checklist
Exclusions checklist

16.3 Currency conversion rates for US$

16.4 Research methodology

16.5 Data procurement

Information sources

16.6 Data validation

16.7 Validation techniques employed for market sizing

16.8 Data synthesis

16.9 360 degree market analysis

16.10 List of abbreviations

Research Methodology

Technavio presents a detailed picture of the market by way of study, synthesis, and summation of data from multiple sources. The analysts have presented the various facets of the market with a particular focus on identifying the key industry influencers. The data thus presented is comprehensive, reliable, and the result of extensive research, both primary and secondary.

INFORMATION SOURCES

Primary sources

  • Manufacturers and suppliers
  • Channel partners
  • Industry experts
  • Strategic decision makers

Secondary sources

  • Industry journals and periodicals
  • Government data
  • Financial reports of key industry players
  • Historical data
  • Press releases

DATA ANALYSIS

Data Synthesis

  • Collation of data
  • Estimation of key figures
  • Analysis of derived insights

Data Validation

  • Triangulation with data models
  • Reference against proprietary databases
  • Corroboration with industry experts

REPORT WRITING

Qualitative

  • Market drivers
  • Market challenges
  • Market trends
  • Five forces analysis

Quantitative

  • Market size and forecast
  • Market segmentation
  • Geographical insights
  • Competitive landscape

Interested in this report?

Get your sample now to see our research methodology and insights!

Download Now

Frequently Asked Questions

Aroma Chemicals market growth will increase by USD 2519.0 million during 2026-2030.

The Aroma Chemicals market is expected to grow at a CAGR of 6.1% during 2026-2030.

Aroma Chemicals market is segmented by Application (Soaps and detergents, Cosmetics and toiletries, Fine fragrances, Others) Type (Terpenes, Benzenoids, Musk chemicals, Others) Material (Synthetic, Natural, Natural-identical)

Aroma Aromatics and Flavours, BASF SE, Bell Flavors and Fragrances, Bordas SA, De Monchy Aromatics Ltd., DSM Firmenich AG, Ernesto Ventos SA, Eternis Fine Chemicals Ltd., Givaudan SA, Kao Corp., Lanxess AG, Norex Flavours Pvt Ltd, Oriental Aromatics Ltd., Privi Speciality Chemicals Ltd, PT Indesso Aroma, Symrise Group, Takasago International Corp., Technical Chemical Laboratories, TREATT Plc, Zeon Corp. are a few of the key vendors in the Aroma Chemicals market.

North America will register the highest growth rate of 37.7% among the other regions. Therefore, the Aroma Chemicals market in North America is expected to garner significant business opportunities for the vendors during the forecast period.

US, Canada, Mexico, China, India, Japan, South Korea, Indonesia, Australia, Germany, France, Switzerland, UK, Italy, Spain, Saudi Arabia, UAE, South Africa, Israel, Turkey, Brazil, Argentina, Chile

  • Rising demand for personal care and household products is the driving factor this market.

The Aroma Chemicals market vendors should focus on grabbing business opportunities from the Application segment as it accounted for the largest market share in the base year.
RIA - Research AI Assistant
Ask RIA
