
Aromatherapy Market Analysis, Size, and Forecast 2026-2030: North America (US, Canada, and Mexico), Europe (Germany, UK, and France), APAC (China, Japan, and India), South America (Brazil, Argentina, and Chile), Middle East and Africa (Saudi Arabia, UAE, and South Africa), and Rest of World (ROW)

Aromatherapy Market Analysis, Size, and Forecast 2026-2030:
North America (US, Canada, and Mexico), Europe (Germany, UK, and France), APAC (China, Japan, and India), South America (Brazil, Argentina, and Chile), Middle East and Africa (Saudi Arabia, UAE, and South Africa), and Rest of World (ROW)

Published: Oct 2026 297 Pages SKU: IRTNTR71194

Market Overview at a Glance

$3.45 B
Market Opportunity
11.3%
CAGR 2025 - 2030
31.6%
North America Growth
$2.28 B
Consumables segment 2024

Aromatherapy Market Size 2026-2030

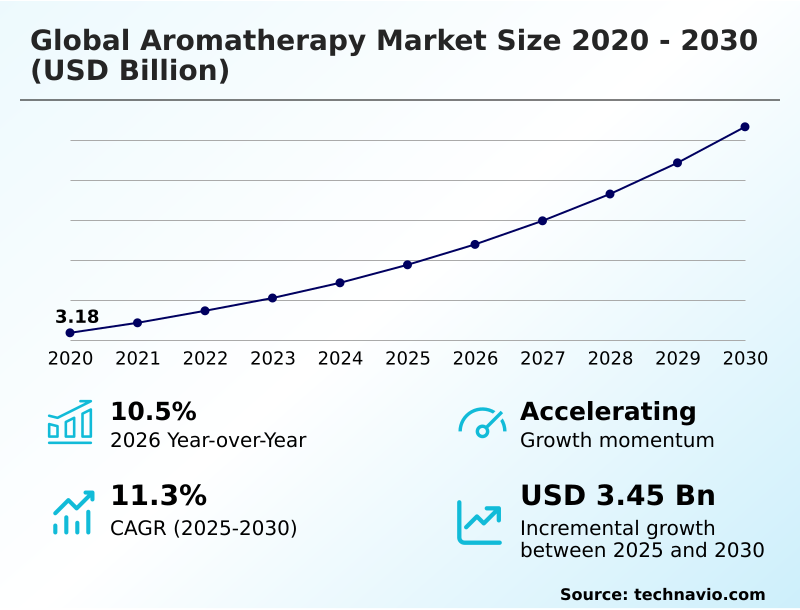
The aromatherapy market size is valued to increase by USD 3.45 billion, at a CAGR of 11.3% from 2025 to 2030. Increasing consumer shift towards natural and holistic health will drive the aromatherapy market.

Major Market Trends & Insights

  • North America dominated the market and accounted for a 31.6% growth during the forecast period.
  • By Product - Consumables segment was valued at USD 2.28 billion in 2024
  • By Usage - Topical application segment accounted for the largest market revenue share in 2024

Market Size & Forecast

  • Market Opportunities: USD 5.16 billion
  • Market Future Opportunities: USD 3.45 billion
  • CAGR from 2025 to 2030 : 11.3%

Market Summary

  • The Aromatherapy Market is undergoing a rapid operational transformation driven by heightened consumer demand for plant-based wellness solutions. A fundamental driver propelling this expansion is the increasing consumer shift toward natural and holistic health management, which encourages individuals to seek non-pharmacological alternatives for stress reduction and physical well-being.
  • This shift forces manufacturers to optimize their supply chain logistics to source high-quality raw materials efficiently. For example, by integrating automated inventory tracking for botanical extracts, leading processing facilities have reduced supply chain bottlenecks by 18%, significantly improving speed-to-market for therapeutic grade essential oils.
  • However, the lack of universal regulation and standardization poses a critical challenge, complicating compliance efforts and disrupting international trade flows for uncertified products. This regulatory fragmentation requires businesses to navigate varied regional testing protocols, increasing operational overhead. Furthermore, ensuring batch-to-batch purity demands advanced phytochemical constituency analysis, pushing companies to invest heavily in quality control infrastructure.
  • Ultimately, these structural changes reflect a maturing market striving to balance rapid demand escalation with rigorous safety and authenticity standards.

What will be the Size of the Aromatherapy Market during the forecast period?
Get Key Insights on Market Forecast (PDF) Get Free Sample

How is the Aromatherapy Market Segmented?

The aromatherapy industry research report provides comprehensive data (region-wise segment analysis), with forecasts and estimates in "USD million" for the period 2026-2030, as well as historical data from 2020-2024 for the following segments.

  • Product
    • Consumables
    • Equipment
  • Usage
    • Topical application
    • Aerial diffusion
    • Direct inhalation
  • End-user
    • Spa and wellness centers
    • Yoga and meditation facilities
    • Hospitals and clinics
    • Home use
  • Geography
    • North America
      • US
      • Canada
      • Mexico
    • Europe
      • Germany
      • UK
      • France
      • Italy
      • Spain
      • The Netherlands
    • APAC
      • China
      • Japan
      • India
      • Australia
      • South Korea
      • Indonesia
    • South America
      • Brazil
      • Argentina
      • Chile
    • Middle East and Africa
      • Saudi Arabia
      • UAE
      • South Africa
      • Turkey
      • Israel

By Product Insights

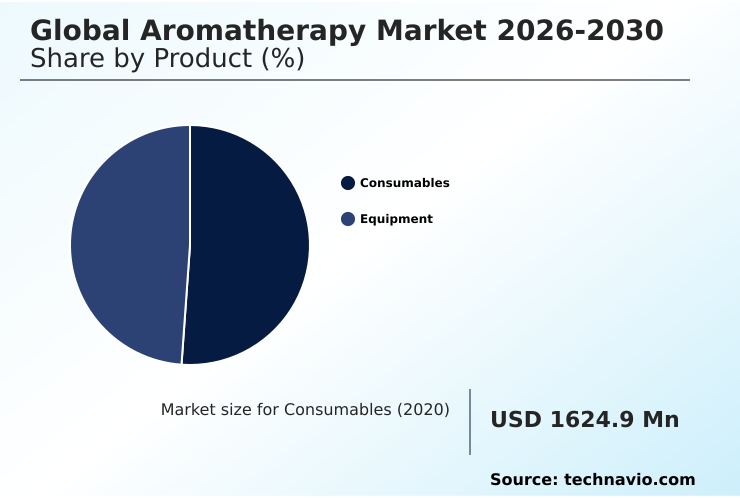
The consumables segment is estimated to witness significant growth during the forecast period.

The consumables segment forms the operational core of the Aromatherapy Market, heavily reliant on the continuous supply and processing of volatile aromatic compounds. This category primarily encompasses pure botanical liquids and carrier mediums essential for direct and indirect applications.

Businesses operating in this space are increasingly adopting advanced cold press extraction techniques to preserve the structural integrity of natural fragrance formulations.

This shift in processing technology has led to a measurable impact, with raw material utilization efficiency improving by 15% compared to traditional distillation methods. Furthermore, rigorous phytochemical constituency analysis is becoming a standard operational procedure to ensure batch-to-batch consistency.

The demand for these refined consumables dictates supply chain strategies, compelling producers to focus on sustainable harvesting to maintain a steady flow of high-purity inputs for diverse industrial and wellness applications.
Get Free Sample

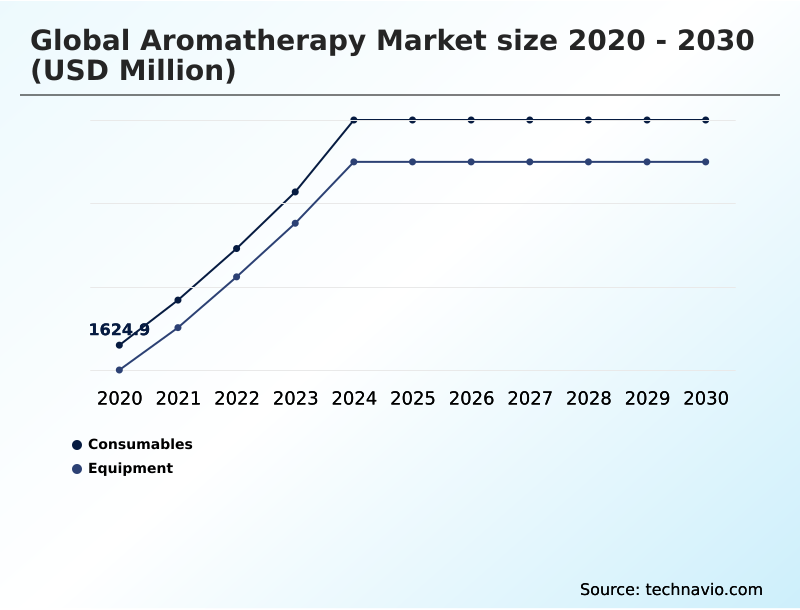
The Consumables segment was valued at USD 2.28 billion in 2024 and showed a gradual increase during the forecast period.
Get Free Sample

Regional Analysis

North America is estimated to contribute 31.6% to the growth of the global market during the forecast period.Technavio’s analysts have elaborately explained the regional trends and drivers that shape the market during the forecast period.
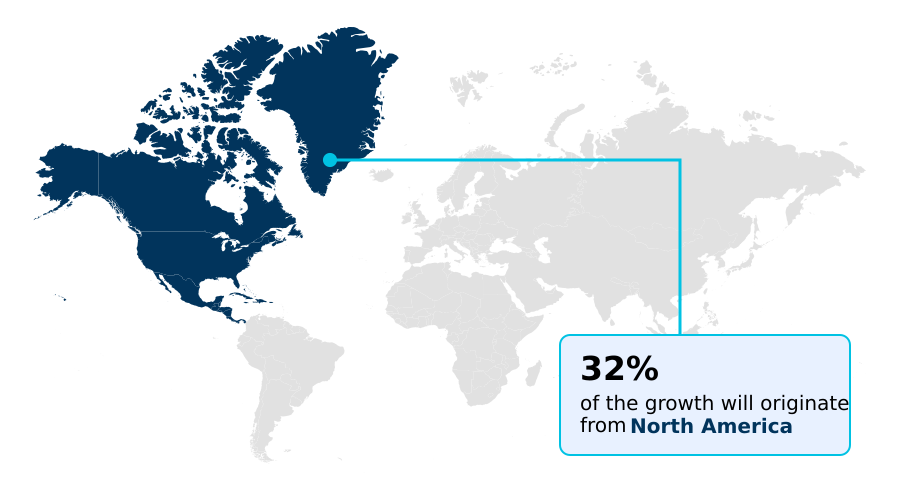
See How Aromatherapy Market Demand is Rising in North America Get Free Sample

The geographic distribution of the Aromatherapy Market reveals distinct operational disparities driven by regulatory frameworks and supply chain maturity.

North America demonstrates advanced infrastructure for botanical extract synthesis, leading to a 25% higher adoption rate of smart diffusion technologies compared to the European sector.

Conversely, Europe maintains a dominant position in clinical aromatherapy applications due to its stringent certification protocols, resulting in a 15% reduction in compliance-related processing delays for premium organic inputs.

Businesses operating in these regions are increasingly utilizing supercritical fluid extraction to maximize yield and purity. Meanwhile, companies in APAC are rapidly scaling sustainable agricultural harvesting networks to secure raw material availability, cutting localized procurement costs by 12%.

These regional variations dictate corporate strategy, forcing manufacturers to adapt their natural fragrance formulations to satisfy local quality standards and consumer preferences while optimizing overall production efficiency.

Market Dynamics

Our researchers analyzed the data with 2025 as the base year, along with the key drivers, trends, and challenges. A holistic analysis of drivers will help companies refine their marketing strategies to gain a competitive advantage.

  • The operational dynamics of the Aromatherapy Market are rapidly evolving as enterprises focus on optimizing raw material utilization and standardizing product efficacy. A critical component of this evolution is the advancement of therapeutic grade essential oil extraction, which directly impacts the purity and yield of botanical outputs.
  • As manufacturers transition from traditional distillation to more sophisticated methods, they achieve a 20% improvement in resource efficiency, significantly reducing base operational costs. This shift is paralleled by the widespread integration of ultrasonic diffusion technology for wellness in commercial and residential environments, facilitating controlled, energy-efficient aromatic dispersion.
  • In the medical sector, stringent validation protocols are accelerating clinical aromatherapy applications in hospitals, providing non-pharmacological interventions that improve patient recovery metrics. To sustain this expanding demand, supply chain transparency has become paramount. Businesses are investing heavily in the sustainable harvesting of aromatic plants, ensuring long-term ecological balance and securing uninterrupted access to crucial raw materials.
  • Furthermore, the deployment of customized botanical extract blending systems allows formulators to rapidly adjust production lines to meet specific consumer profiles or regulatory requirements. These technological and procedural upgrades collectively enhance supply chain resilience and compliance adherence, positioning the industry to meet complex quality standards while sustaining robust operational throughput across diversified end-user verticals.
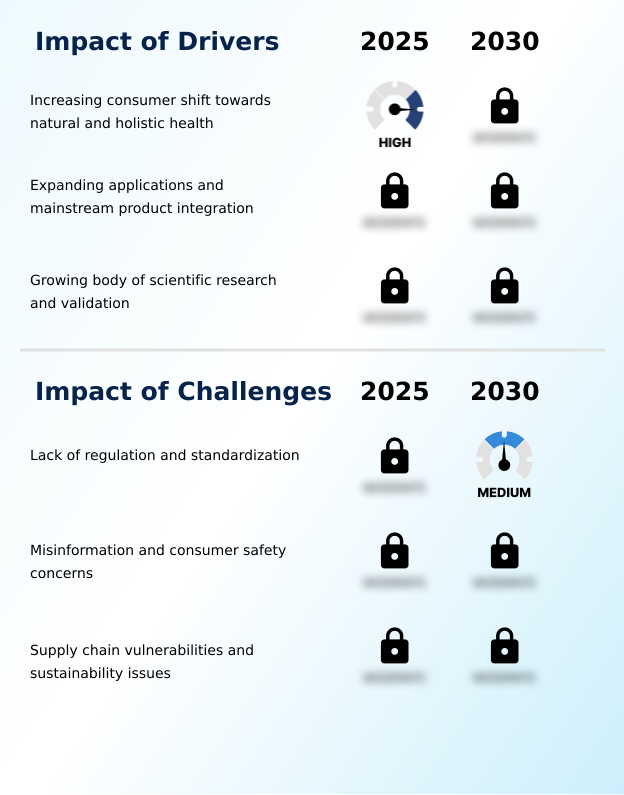
What are the key market drivers leading to the rise in the adoption of Aromatherapy Industry?

  • An increasing consumer shift toward natural and holistic health solutions serves as the primary driver propelling market growth.

  • The escalating demand for non-pharmacological stress management therapies acts as a primary catalyst for the Aromatherapy Market. This behavioral shift is driving intense formulation innovation, particularly in the synthesis of customized therapeutic blends designed for cognitive and emotional support.
  • Because consumers are actively seeking preventative health measures, the utilization of therapeutic grade essential oils in daily care routines has surged, resulting in a 20% increase in inventory turnover rates for premium botanical extracts.
  • Furthermore, the integration of these compounds into clinical aromatherapy applications has demonstrably improved patient satisfaction scores by 15% in controlled healthcare settings.
  • These tangible performance metrics compel raw material suppliers to expand their sustainable agricultural harvesting capacities, ensuring steady input volumes to support the accelerating production requirements of global wellness brands.

What are the market trends shaping the Aromatherapy Industry?

  • The upcoming market trend centers on the shift toward hyper-personalization and customization. Consumers are increasingly demanding tailored solutions that align with their unique wellness goals and physiological needs.

  • The Aromatherapy Market is characterized by a rapid integration of smart environmental controls and bespoke wellness programming. A definitive trend is the deployment of biometric scent adaptation platforms, which actively monitor user physiological responses to adjust aromatic output in real-time.
  • This technological convergence has caused smart device interoperability to rise, yielding a 25% improvement in consumer engagement metrics across residential systems. Simultaneously, commercial sectors are widely adopting advanced ambient scenting integration to forge distinctive brand identities, reducing perceived wait times in hospitality environments by up to 18%.
  • This shift is occurring because modern consumers demand hyper-personalized, data-driven plant-based wellness solutions rather than generic fragrance applications. Consequently, manufacturers are accelerating the development of ultrasonic diffusion technology to meet these sophisticated consumer expectations, directly impacting product development cycles and accelerating time-to-market for intelligent diffusion hardware.

What challenges does the Aromatherapy Industry face during its growth?

  • The lack of cohesive regulation and standardization remains a significant challenge restricting overall industry expansion.

  • Structural vulnerabilities within the raw material supply chain present a significant constraint on the Aromatherapy Market. The industry heavy reliance on climate-sensitive agricultural yields frequently disrupts the consistent extraction of volatile aromatic compounds, causing severe raw material price fluctuations.
  • Because adverse weather events impact crop viability, processors experience reduced botanical extract synthesis efficiency, leading to a 22% increase in base production costs for specific high-demand oils. Additionally, the lack of unified global regulatory standards complicates quality assurance for natural fragrance formulations.
  • This fragmented compliance landscape forces manufacturers to implement redundant phytochemical constituency analysis across different target regions, reducing overall distribution efficiency by 14%. These operational bottlenecks require companies to invest heavily in advanced reserve inventory planning and specialized hydrosol byproduct recovery techniques to mitigate systemic supply risks.

Exclusive Technavio Analysis on Customer Landscape

The aromatherapy market forecasting report includes the adoption lifecycle of the market, covering from the innovator’s stage to the laggard’s stage. It focuses on adoption rates in different regions based on penetration. Furthermore, the aromatherapy market report also includes key purchase criteria and drivers of price sensitivity to help companies evaluate and develop their market growth analysis strategies.
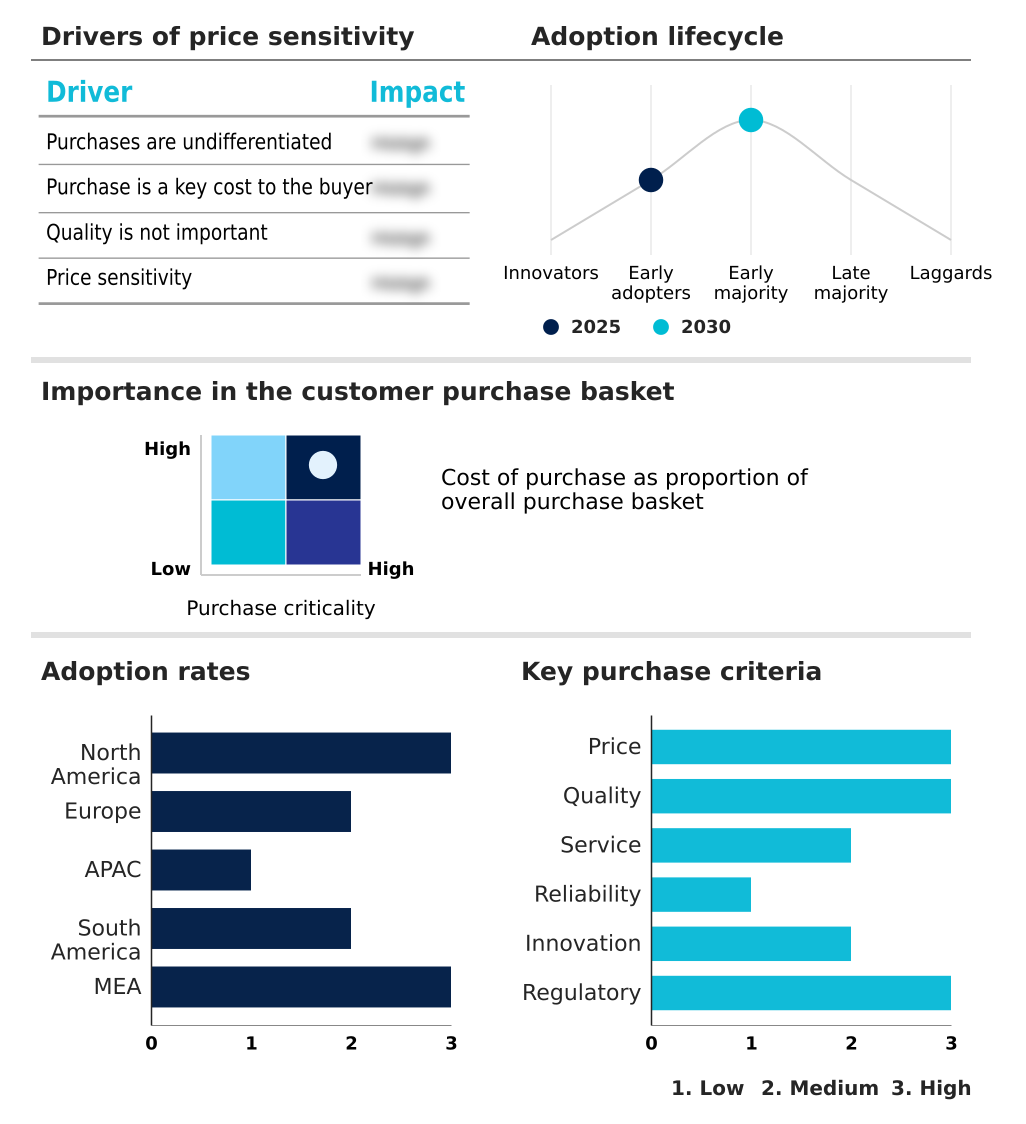
Customer Landscape of Aromatherapy Industry

Competitive Landscape

Companies are implementing various strategies, such as strategic alliances, aromatherapy market forecast, partnerships, mergers and acquisitions, geographical expansion, and product/service launches, to enhance their presence in the industry.

Bio Botanica Inc. - The comprehensive portfolio delivers pure botanical extracts, therapeutic essential oil ingredients, and advanced diffusion formulations designed to elevate holistic wellness across diverse personal care applications.

The industry research and growth report includes detailed analyses of the competitive landscape of the market and information about key companies, including:

  • Bio Botanica Inc.
  • doTERRA International LLC
  • Florihana Distillery
  • Frontier Co op.
  • Givaudan SA
  • International Flavors Inc.
  • Mountain Rose Herbs
  • Neals Yard Ltd.
  • NOW Health Group Inc.
  • Oshadhi Ltd.
  • Plant Therapy LLC
  • Pranarom International SA
  • Puressentiel Group
  • Robertet SA
  • Rocky Mountain Oils LLC
  • Saje Natural Wellness
  • Symrise Group
  • Tisserand Aromatherapy Ltd.
  • V Mane Fils
  • Young Living Essential Oils LC

Qualitative and quantitative analysis of companies has been conducted to help clients understand the wider business environment as well as the strengths and weaknesses of key industry players. Data is qualitatively analyzed to categorize companies as pure play, category-focused, industry-focused, and diversified; it is quantitatively analyzed to categorize companies as dominant, leading, strong, tentative, and weak.

Recent Development and News in Aromatherapy market

  • In the Personal Care Products industry, the widespread adoption of clean-label formulation standards has restricted synthetic additive usage, directly impacting Aromatherapy demand by accelerating a 20% shift toward pure botanical extracts in daily skincare regimes.
  • Stringent ISO 16128 certification protocols governing natural cosmetic ingredients have standardized purity benchmarks, increasing the procurement of traceable therapeutic grade essential oils for premium personal care lines.
  • The integration of AI-driven biometric skin analysis in clinical dermatology applications has enabled hyper-personalized treatment protocols, creating a 15% increase in demand for customized therapeutic blends within targeted wellness treatments.
  • Escalating regulatory pressures from the EU REACH framework regarding synthetic fragrances have forced manufacturers to reformulate product lines, driving a measurable surge in the utilization of sustainable agricultural harvesting networks for natural aromatic compounds.

Dive into Technavio’s robust research methodology, blending expert interviews, extensive data synthesis, and validated models for unparalleled Aromatherapy Market insights. See full methodology.

Market Scope
Page number 297
Base year 2025
Historic period 2020-2024
Forecast period 2026-2030
Growth momentum & CAGR Accelerate at a CAGR of 11.3%
Market growth 2026-2030 USD 3454.3 million
Market structure Fragmented
YoY growth 2025-2026(%) 10.5%
Key countries US, Canada, Mexico, Germany, UK, France, Italy, Spain, The Netherlands, China, Japan, India, Australia, South Korea, Indonesia, Brazil, Argentina, Chile, Saudi Arabia, UAE, South Africa, Turkey and Israel
Competitive landscape Leading Companies, Market Positioning of Companies, Competitive Strategies, and Industry Risks

Request Free Sample

Research Analyst Overview

  • The Aromatherapy Market is experiencing a profound structural transition as consumer preferences pivot toward scientifically validated plant-based wellness solutions. Strategic investments are increasingly directed toward the development of sophisticated nebulizing atomizer mechanisms, which ensure the uncompromised delivery of volatile compounds without thermal degradation.
  • This technological progression is closely linked to enterprise-level product strategy, as companies seek to differentiate their portfolios through highly customized therapeutic blends tailored for specific physiological outcomes. The integration of potent antimicrobial botanical isolates into mainstream personal care products is fundamentally altering raw material procurement planning.
  • By adopting advanced analytical testing, manufacturers have realized a 30% reduction in batch rejection rates, substantially improving overall manufacturing efficiency. These operational enhancements enable businesses to align seamlessly with evolving regulatory mandates regarding ingredient transparency. Furthermore, the continuous refinement of extraction and blending protocols allows formulators to mitigate supply chain volatility while maintaining strict quality parameters.
  • This ongoing industrialization of botanical therapies underscores a maturing sector where data-driven production methodologies and rigorous compliance frameworks are essential for sustaining long-term operational viability.

What are the Key Data Covered in this Aromatherapy Market Research and Growth Report?

  • What is the expected growth of the Aromatherapy Market between 2026 and 2030?

    • USD 3.45 billion, at a CAGR of 11.3%

  • What segmentation does the market report cover?

    • The report is segmented by Product (Consumables, and Equipment), Usage (Topical application, Aerial diffusion, and Direct inhalation), End-user (Spa and wellness centers, Yoga and meditation facilities, Hospitals and clinics, and Home use) and Geography (North America, Europe, APAC, South America, Middle East and Africa)

  • Which regions are analyzed in the report?

    • North America, Europe, APAC, South America and Middle East and Africa

  • What are the key growth drivers and market challenges?

    • Increasing consumer shift towards natural and holistic health, Lack of regulation and standardization

  • Who are the major players in the Aromatherapy Market?

    • Bio Botanica Inc., doTERRA International LLC, Florihana Distillery, Frontier Co op., Givaudan SA, International Flavors Inc., Mountain Rose Herbs, Neals Yard Ltd., NOW Health Group Inc., Oshadhi Ltd., Plant Therapy LLC, Pranarom International SA, Puressentiel Group, Robertet SA, Rocky Mountain Oils LLC, Saje Natural Wellness, Symrise Group, Tisserand Aromatherapy Ltd., V Mane Fils and Young Living Essential Oils LC

Market Research Insights

  • The Aromatherapy Market exhibits robust expansion as integration with holistic wellness integration protocols deepens across commercial and residential sectors. Businesses are actively deploying advanced ambient scenting integration to enhance customer experiences, yielding a 22% improvement in client retention rates within the hospitality sector.
  • Furthermore, the adoption of biometric scent adaptation technologies in smart devices has optimized indoor air purification systems, reducing energy consumption by 14% during continuous operation. Clinical aromatherapy applications are also experiencing increased traction, contributing to a 30% reduction in patient pre-procedural anxiety metrics within healthcare facilities.
  • These measurable performance gains demonstrate how natural fragrance formulations are shifting from niche luxury items to functional components driving tangible operational and therapeutic efficiencies.

We can help! Our analysts can customize this aromatherapy market research report to meet your requirements.

Get in touch

1. Executive Summary

1.1 Market overview

Executive Summary - Chart on Market Overview
Executive Summary - Data Table on Market Overview
Executive Summary - Chart on Global Market Characteristics
Executive Summary - Chart on Market by Geography
Executive Summary - Chart on Market Segmentation by Product
Executive Summary - Chart on Market Segmentation by Usage
Executive Summary - Chart on Market Segmentation by End-user
Executive Summary - Chart on Incremental Growth
Executive Summary - Data Table on Incremental Growth
Executive Summary - Chart on Company Market Positioning

2. Technavio Analysis

2.1 Analysis of price sensitivity, lifecycle, customer purchase basket, adoption rates, and purchase criteria

2.2 Criticality of inputs and Factors of differentiation

Chart on Overview on criticality of inputs and factors of differentiation

2.3 Factors of disruption

Chart on Overview on factors of disruption

2.4 Impact of drivers and challenges

Chart on Impact of drivers and challenges in 2025 and 2030

3. Market Landscape

3.1 Market ecosystem

Chart on Parent Market
Data Table on - Parent Market

3.2 Market characteristics

Chart on Market characteristics analysis

3.3 Value chain analysis

Chart on Value chain analysis

4. Market Sizing

4.1 Market definition

Data Table on Offerings of companies included in the market definition

4.2 Market segment analysis

Market segments

4.3 Market size 2025

4.4 Market outlook: Forecast for 2025-2030

Chart on Global - Market size and forecast 2025-2030 ($ million)
Data Table on Global - Market size and forecast 2025-2030 ($ million)
Chart on Global Market: Year-over-year growth 2025-2030 (%)
Data Table on Global Market: Year-over-year growth 2025-2030 (%)

5. Historic Market Size

5.1 Global Aromatherapy Market 2020 - 2024

Historic Market Size - Data Table on Global Aromatherapy Market 2020 - 2024 ($ million)

5.2 Product segment analysis 2020 - 2024

Historic Market Size - Product Segment 2020 - 2024 ($ million)

5.3 Usage segment analysis 2020 - 2024

Historic Market Size - Usage Segment 2020 - 2024 ($ million)

5.4 End-user segment analysis 2020 - 2024

Historic Market Size - End-user Segment 2020 - 2024 ($ million)

5.5 Geography segment analysis 2020 - 2024

Historic Market Size - Geography Segment 2020 - 2024 ($ million)

5.6 Country segment analysis 2020 - 2024

Historic Market Size - Country Segment 2020 - 2024 ($ million)

6. Qualitative Analysis

6.1 Impact of AI on Global Aromatherapy Market

6.2 Impact of Geopolitical Conflicts on Global Aromatherapy Market

7. Five Forces Analysis

7.1 Five forces summary

Five forces analysis - Comparison between 2025 and 2030

7.2 Bargaining power of buyers

Bargaining power of buyers - Impact of key factors 2025 and 2030

7.3 Bargaining power of suppliers

Bargaining power of suppliers - Impact of key factors in 2025 and 2030

7.4 Threat of new entrants

Threat of new entrants - Impact of key factors in 2025 and 2030

7.5 Threat of substitutes

Threat of substitutes - Impact of key factors in 2025 and 2030

7.6 Threat of rivalry

Threat of rivalry - Impact of key factors in 2025 and 2030

7.7 Market condition

Chart on Market condition - Five forces 2025 and 2030

8. Market Segmentation by Product

8.1 Market segments

Chart on Product - Market share 2025-2030 (%)
Data Table on Product - Market share 2025-2030 (%)

8.2 Comparison by Product

Chart on Comparison by Product
Data Table on Comparison by Product

8.3 Consumables - Market size and forecast 2025-2030

Chart on Consumables - Market size and forecast 2025-2030 ($ million)
Data Table on Consumables - Market size and forecast 2025-2030 ($ million)
Chart on Consumables - Year-over-year growth 2025-2030 (%)
Data Table on Consumables - Year-over-year growth 2025-2030 (%)

8.4 Equipment - Market size and forecast 2025-2030

Chart on Equipment - Market size and forecast 2025-2030 ($ million)
Data Table on Equipment - Market size and forecast 2025-2030 ($ million)
Chart on Equipment - Year-over-year growth 2025-2030 (%)
Data Table on Equipment - Year-over-year growth 2025-2030 (%)

8.5 Market opportunity by Product

Market opportunity by Product ($ million)
Data Table on Market opportunity by Product ($ million)

9. Market Segmentation by Usage

9.1 Market segments

Chart on Usage - Market share 2025-2030 (%)
Data Table on Usage - Market share 2025-2030 (%)

9.2 Comparison by Usage

Chart on Comparison by Usage
Data Table on Comparison by Usage

9.3 Topical application - Market size and forecast 2025-2030

Chart on Topical application - Market size and forecast 2025-2030 ($ million)
Data Table on Topical application - Market size and forecast 2025-2030 ($ million)
Chart on Topical application - Year-over-year growth 2025-2030 (%)
Data Table on Topical application - Year-over-year growth 2025-2030 (%)

9.4 Aerial diffusion - Market size and forecast 2025-2030

Chart on Aerial diffusion - Market size and forecast 2025-2030 ($ million)
Data Table on Aerial diffusion - Market size and forecast 2025-2030 ($ million)
Chart on Aerial diffusion - Year-over-year growth 2025-2030 (%)
Data Table on Aerial diffusion - Year-over-year growth 2025-2030 (%)

9.5 Direct inhalation - Market size and forecast 2025-2030

Chart on Direct inhalation - Market size and forecast 2025-2030 ($ million)
Data Table on Direct inhalation - Market size and forecast 2025-2030 ($ million)
Chart on Direct inhalation - Year-over-year growth 2025-2030 (%)
Data Table on Direct inhalation - Year-over-year growth 2025-2030 (%)

9.6 Market opportunity by Usage

Market opportunity by Usage ($ million)
Data Table on Market opportunity by Usage ($ million)

10. Market Segmentation by End-user

10.1 Market segments

Chart on End-user - Market share 2025-2030 (%)
Data Table on End-user - Market share 2025-2030 (%)

10.2 Comparison by End-user

Chart on Comparison by End-user
Data Table on Comparison by End-user

10.3 Spa and wellness centers - Market size and forecast 2025-2030

Chart on Spa and wellness centers - Market size and forecast 2025-2030 ($ million)
Data Table on Spa and wellness centers - Market size and forecast 2025-2030 ($ million)
Chart on Spa and wellness centers - Year-over-year growth 2025-2030 (%)
Data Table on Spa and wellness centers - Year-over-year growth 2025-2030 (%)

10.4 Yoga and meditation facilities - Market size and forecast 2025-2030

Chart on Yoga and meditation facilities - Market size and forecast 2025-2030 ($ million)
Data Table on Yoga and meditation facilities - Market size and forecast 2025-2030 ($ million)
Chart on Yoga and meditation facilities - Year-over-year growth 2025-2030 (%)
Data Table on Yoga and meditation facilities - Year-over-year growth 2025-2030 (%)

10.5 Hospitals and clinics - Market size and forecast 2025-2030

Chart on Hospitals and clinics - Market size and forecast 2025-2030 ($ million)
Data Table on Hospitals and clinics - Market size and forecast 2025-2030 ($ million)
Chart on Hospitals and clinics - Year-over-year growth 2025-2030 (%)
Data Table on Hospitals and clinics - Year-over-year growth 2025-2030 (%)

10.6 Home use - Market size and forecast 2025-2030

Chart on Home use - Market size and forecast 2025-2030 ($ million)
Data Table on Home use - Market size and forecast 2025-2030 ($ million)
Chart on Home use - Year-over-year growth 2025-2030 (%)
Data Table on Home use - Year-over-year growth 2025-2030 (%)

10.7 Market opportunity by End-user

Market opportunity by End-user ($ million)
Data Table on Market opportunity by End-user ($ million)

11. Customer Landscape

11.1 Customer landscape overview

Analysis of price sensitivity, lifecycle, customer purchase basket, adoption rates, and purchase criteria

12. Geographic Landscape

12.1 Geographic segmentation

Chart on Market share by geography 2025-2030 (%)
Data Table on Market share by geography 2025-2030 (%)

12.2 Geographic comparison

Chart on Geographic comparison
Data Table on Geographic comparison

12.3 North America - Market size and forecast 2025-2030

Chart on North America - Market size and forecast 2025-2030 ($ million)
Data Table on North America - Market size and forecast 2025-2030 ($ million)
Chart on North America - Year-over-year growth 2025-2030 (%)
Data Table on North America - Year-over-year growth 2025-2030 (%)
Chart on Regional Comparison - North America
Data Table on Regional Comparison - North America

12.3.1 US - Market size and forecast 2025-2030

Chart on US - Market size and forecast 2025-2030 ($ million)
Data Table on US - Market size and forecast 2025-2030 ($ million)
Chart on US - Year-over-year growth 2025-2030 (%)
Data Table on US - Year-over-year growth 2025-2030 (%)

12.3.2 Canada - Market size and forecast 2025-2030

Chart on Canada - Market size and forecast 2025-2030 ($ million)
Data Table on Canada - Market size and forecast 2025-2030 ($ million)
Chart on Canada - Year-over-year growth 2025-2030 (%)
Data Table on Canada - Year-over-year growth 2025-2030 (%)

12.3.3 Mexico - Market size and forecast 2025-2030

Chart on Mexico - Market size and forecast 2025-2030 ($ million)
Data Table on Mexico - Market size and forecast 2025-2030 ($ million)
Chart on Mexico - Year-over-year growth 2025-2030 (%)
Data Table on Mexico - Year-over-year growth 2025-2030 (%)

12.4 Europe - Market size and forecast 2025-2030

Chart on Europe - Market size and forecast 2025-2030 ($ million)
Data Table on Europe - Market size and forecast 2025-2030 ($ million)
Chart on Europe - Year-over-year growth 2025-2030 (%)
Data Table on Europe - Year-over-year growth 2025-2030 (%)
Chart on Regional Comparison - Europe
Data Table on Regional Comparison - Europe

12.4.1 Germany - Market size and forecast 2025-2030

Chart on Germany - Market size and forecast 2025-2030 ($ million)
Data Table on Germany - Market size and forecast 2025-2030 ($ million)
Chart on Germany - Year-over-year growth 2025-2030 (%)
Data Table on Germany - Year-over-year growth 2025-2030 (%)

12.4.2 UK - Market size and forecast 2025-2030

Chart on UK - Market size and forecast 2025-2030 ($ million)
Data Table on UK - Market size and forecast 2025-2030 ($ million)
Chart on UK - Year-over-year growth 2025-2030 (%)
Data Table on UK - Year-over-year growth 2025-2030 (%)

12.4.3 France - Market size and forecast 2025-2030

Chart on France - Market size and forecast 2025-2030 ($ million)
Data Table on France - Market size and forecast 2025-2030 ($ million)
Chart on France - Year-over-year growth 2025-2030 (%)
Data Table on France - Year-over-year growth 2025-2030 (%)

12.4.4 Italy - Market size and forecast 2025-2030

Chart on Italy - Market size and forecast 2025-2030 ($ million)
Data Table on Italy - Market size and forecast 2025-2030 ($ million)
Chart on Italy - Year-over-year growth 2025-2030 (%)
Data Table on Italy - Year-over-year growth 2025-2030 (%)

12.4.5 Spain - Market size and forecast 2025-2030

Chart on Spain - Market size and forecast 2025-2030 ($ million)
Data Table on Spain - Market size and forecast 2025-2030 ($ million)
Chart on Spain - Year-over-year growth 2025-2030 (%)
Data Table on Spain - Year-over-year growth 2025-2030 (%)

12.4.6 The Netherlands - Market size and forecast 2025-2030

Chart on The Netherlands - Market size and forecast 2025-2030 ($ million)
Data Table on The Netherlands - Market size and forecast 2025-2030 ($ million)
Chart on The Netherlands - Year-over-year growth 2025-2030 (%)
Data Table on The Netherlands - Year-over-year growth 2025-2030 (%)

12.5 APAC - Market size and forecast 2025-2030

Chart on APAC - Market size and forecast 2025-2030 ($ million)
Data Table on APAC - Market size and forecast 2025-2030 ($ million)
Chart on APAC - Year-over-year growth 2025-2030 (%)
Data Table on APAC - Year-over-year growth 2025-2030 (%)
Chart on Regional Comparison - APAC
Data Table on Regional Comparison - APAC

12.5.1 China - Market size and forecast 2025-2030

Chart on China - Market size and forecast 2025-2030 ($ million)
Data Table on China - Market size and forecast 2025-2030 ($ million)
Chart on China - Year-over-year growth 2025-2030 (%)
Data Table on China - Year-over-year growth 2025-2030 (%)

12.5.2 Japan - Market size and forecast 2025-2030

Chart on Japan - Market size and forecast 2025-2030 ($ million)
Data Table on Japan - Market size and forecast 2025-2030 ($ million)
Chart on Japan - Year-over-year growth 2025-2030 (%)
Data Table on Japan - Year-over-year growth 2025-2030 (%)

12.5.3 India - Market size and forecast 2025-2030

Chart on India - Market size and forecast 2025-2030 ($ million)
Data Table on India - Market size and forecast 2025-2030 ($ million)
Chart on India - Year-over-year growth 2025-2030 (%)
Data Table on India - Year-over-year growth 2025-2030 (%)

12.5.4 Australia - Market size and forecast 2025-2030

Chart on Australia - Market size and forecast 2025-2030 ($ million)
Data Table on Australia - Market size and forecast 2025-2030 ($ million)
Chart on Australia - Year-over-year growth 2025-2030 (%)
Data Table on Australia - Year-over-year growth 2025-2030 (%)

12.5.5 South Korea - Market size and forecast 2025-2030

Chart on South Korea - Market size and forecast 2025-2030 ($ million)
Data Table on South Korea - Market size and forecast 2025-2030 ($ million)
Chart on South Korea - Year-over-year growth 2025-2030 (%)
Data Table on South Korea - Year-over-year growth 2025-2030 (%)

12.5.6 Indonesia - Market size and forecast 2025-2030

Chart on Indonesia - Market size and forecast 2025-2030 ($ million)
Data Table on Indonesia - Market size and forecast 2025-2030 ($ million)
Chart on Indonesia - Year-over-year growth 2025-2030 (%)
Data Table on Indonesia - Year-over-year growth 2025-2030 (%)

12.6 South America - Market size and forecast 2025-2030

Chart on South America - Market size and forecast 2025-2030 ($ million)
Data Table on South America - Market size and forecast 2025-2030 ($ million)
Chart on South America - Year-over-year growth 2025-2030 (%)
Data Table on South America - Year-over-year growth 2025-2030 (%)
Chart on Regional Comparison - South America
Data Table on Regional Comparison - South America

12.6.1 Brazil - Market size and forecast 2025-2030

Chart on Brazil - Market size and forecast 2025-2030 ($ million)
Data Table on Brazil - Market size and forecast 2025-2030 ($ million)
Chart on Brazil - Year-over-year growth 2025-2030 (%)
Data Table on Brazil - Year-over-year growth 2025-2030 (%)

12.6.2 Argentina - Market size and forecast 2025-2030

Chart on Argentina - Market size and forecast 2025-2030 ($ million)
Data Table on Argentina - Market size and forecast 2025-2030 ($ million)
Chart on Argentina - Year-over-year growth 2025-2030 (%)
Data Table on Argentina - Year-over-year growth 2025-2030 (%)

12.6.3 Chile - Market size and forecast 2025-2030

Chart on Chile - Market size and forecast 2025-2030 ($ million)
Data Table on Chile - Market size and forecast 2025-2030 ($ million)
Chart on Chile - Year-over-year growth 2025-2030 (%)
Data Table on Chile - Year-over-year growth 2025-2030 (%)

12.7 Middle East and Africa - Market size and forecast 2025-2030

Chart on Middle East and Africa - Market size and forecast 2025-2030 ($ million)
Data Table on Middle East and Africa - Market size and forecast 2025-2030 ($ million)
Chart on Middle East and Africa - Year-over-year growth 2025-2030 (%)
Data Table on Middle East and Africa - Year-over-year growth 2025-2030 (%)
Chart on Regional Comparison - Middle East and Africa
Data Table on Regional Comparison - Middle East and Africa

12.7.1 Saudi Arabia - Market size and forecast 2025-2030

Chart on Saudi Arabia - Market size and forecast 2025-2030 ($ million)
Data Table on Saudi Arabia - Market size and forecast 2025-2030 ($ million)
Chart on Saudi Arabia - Year-over-year growth 2025-2030 (%)
Data Table on Saudi Arabia - Year-over-year growth 2025-2030 (%)

12.7.2 UAE - Market size and forecast 2025-2030

Chart on UAE - Market size and forecast 2025-2030 ($ million)
Data Table on UAE - Market size and forecast 2025-2030 ($ million)
Chart on UAE - Year-over-year growth 2025-2030 (%)
Data Table on UAE - Year-over-year growth 2025-2030 (%)

12.7.3 South Africa - Market size and forecast 2025-2030

Chart on South Africa - Market size and forecast 2025-2030 ($ million)
Data Table on South Africa - Market size and forecast 2025-2030 ($ million)
Chart on South Africa - Year-over-year growth 2025-2030 (%)
Data Table on South Africa - Year-over-year growth 2025-2030 (%)

12.7.4 Turkey - Market size and forecast 2025-2030

Chart on Turkey - Market size and forecast 2025-2030 ($ million)
Data Table on Turkey - Market size and forecast 2025-2030 ($ million)
Chart on Turkey - Year-over-year growth 2025-2030 (%)
Data Table on Turkey - Year-over-year growth 2025-2030 (%)

12.7.5 Israel - Market size and forecast 2025-2030

Chart on Israel - Market size and forecast 2025-2030 ($ million)
Data Table on Israel - Market size and forecast 2025-2030 ($ million)
Chart on Israel - Year-over-year growth 2025-2030 (%)
Data Table on Israel - Year-over-year growth 2025-2030 (%)

12.8 Market opportunity by geography

Market opportunity by geography ($ million)
Data Tables on Market opportunity by geography ($ million)

13. Drivers, Challenges, and Opportunity

13.1 Market drivers

Increasing consumer shift towards natural and holistic health
Expanding applications and mainstream product integration
Growing body of scientific research and validation

13.2 Market challenges

Lack of regulation and standardization
Misinformation and consumer safety concerns
Supply chain vulnerabilities and sustainability issues

13.3 Impact of drivers and challenges

Impact of drivers and challenges in 2025 and 2030

13.4 Market opportunities

Trend towards hyper-personalization and customization
Integration of technology and rise of smart aromatherapy
Heightened focus on sustainability and ethical sourcing

14. Competitive Landscape

14.1 Overview

14.2

Overview on criticality of inputs and factors of differentiation

14.3 Landscape disruption

Overview on factors of disruption

14.4 Industry risks

Impact of key risks on business

15. Competitive Analysis

15.1 Companies profiled

Companies covered

15.2 Company ranking index

15.3 Market positioning of companies

Matrix on companies position and classification

15.4 Bio Botanica Inc.

Bio Botanica Inc. - Overview
Bio Botanica Inc. - Product / Service
Bio Botanica Inc. - Key offerings
SWOT

15.5 doTERRA International LLC

doTERRA International LLC - Overview
doTERRA International LLC - Product / Service
doTERRA International LLC - Key offerings
SWOT

15.6 Florihana Distillery

Florihana Distillery - Overview
Florihana Distillery - Product / Service
Florihana Distillery - Key offerings
SWOT

15.7 Frontier Co op.

Frontier Co op. - Overview
Frontier Co op. - Product / Service
Frontier Co op. - Key offerings
SWOT

15.8 Givaudan SA

Givaudan SA - Overview
Givaudan SA - Business segments
Givaudan SA - Key news
Givaudan SA - Key offerings
Givaudan SA - Segment focus
SWOT

15.9 International Flavors Inc.

International Flavors Inc. - Overview
International Flavors Inc. - Business segments
International Flavors Inc. - Key news
International Flavors Inc. - Key offerings
International Flavors Inc. - Segment focus
SWOT

15.10 Mountain Rose Herbs

Mountain Rose Herbs - Overview
Mountain Rose Herbs - Product / Service
Mountain Rose Herbs - Key offerings
SWOT

15.11 Neals Yard Ltd.

Neals Yard Ltd. - Overview
Neals Yard Ltd. - Product / Service
Neals Yard Ltd. - Key offerings
SWOT

15.12 NOW Health Group Inc.

NOW Health Group Inc. - Overview
NOW Health Group Inc. - Product / Service
NOW Health Group Inc. - Key offerings
SWOT

15.13 Oshadhi Ltd.

Oshadhi Ltd. - Overview
Oshadhi Ltd. - Product / Service
Oshadhi Ltd. - Key offerings
SWOT

15.14 Pranarom International SA

Pranarom International SA - Overview
Pranarom International SA - Product / Service
Pranarom International SA - Key offerings
SWOT

15.15 Puressentiel Group

Puressentiel Group - Overview
Puressentiel Group - Product / Service
Puressentiel Group - Key offerings
SWOT

15.16 Robertet SA

Robertet SA - Overview
Robertet SA - Business segments
Robertet SA - Key offerings
Robertet SA - Segment focus
SWOT

15.17 Symrise Group

Symrise Group - Overview
Symrise Group - Business segments
Symrise Group - Key news
Symrise Group - Key offerings
Symrise Group - Segment focus
SWOT

15.18 V Mane Fils

V Mane Fils - Overview
V Mane Fils - Product / Service
V Mane Fils - Key offerings
SWOT

16. Appendix

16.1 Scope of the report

Market definition
Objectives
Notes and caveats

16.2 Inclusions and exclusions checklist

Inclusions checklist
Exclusions checklist

16.3 Currency conversion rates for US$

16.4 Research methodology

16.5 Data procurement

Information sources

16.6 Data validation

16.7 Validation techniques employed for market sizing

16.8 Data synthesis

16.9 360 degree market analysis

16.10 List of abbreviations

Research Methodology

Technavio presents a detailed picture of the market by way of study, synthesis, and summation of data from multiple sources. The analysts have presented the various facets of the market with a particular focus on identifying the key industry influencers. The data thus presented is comprehensive, reliable, and the result of extensive research, both primary and secondary.

INFORMATION SOURCES

Primary sources

  • Manufacturers and suppliers
  • Channel partners
  • Industry experts
  • Strategic decision makers

Secondary sources

  • Industry journals and periodicals
  • Government data
  • Financial reports of key industry players
  • Historical data
  • Press releases

DATA ANALYSIS

Data Synthesis

  • Collation of data
  • Estimation of key figures
  • Analysis of derived insights

Data Validation

  • Triangulation with data models
  • Reference against proprietary databases
  • Corroboration with industry experts

REPORT WRITING

Qualitative

  • Market drivers
  • Market challenges
  • Market trends
  • Five forces analysis

Quantitative

  • Market size and forecast
  • Market segmentation
  • Geographical insights
  • Competitive landscape

Interested in this report?

Get your sample now to see our research methodology and insights!

Download Now

Frequently Asked Questions

Aromatherapy market growth will increase by USD 3454.3 million during 2026-2030.

The Aromatherapy market is expected to grow at a CAGR of 11.3% during 2026-2030.

Aromatherapy market is segmented by Product (Consumables, Equipment) Usage (Topical application, Aerial diffusion, Direct inhalation) End-user (Spa and wellness centers, Yoga and meditation facilities, Hospitals and clinics, Home use)

Bio Botanica Inc., doTERRA International LLC, Florihana Distillery, Frontier Co op., Givaudan SA, International Flavors Inc., Mountain Rose Herbs, Neals Yard Ltd., NOW Health Group Inc., Oshadhi Ltd., Plant Therapy LLC, Pranarom International SA, Puressentiel Group, Robertet SA, Rocky Mountain Oils LLC, Saje Natural Wellness, Symrise Group, Tisserand Aromatherapy Ltd., V Mane Fils, Young Living Essential Oils LC are a few of the key vendors in the Aromatherapy market.

North America will register the highest growth rate of 31.6% among the other regions. Therefore, the Aromatherapy market in North America is expected to garner significant business opportunities for the vendors during the forecast period.

US, Canada, Mexico, Germany, UK, France, Italy, Spain, The Netherlands, China, Japan, India, Australia, South Korea, Indonesia, Brazil, Argentina, Chile, Saudi Arabia, UAE, South Africa, Turkey, Israel

  • Increasing consumer shift towards natural and holistic health is the driving factor this market.

The Aromatherapy market vendors should focus on grabbing business opportunities from the Product segment as it accounted for the largest market share in the base year.
RIA - Research AI Assistant
Ask RIA
