
Ascorbic Acid Market Analysis, Size, and Forecast 2026-2030: Europe (Germany, UK, and France), North America (US, Canada, and Mexico), APAC (China, India, and Japan), South America (Brazil, Argentina, and Chile), Middle East and Africa (Saudi Arabia, UAE, and South Africa), and Rest of World (ROW)

Ascorbic Acid Market Analysis, Size, and Forecast 2026-2030:
Europe (Germany, UK, and France), North America (US, Canada, and Mexico), APAC (China, India, and Japan), South America (Brazil, Argentina, and Chile), Middle East and Africa (Saudi Arabia, UAE, and South Africa), and Rest of World (ROW)

Published: Oct 2026 309 Pages SKU: IRTNTR40363

Market Overview at a Glance

$393.7 Mn
Market Opportunity
5.3%
CAGR 2025 - 2030
31.9%
North America Growth
$918.8 Mn
Powder segment 2024

Ascorbic Acid Market Size 2026-2030

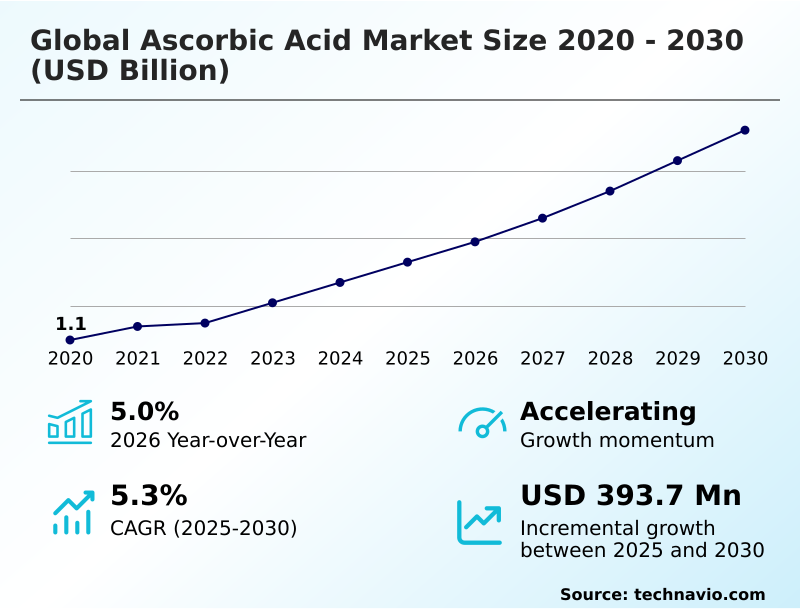
The ascorbic acid market size is valued to increase by USD 393.7 million, at a CAGR of 5.3% from 2025 to 2030. Rising health consciousness and demand for dietary supplements will drive the ascorbic acid market.

Major Market Trends & Insights

  • North America dominated the market and accounted for a 31.9% growth during the forecast period.
  • By Variant - Powder segment was valued at USD 918.8 million in 2024
  • By End-user - Pharmaceutical segment accounted for the largest market revenue share in 2024

Market Size & Forecast

  • Market Opportunities: USD 620.6 million
  • Market Future Opportunities: USD 393.7 million
  • CAGR from 2025 to 2030 : 5.3%

Market Summary

  • The Ascorbic Acid Market demonstrates robust structural expansion driven by intensifying consumer emphasis on preventive healthcare and nutritional supplementation. Dietary supplement manufacturers actively reformulate portfolios to accommodate the surge in immunity-focused consumer behavior, accelerating the procurement of high-purity organic compounds.
  • In automated baking operations, commercial facilities have achieved a 25% reduction in dough resting time by integrating advanced oxidation regulators, enhancing overall production throughput. The widespread integration of these molecules as clean-label preservatives acts as a primary catalyst, directly substituting synthetic alternatives in food processing.
  • Conversely, the inherent chemical instability of the compound presents a formidable challenge, as exposure to heat and moisture necessitates specialized microencapsulation technologies that elevate production expenditures. Procurement executives must navigate volatile agricultural commodity pricing, demanding agile supply chain optimization strategies to maintain operational margins.
  • Ultimately, the convergence of functional food innovation and stringent regulatory standards ensures continuous evolution within the commercial nutrition sector.

What will be the Size of the Ascorbic Acid Market during the forecast period?
Get Key Insights on Market Forecast (PDF) Get Free Sample

How is the Ascorbic Acid Market Segmented?

The ascorbic acid industry research report provides comprehensive data (region-wise segment analysis), with forecasts and estimates in "USD million" for the period 2026-2030, as well as historical data from 2020-2024 for the following segments.

  • Variant
    • Powder
    • Liquid
  • End-user
    • Pharmaceutical
    • Food and beverages
    • Personal care
    • Others
  • Type
    • Sodium ascorbate
    • Calcium ascorbate
    • Potassium ascorbate
    • Others
  • Geography
    • Europe
      • Germany
      • UK
      • France
      • Italy
      • Spain
      • The Netherlands
    • North America
      • US
      • Canada
      • Mexico
    • APAC
      • China
      • India
      • Japan
      • South Korea
      • Australia
      • Indonesia
    • South America
      • Brazil
      • Argentina
      • Chile
    • Middle East and Africa
      • Saudi Arabia
      • UAE
      • South Africa
      • Egypt
      • Turkey

By Variant Insights

The powder segment is estimated to witness significant growth during the forecast period.

Industrial powder variants dominate base applications through distinct operational advantages over liquid counterparts. Granular and crystalline formats exhibit superior shelf stability, reducing raw material waste by 18% during extended storage cycles.

Manufacturers utilize direct compression tableting and effervescent tableting techniques to streamline processing operations. Within the food sector, powder formats facilitate dough gluten cross-linking, optimizing structural integrity in commercial baking.

In dermo-cosmetics, specialized powders incorporated into an anhydrous silicone base effectively support tyrosinase enzyme inhibition. These dry formulations enhance the intracellular absorption rate of the active molecule.

Furthermore, industrial chemical synthesis relies on powder variants acting as a bio-based reducing agent to support various cellular metabolic processes safely. Consequently, dry powder remains the structural backbone of large-scale commercial formulation.
Get Free Sample

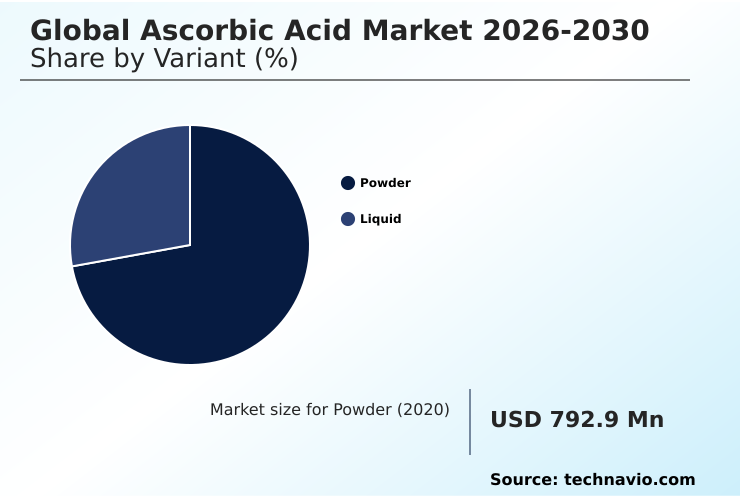
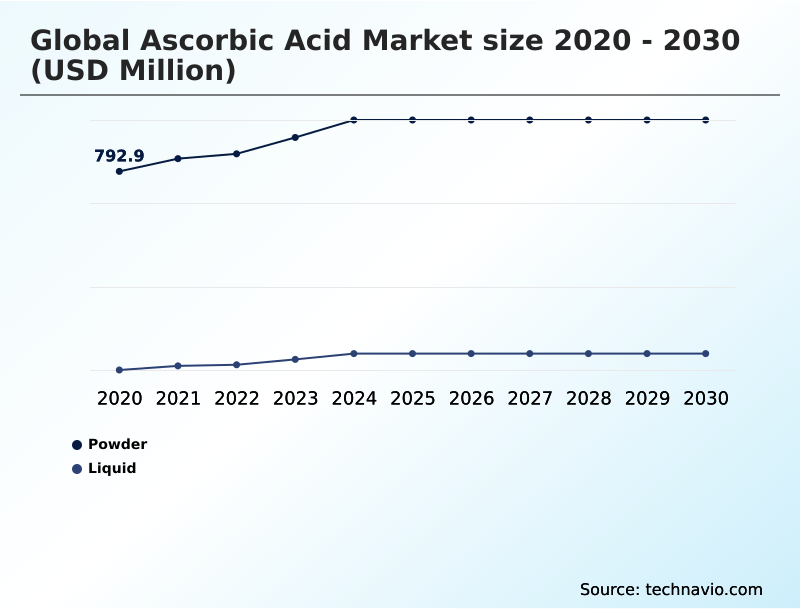
The Powder segment was valued at USD 918.8 million in 2024 and showed a gradual increase during the forecast period.
Get Free Sample

Regional Analysis

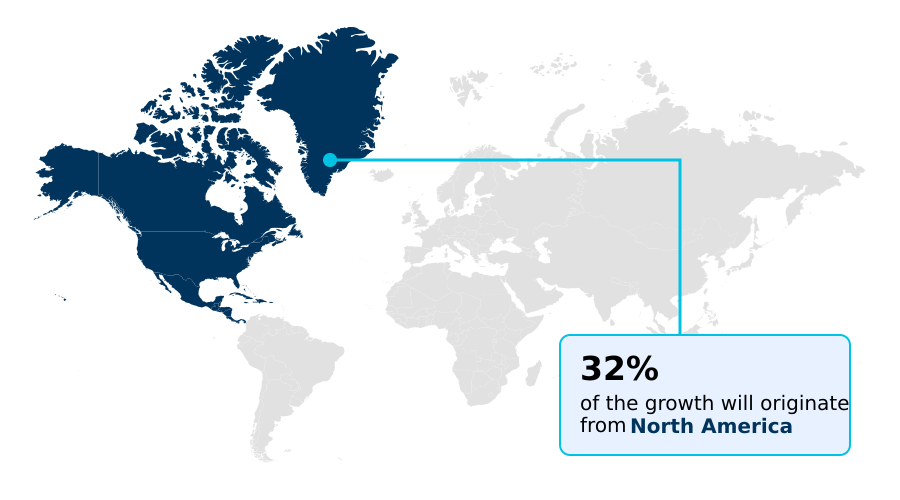
North America is estimated to contribute 31.9% to the growth of the global market during the forecast period.Technavio’s analysts have elaborately explained the regional trends and drivers that shape the market during the forecast period.
See How Ascorbic Acid Market Demand is Rising in North America Get Free Sample

The geographic landscape of the market exhibits distinct operational divergence, primarily characterized by specialized production and consumption patterns.

APAC maintains a robust manufacturing advantage, utilizing a scaled microbial fermentation process to achieve a 35% higher bio-fermentation yield compared to Western counterparts. This regional dominance supports extensive high-throughput automated processing networks.

Conversely, North America prioritizes specialized downstream applications, demonstrating a 20% greater adoption of pharmaceutical-grade crystallization. To mitigate heat stress in commercial agriculture, South American producers frequently deploy a polyphosphorylated derivative alongside a foliar antioxidant spray, boosting metabolic efficiency enhancement.

In Europe, strict clinical regulations favor advanced intravenous injection protocols, prioritizing rapid nitric oxide reduction in medical applications. By leveraging localized supply chain integrations, manufacturers adapt their distribution strategies to align with these contrasting regional utilization rates and operational requirements.

Market Dynamics

Our researchers analyzed the data with 2025 as the base year, along with the key drivers, trends, and challenges. A holistic analysis of drivers will help companies refine their marketing strategies to gain a competitive advantage.

  • The operational landscape of the Ascorbic Acid sector is rapidly advancing through sophisticated material science and biochemistry. Commercial manufacturers are fundamentally restructuring their product portfolios to prioritize superior bioavailability and targeted cellular delivery. The integration of liposomal encapsulated delivery mechanisms has transformed the dietary supplement segment, allowing companies to improve nutrient absorption rates by 40% compared to traditional oral formats.
  • In the food processing industry, the transition toward clean-label food preservation formulations enables brands to align with stringent regulatory frameworks while extending shelf life and eliminating synthetic additives. The cosmetics and personal care sectors actively leverage the collagen biosynthesis stimulation process to formulate high-performance dermatological serums that target visible aging.
  • Furthermore, specialized medical and nutritional applications require ultra-pure inputs, driving the widespread adoption of pharmaceutical grade crystallization techniques to guarantee absolute consistency and safety in critical clinical settings. Research and development teams are continuously exploring complex oxidative stress modulation pathways to engineer innovative therapeutic solutions for chronic health conditions.
  • By mapping these advanced delivery and synthesis frameworks directly to supply chain planning, procurement executives successfully mitigate raw material volatility. This strategic alignment ensures that manufacturing output consistently meets evolving regulatory parameters and rigorous quality assurance benchmarks across all major industrial applications.
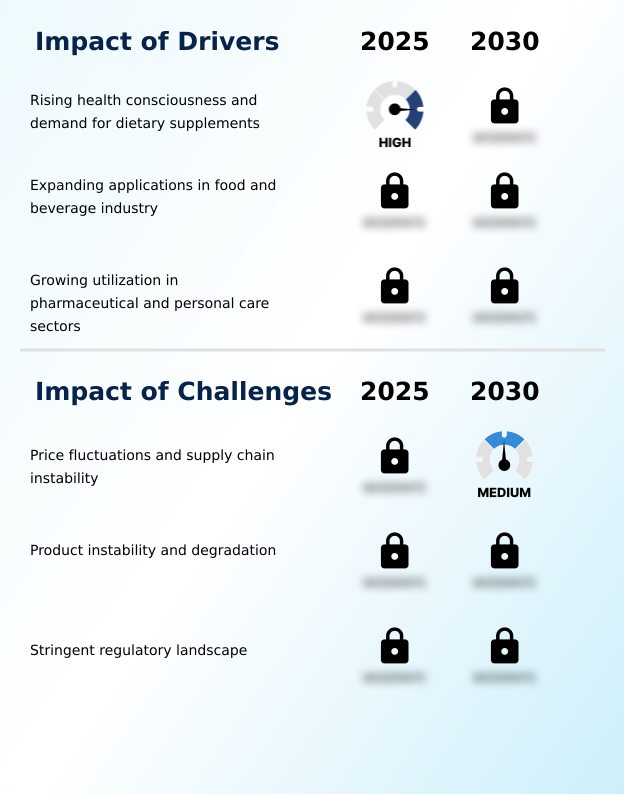
What are the key market drivers leading to the rise in the adoption of Ascorbic Acid Industry?

  • Rising health consciousness and the subsequent demand for dietary supplements represent the primary driver propelling expansion in the market.

  • Shifting global health paradigms accelerate the widespread commercial adoption of the Ascorbic Acid. Clinical recognition of the compound as a vital prolyl hydroxylase cofactor directly fuels demand for immune-supporting formulations.
  • Consumers actively seek a bioavailable vitamin complex to optimize their daily physiological resilience. This behavioral shift has expanded the clean-label formulation category, reducing reliance on synthetic preservatives by 22% across beverage manufacturing.
  • As a potent water-soluble antioxidant, the molecule provides essential free radical scavenging capabilities. The integration of a nutritional fortification matrix within staple foods addresses widespread micronutrient deficiencies.
  • By optimizing the bio-fermentation yield, primary producers have lowered operational energy use by 12%. Furthermore, its role in continuous collagen biosynthesis ensures sustained demand from the thriving therapeutic skincare sector.

What are the market trends shaping the Ascorbic Acid Industry?

  • The focus on sustainable and natural production methods constitutes an upcoming market trend. Manufacturers are increasingly adopting eco-friendly processes to meet evolving consumer and regulatory expectations.

  • Evolving formulation technologies fundamentally redefine the functional capabilities of the Ascorbic Acid across industrial sectors. The transition toward sophisticated lipid barrier structures has reduced premature ingredient degradation by 33%, ensuring optimal efficacy in targeted delivery. Formulators increasingly rely on liposomal encapsulation to shield active molecules from harsh gastrointestinal environments.
  • Furthermore, companies utilize time-release micro-pellets and microencapsulated granulation to achieve a 25% improvement in sustained physiological absorption. In liquid formulations, rigorous aqueous solution stabilization prevents discoloration and maintains potency. The personal care sector leverages macromolecular stabilization to formulate high-performance dermo-cosmetic serums. These advanced delivery systems directly address the inherent volatility of the compound, enhancing overall product reliability.
  • By implementing microfluidic stabilization, manufacturers successfully reduce processing downtime and streamline commercial blending operations.

What challenges does the Ascorbic Acid Industry face during its growth?

  • Price fluctuations and supply chain instability constitute a significant challenge impeding sustained industry growth.

  • The inherent molecular instability of the Ascorbic Acid creates severe operational bottlenecks throughout the commercial supply chain. Exposure to oxygen rapidly generates damaging reactive oxygen species, compromising product integrity. Without robust lipid bilayer protection, active compounds suffer a 40% reduction in potency during high-temperature manufacturing. To maintain an effective oxygen scavenging barrier, packaging facilities must implement expensive atmospheric control systems.
  • Formulators struggle with enzymatic discoloration prevention in aqueous matrices, forcing the adoption of costly biochemical degradation prevention techniques. The necessity for high thermal processing resistance complicates automated food extrusion processes. In the lipid sector, maintaining lipid rancidity prevention requires precise blending protocols. Ultimately, the complex oxidative stress modulation mechanisms demand rigorous quality assurance testing, directly elevating baseline manufacturing expenditures.

Exclusive Technavio Analysis on Customer Landscape

The ascorbic acid market forecasting report includes the adoption lifecycle of the market, covering from the innovator’s stage to the laggard’s stage. It focuses on adoption rates in different regions based on penetration. Furthermore, the ascorbic acid market report also includes key purchase criteria and drivers of price sensitivity to help companies evaluate and develop their market growth analysis strategies.
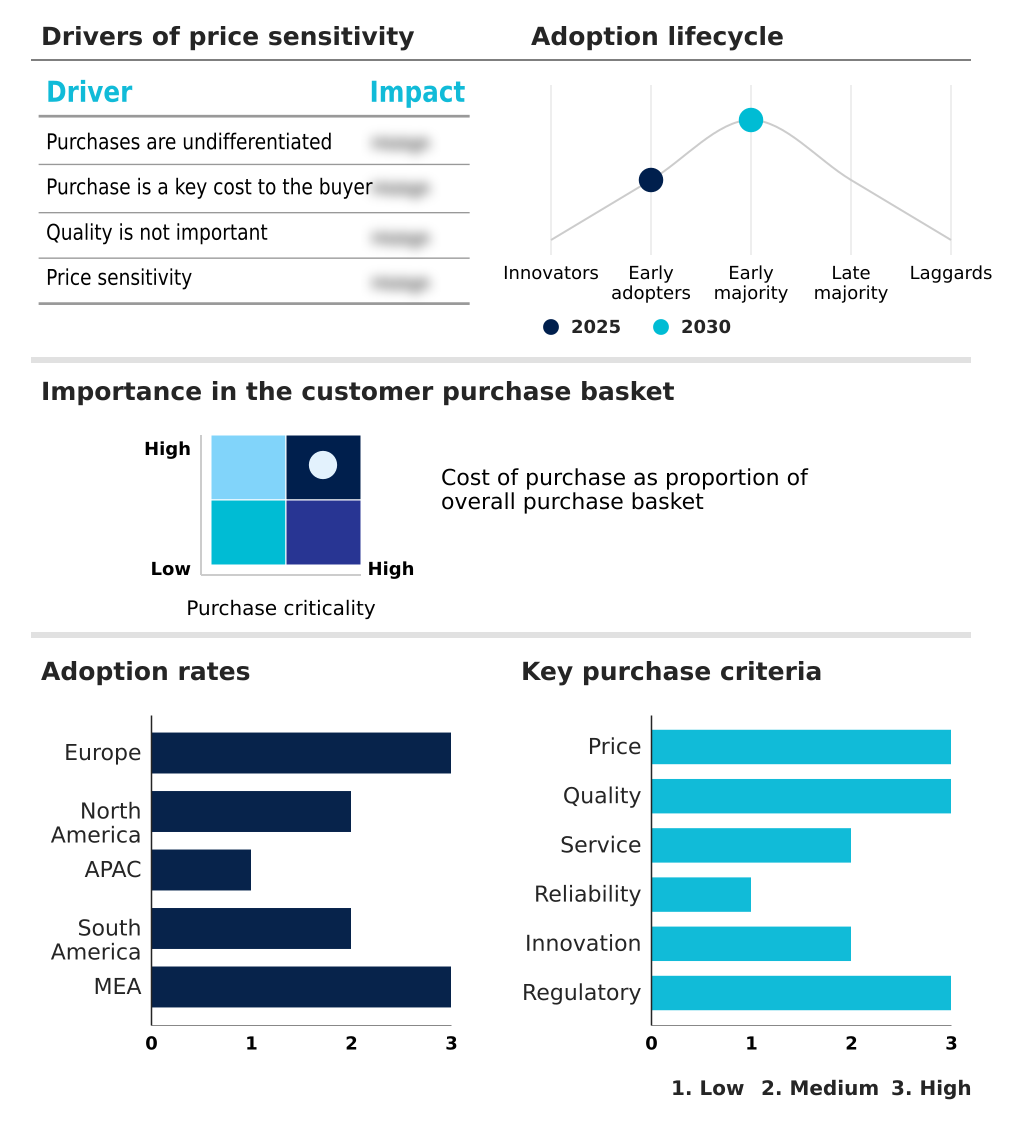
Customer Landscape of Ascorbic Acid Industry

Competitive Landscape

Companies are implementing various strategies, such as strategic alliances, ascorbic acid market forecast, partnerships, mergers and acquisitions, geographical expansion, and product/service launches, to enhance their presence in the industry.

Archer Daniels Midland Co. - Comprehensive nutrient premixes and isolated active components are provided, delivering functional ingredients specifically formulated to enhance nutritional profiles, extend product stability, and optimize commercial food processing operations.

The industry research and growth report includes detailed analyses of the competitive landscape of the market and information about key companies, including:

  • Archer Daniels Midland Co.
  • BASF SE
  • Bio Techne Corp.
  • CSPC Pharmaceutical Group Ltd.
  • DSM Firmenich AG
  • FoodChem International Corp.
  • Glanbia plc
  • MP Biomedicals Inc.
  • Northeast Pharmaceutical Group
  • Nutricost
  • Pharmavite LLC
  • Prinova Group LLC
  • Reckitt Benckiser Group Plc
  • Sigma Aldrich Chemicals Ltd.
  • Sinochem Group Co. Ltd.
  • Spectrum Chemical Mfg. Corp.
  • SternVitamin GmbH Co. KG
  • Thermo Fisher Scientific Inc.
  • Tokyo Chemical Industry Co.

Qualitative and quantitative analysis of companies has been conducted to help clients understand the wider business environment as well as the strengths and weaknesses of key industry players. Data is qualitatively analyzed to categorize companies as pure play, category-focused, industry-focused, and diversified; it is quantitatively analyzed to categorize companies as dominant, leading, strong, tentative, and weak.

Recent Development and News in Ascorbic acid market

  • In the Commodity Chemicals industry, stringent environmental regulations mandated a shift toward bio-based feedstocks, directly impacting Ascorbic Acid demand by accelerating the adoption of low-emission synthesis pathways and a cleaner microbial fermentation process.
  • In the Commodity Chemicals industry, advanced membrane separation technologies have improved purification efficiency by 22% in bulk chemical processing, enhancing the production scalability and bio-fermentation yield of Ascorbic Acid manufacturing.
  • In the Commodity Chemicals industry, the implementation of the EU Carbon Border Adjustment Mechanism (CBAM) has penalized fossil-derived chemical precursors, shifting procurement strategies toward renewable inputs and clean-label formulation components utilized in Ascorbic Acid supply chains.
  • In the Commodity Chemicals industry, the rapid expansion of sustainable packaging solutions has intensified competition for high-grade chemical solvents, indirectly shaping Ascorbic Acid operational expenditures by 14% and emphasizing the need for an efficient oxygen scavenging barrier.

Dive into Technavio’s robust research methodology, blending expert interviews, extensive data synthesis, and validated models for unparalleled Ascorbic Acid Market insights. See full methodology.

Market Scope
Page number 309
Base year 2025
Historic period 2020-2024
Forecast period 2026-2030
Growth momentum & CAGR Accelerate at a CAGR of 5.3%
Market growth 2026-2030 USD 393.7 million
Market structure Fragmented
YoY growth 2025-2026(%) 5.0%
Key countries Germany, UK, France, Italy, Spain, The Netherlands, US, Canada, Mexico, China, India, Japan, South Korea, Australia, Indonesia, Brazil, Argentina, Chile, Saudi Arabia, UAE, South Africa, Egypt and Turkey
Competitive landscape Leading Companies, Market Positioning of Companies, Competitive Strategies, and Industry Risks

Request Free Sample

Research Analyst Overview

  • The Ascorbic Acid sector is undergoing a profound structural evolution driven by the intersection of precision formulation and clinical efficacy. Formulators are increasingly deploying liposomal encapsulation to bypass gastrointestinal degradation, representing a critical shift in strategic product development. Boardrooms actively prioritize these advanced formats to command premium pricing tiers, ensuring compliance with strict clinical efficacy standards.
  • By shifting to these specialized formats, manufacturers have achieved a 30% reduction in active ingredient waste during final formulation stages. Furthermore, the integration of time-release micro-pellets and microencapsulated granulation enables sustained physiological absorption, directly addressing consumer demands for prolonged efficacy. To prevent rapid molecular breakdown in aqueous environments, companies utilize rigorous aqueous solution stabilization techniques.
  • In the personal care sector, macromolecular stabilization significantly enhances the performance of premium dermo-cosmetic serums. The strategic pivot toward sophisticated advanced delivery systems and microfluidic stabilization allows health brands to differentiate their portfolios comprehensively. This continuous refinement in material science directly supports long-term profitability and sustainable operational planning.

What are the Key Data Covered in this Ascorbic Acid Market Research and Growth Report?

  • What is the expected growth of the Ascorbic Acid Market between 2026 and 2030?

    • USD 393.7 million, at a CAGR of 5.3%

  • What segmentation does the market report cover?

    • The report is segmented by Variant (Powder, and Liquid), End-user (Pharmaceutical, Food and beverages, Personal care, and Others), Type (Sodium ascorbate, Calcium ascorbate, Potassium ascorbate, and Others) and Geography (Europe, North America, APAC, South America, Middle East and Africa)

  • Which regions are analyzed in the report?

    • Europe, North America, APAC, South America and Middle East and Africa

  • What are the key growth drivers and market challenges?

    • Rising health consciousness and demand for dietary supplements, Price fluctuations and supply chain instability

  • Who are the major players in the Ascorbic Acid Market?

    • Archer Daniels Midland Co., BASF SE, Bio Techne Corp., CSPC Pharmaceutical Group Ltd., DSM Firmenich AG, FoodChem International Corp., Glanbia plc, MP Biomedicals Inc., Northeast Pharmaceutical Group, Nutricost, Pharmavite LLC, Prinova Group LLC, Reckitt Benckiser Group Plc, Sigma Aldrich Chemicals Ltd., Sinochem Group Co. Ltd., Spectrum Chemical Mfg. Corp., SternVitamin GmbH Co. KG, Thermo Fisher Scientific Inc. and Tokyo Chemical Industry Co.

Market Research Insights

  • The Ascorbic Acid Market exhibits rapid structural advancement propelled by precise biochemical engineering and formulation science. Facilities leveraging microfluidic stabilization have successfully reduced active ingredient degradation by 28%, significantly extending commercial shelf life. Similarly, the integration of advanced delivery systems enables a 45% increase in systemic absorption compared to conventional formats.
  • Manufacturers increasingly rely on nutritional fortification matrix technologies to standardize dosage precision across high-volume production lines. By implementing pharmaceutical-grade crystallization protocols, specialized producers minimize heavy metal contamination risk by 35%. Furthermore, the adoption of a clean-label formulation approach allows brands to successfully align with modern regulatory compliance standards while simultaneously improving final product integrity.

We can help! Our analysts can customize this ascorbic acid market research report to meet your requirements.

Get in touch

1. Executive Summary

1.1 Market overview

Executive Summary - Chart on Market Overview
Executive Summary - Data Table on Market Overview
Executive Summary - Chart on Global Market Characteristics
Executive Summary - Chart on Market by Geography
Executive Summary - Chart on Market Segmentation by Variant
Executive Summary - Chart on Market Segmentation by End-user
Executive Summary - Chart on Market Segmentation by Type
Executive Summary - Chart on Incremental Growth
Executive Summary - Data Table on Incremental Growth
Executive Summary - Chart on Company Market Positioning

2. Technavio Analysis

2.1 Analysis of price sensitivity, lifecycle, customer purchase basket, adoption rates, and purchase criteria

2.2 Criticality of inputs and Factors of differentiation

Chart on Overview on criticality of inputs and factors of differentiation

2.3 Factors of disruption

Chart on Overview on factors of disruption

2.4 Impact of drivers and challenges

Chart on Impact of drivers and challenges in 2025 and 2030

3. Market Landscape

3.1 Market ecosystem

Chart on Parent Market
Data Table on - Parent Market

3.2 Market characteristics

Chart on Market characteristics analysis

3.3 Value chain analysis

Chart on Value chain analysis

4. Market Sizing

4.1 Market definition

Data Table on Offerings of companies included in the market definition

4.2 Market segment analysis

Market segments

4.3 Market size 2025

4.4 Market outlook: Forecast for 2025-2030

Chart on Global - Market size and forecast 2025-2030 ($ million)
Data Table on Global - Market size and forecast 2025-2030 ($ million)
Chart on Global Market: Year-over-year growth 2025-2030 (%)
Data Table on Global Market: Year-over-year growth 2025-2030 (%)

5. Historic Market Size

5.1 Global Ascorbic Acid Market 2020 - 2024

Historic Market Size - Data Table on Global Ascorbic Acid Market 2020 - 2024 ($ million)

5.2 Variant segment analysis 2020 - 2024

Historic Market Size - Variant Segment 2020 - 2024 ($ million)

5.3 End-user segment analysis 2020 - 2024

Historic Market Size - End-user Segment 2020 - 2024 ($ million)

5.4 Type segment analysis 2020 - 2024

Historic Market Size - Type Segment 2020 - 2024 ($ million)

5.5 Geography segment analysis 2020 - 2024

Historic Market Size - Geography Segment 2020 - 2024 ($ million)

5.6 Country segment analysis 2020 - 2024

Historic Market Size - Country Segment 2020 - 2024 ($ million)

6. Qualitative Analysis

6.1 Impact of AI on Global Ascorbic Acid Market

6.2 Impact of Geopolitical Conflicts on Global Ascorbic Acid Market

7. Five Forces Analysis

7.1 Five forces summary

Five forces analysis - Comparison between 2025 and 2030

7.2 Bargaining power of buyers

Bargaining power of buyers - Impact of key factors 2025 and 2030

7.3 Bargaining power of suppliers

Bargaining power of suppliers - Impact of key factors in 2025 and 2030

7.4 Threat of new entrants

Threat of new entrants - Impact of key factors in 2025 and 2030

7.5 Threat of substitutes

Threat of substitutes - Impact of key factors in 2025 and 2030

7.6 Threat of rivalry

Threat of rivalry - Impact of key factors in 2025 and 2030

7.7 Market condition

Chart on Market condition - Five forces 2025 and 2030

8. Market Segmentation by Variant

8.1 Market segments

Chart on Variant - Market share 2025-2030 (%)
Data Table on Variant - Market share 2025-2030 (%)

8.2 Comparison by Variant

Chart on Comparison by Variant
Data Table on Comparison by Variant

8.3 Powder - Market size and forecast 2025-2030

Chart on Powder - Market size and forecast 2025-2030 ($ million)
Data Table on Powder - Market size and forecast 2025-2030 ($ million)
Chart on Powder - Year-over-year growth 2025-2030 (%)
Data Table on Powder - Year-over-year growth 2025-2030 (%)

8.4 Liquid - Market size and forecast 2025-2030

Chart on Liquid - Market size and forecast 2025-2030 ($ million)
Data Table on Liquid - Market size and forecast 2025-2030 ($ million)
Chart on Liquid - Year-over-year growth 2025-2030 (%)
Data Table on Liquid - Year-over-year growth 2025-2030 (%)

8.5 Market opportunity by Variant

Market opportunity by Variant ($ million)
Data Table on Market opportunity by Variant ($ million)

9. Market Segmentation by End-user

9.1 Market segments

Chart on End-user - Market share 2025-2030 (%)
Data Table on End-user - Market share 2025-2030 (%)

9.2 Comparison by End-user

Chart on Comparison by End-user
Data Table on Comparison by End-user

9.3 Pharmaceutical - Market size and forecast 2025-2030

Chart on Pharmaceutical - Market size and forecast 2025-2030 ($ million)
Data Table on Pharmaceutical - Market size and forecast 2025-2030 ($ million)
Chart on Pharmaceutical - Year-over-year growth 2025-2030 (%)
Data Table on Pharmaceutical - Year-over-year growth 2025-2030 (%)

9.4 Food and beverages - Market size and forecast 2025-2030

Chart on Food and beverages - Market size and forecast 2025-2030 ($ million)
Data Table on Food and beverages - Market size and forecast 2025-2030 ($ million)
Chart on Food and beverages - Year-over-year growth 2025-2030 (%)
Data Table on Food and beverages - Year-over-year growth 2025-2030 (%)

9.5 Personal care - Market size and forecast 2025-2030

Chart on Personal care - Market size and forecast 2025-2030 ($ million)
Data Table on Personal care - Market size and forecast 2025-2030 ($ million)
Chart on Personal care - Year-over-year growth 2025-2030 (%)
Data Table on Personal care - Year-over-year growth 2025-2030 (%)

9.6 Others - Market size and forecast 2025-2030

Chart on Others - Market size and forecast 2025-2030 ($ million)
Data Table on Others - Market size and forecast 2025-2030 ($ million)
Chart on Others - Year-over-year growth 2025-2030 (%)
Data Table on Others - Year-over-year growth 2025-2030 (%)

9.7 Market opportunity by End-user

Market opportunity by End-user ($ million)
Data Table on Market opportunity by End-user ($ million)

10. Market Segmentation by Type

10.1 Market segments

Chart on Type - Market share 2025-2030 (%)
Data Table on Type - Market share 2025-2030 (%)

10.2 Comparison by Type

Chart on Comparison by Type
Data Table on Comparison by Type

10.3 Sodium ascorbate - Market size and forecast 2025-2030

Chart on Sodium ascorbate - Market size and forecast 2025-2030 ($ million)
Data Table on Sodium ascorbate - Market size and forecast 2025-2030 ($ million)
Chart on Sodium ascorbate - Year-over-year growth 2025-2030 (%)
Data Table on Sodium ascorbate - Year-over-year growth 2025-2030 (%)

10.4 Calcium ascorbate - Market size and forecast 2025-2030

Chart on Calcium ascorbate - Market size and forecast 2025-2030 ($ million)
Data Table on Calcium ascorbate - Market size and forecast 2025-2030 ($ million)
Chart on Calcium ascorbate - Year-over-year growth 2025-2030 (%)
Data Table on Calcium ascorbate - Year-over-year growth 2025-2030 (%)

10.5 Potassium ascorbate - Market size and forecast 2025-2030

Chart on Potassium ascorbate - Market size and forecast 2025-2030 ($ million)
Data Table on Potassium ascorbate - Market size and forecast 2025-2030 ($ million)
Chart on Potassium ascorbate - Year-over-year growth 2025-2030 (%)
Data Table on Potassium ascorbate - Year-over-year growth 2025-2030 (%)

10.6 Others - Market size and forecast 2025-2030

Chart on Others - Market size and forecast 2025-2030 ($ million)
Data Table on Others - Market size and forecast 2025-2030 ($ million)
Chart on Others - Year-over-year growth 2025-2030 (%)
Data Table on Others - Year-over-year growth 2025-2030 (%)

10.7 Market opportunity by Type

Market opportunity by Type ($ million)
Data Table on Market opportunity by Type ($ million)

11. Customer Landscape

11.1 Customer landscape overview

Analysis of price sensitivity, lifecycle, customer purchase basket, adoption rates, and purchase criteria

12. Geographic Landscape

12.1 Geographic segmentation

Chart on Market share by geography 2025-2030 (%)
Data Table on Market share by geography 2025-2030 (%)

12.2 Geographic comparison

Chart on Geographic comparison
Data Table on Geographic comparison

12.3 Europe - Market size and forecast 2025-2030

Chart on Europe - Market size and forecast 2025-2030 ($ million)
Data Table on Europe - Market size and forecast 2025-2030 ($ million)
Chart on Europe - Year-over-year growth 2025-2030 (%)
Data Table on Europe - Year-over-year growth 2025-2030 (%)
Chart on Regional Comparison - Europe
Data Table on Regional Comparison - Europe

12.3.1 Germany - Market size and forecast 2025-2030

Chart on Germany - Market size and forecast 2025-2030 ($ million)
Data Table on Germany - Market size and forecast 2025-2030 ($ million)
Chart on Germany - Year-over-year growth 2025-2030 (%)
Data Table on Germany - Year-over-year growth 2025-2030 (%)

12.3.2 UK - Market size and forecast 2025-2030

Chart on UK - Market size and forecast 2025-2030 ($ million)
Data Table on UK - Market size and forecast 2025-2030 ($ million)
Chart on UK - Year-over-year growth 2025-2030 (%)
Data Table on UK - Year-over-year growth 2025-2030 (%)

12.3.3 France - Market size and forecast 2025-2030

Chart on France - Market size and forecast 2025-2030 ($ million)
Data Table on France - Market size and forecast 2025-2030 ($ million)
Chart on France - Year-over-year growth 2025-2030 (%)
Data Table on France - Year-over-year growth 2025-2030 (%)

12.3.4 Italy - Market size and forecast 2025-2030

Chart on Italy - Market size and forecast 2025-2030 ($ million)
Data Table on Italy - Market size and forecast 2025-2030 ($ million)
Chart on Italy - Year-over-year growth 2025-2030 (%)
Data Table on Italy - Year-over-year growth 2025-2030 (%)

12.3.5 Spain - Market size and forecast 2025-2030

Chart on Spain - Market size and forecast 2025-2030 ($ million)
Data Table on Spain - Market size and forecast 2025-2030 ($ million)
Chart on Spain - Year-over-year growth 2025-2030 (%)
Data Table on Spain - Year-over-year growth 2025-2030 (%)

12.3.6 The Netherlands - Market size and forecast 2025-2030

Chart on The Netherlands - Market size and forecast 2025-2030 ($ million)
Data Table on The Netherlands - Market size and forecast 2025-2030 ($ million)
Chart on The Netherlands - Year-over-year growth 2025-2030 (%)
Data Table on The Netherlands - Year-over-year growth 2025-2030 (%)

12.4 North America - Market size and forecast 2025-2030

Chart on North America - Market size and forecast 2025-2030 ($ million)
Data Table on North America - Market size and forecast 2025-2030 ($ million)
Chart on North America - Year-over-year growth 2025-2030 (%)
Data Table on North America - Year-over-year growth 2025-2030 (%)
Chart on Regional Comparison - North America
Data Table on Regional Comparison - North America

12.4.1 US - Market size and forecast 2025-2030

Chart on US - Market size and forecast 2025-2030 ($ million)
Data Table on US - Market size and forecast 2025-2030 ($ million)
Chart on US - Year-over-year growth 2025-2030 (%)
Data Table on US - Year-over-year growth 2025-2030 (%)

12.4.2 Canada - Market size and forecast 2025-2030

Chart on Canada - Market size and forecast 2025-2030 ($ million)
Data Table on Canada - Market size and forecast 2025-2030 ($ million)
Chart on Canada - Year-over-year growth 2025-2030 (%)
Data Table on Canada - Year-over-year growth 2025-2030 (%)

12.4.3 Mexico - Market size and forecast 2025-2030

Chart on Mexico - Market size and forecast 2025-2030 ($ million)
Data Table on Mexico - Market size and forecast 2025-2030 ($ million)
Chart on Mexico - Year-over-year growth 2025-2030 (%)
Data Table on Mexico - Year-over-year growth 2025-2030 (%)

12.5 APAC - Market size and forecast 2025-2030

Chart on APAC - Market size and forecast 2025-2030 ($ million)
Data Table on APAC - Market size and forecast 2025-2030 ($ million)
Chart on APAC - Year-over-year growth 2025-2030 (%)
Data Table on APAC - Year-over-year growth 2025-2030 (%)
Chart on Regional Comparison - APAC
Data Table on Regional Comparison - APAC

12.5.1 China - Market size and forecast 2025-2030

Chart on China - Market size and forecast 2025-2030 ($ million)
Data Table on China - Market size and forecast 2025-2030 ($ million)
Chart on China - Year-over-year growth 2025-2030 (%)
Data Table on China - Year-over-year growth 2025-2030 (%)

12.5.2 India - Market size and forecast 2025-2030

Chart on India - Market size and forecast 2025-2030 ($ million)
Data Table on India - Market size and forecast 2025-2030 ($ million)
Chart on India - Year-over-year growth 2025-2030 (%)
Data Table on India - Year-over-year growth 2025-2030 (%)

12.5.3 Japan - Market size and forecast 2025-2030

Chart on Japan - Market size and forecast 2025-2030 ($ million)
Data Table on Japan - Market size and forecast 2025-2030 ($ million)
Chart on Japan - Year-over-year growth 2025-2030 (%)
Data Table on Japan - Year-over-year growth 2025-2030 (%)

12.5.4 South Korea - Market size and forecast 2025-2030

Chart on South Korea - Market size and forecast 2025-2030 ($ million)
Data Table on South Korea - Market size and forecast 2025-2030 ($ million)
Chart on South Korea - Year-over-year growth 2025-2030 (%)
Data Table on South Korea - Year-over-year growth 2025-2030 (%)

12.5.5 Australia - Market size and forecast 2025-2030

Chart on Australia - Market size and forecast 2025-2030 ($ million)
Data Table on Australia - Market size and forecast 2025-2030 ($ million)
Chart on Australia - Year-over-year growth 2025-2030 (%)
Data Table on Australia - Year-over-year growth 2025-2030 (%)

12.5.6 Indonesia - Market size and forecast 2025-2030

Chart on Indonesia - Market size and forecast 2025-2030 ($ million)
Data Table on Indonesia - Market size and forecast 2025-2030 ($ million)
Chart on Indonesia - Year-over-year growth 2025-2030 (%)
Data Table on Indonesia - Year-over-year growth 2025-2030 (%)

12.6 South America - Market size and forecast 2025-2030

Chart on South America - Market size and forecast 2025-2030 ($ million)
Data Table on South America - Market size and forecast 2025-2030 ($ million)
Chart on South America - Year-over-year growth 2025-2030 (%)
Data Table on South America - Year-over-year growth 2025-2030 (%)
Chart on Regional Comparison - South America
Data Table on Regional Comparison - South America

12.6.1 Brazil - Market size and forecast 2025-2030

Chart on Brazil - Market size and forecast 2025-2030 ($ million)
Data Table on Brazil - Market size and forecast 2025-2030 ($ million)
Chart on Brazil - Year-over-year growth 2025-2030 (%)
Data Table on Brazil - Year-over-year growth 2025-2030 (%)

12.6.2 Argentina - Market size and forecast 2025-2030

Chart on Argentina - Market size and forecast 2025-2030 ($ million)
Data Table on Argentina - Market size and forecast 2025-2030 ($ million)
Chart on Argentina - Year-over-year growth 2025-2030 (%)
Data Table on Argentina - Year-over-year growth 2025-2030 (%)

12.6.3 Chile - Market size and forecast 2025-2030

Chart on Chile - Market size and forecast 2025-2030 ($ million)
Data Table on Chile - Market size and forecast 2025-2030 ($ million)
Chart on Chile - Year-over-year growth 2025-2030 (%)
Data Table on Chile - Year-over-year growth 2025-2030 (%)

12.7 Middle East and Africa - Market size and forecast 2025-2030

Chart on Middle East and Africa - Market size and forecast 2025-2030 ($ million)
Data Table on Middle East and Africa - Market size and forecast 2025-2030 ($ million)
Chart on Middle East and Africa - Year-over-year growth 2025-2030 (%)
Data Table on Middle East and Africa - Year-over-year growth 2025-2030 (%)
Chart on Regional Comparison - Middle East and Africa
Data Table on Regional Comparison - Middle East and Africa

12.7.1 Saudi Arabia - Market size and forecast 2025-2030

Chart on Saudi Arabia - Market size and forecast 2025-2030 ($ million)
Data Table on Saudi Arabia - Market size and forecast 2025-2030 ($ million)
Chart on Saudi Arabia - Year-over-year growth 2025-2030 (%)
Data Table on Saudi Arabia - Year-over-year growth 2025-2030 (%)

12.7.2 UAE - Market size and forecast 2025-2030

Chart on UAE - Market size and forecast 2025-2030 ($ million)
Data Table on UAE - Market size and forecast 2025-2030 ($ million)
Chart on UAE - Year-over-year growth 2025-2030 (%)
Data Table on UAE - Year-over-year growth 2025-2030 (%)

12.7.3 South Africa - Market size and forecast 2025-2030

Chart on South Africa - Market size and forecast 2025-2030 ($ million)
Data Table on South Africa - Market size and forecast 2025-2030 ($ million)
Chart on South Africa - Year-over-year growth 2025-2030 (%)
Data Table on South Africa - Year-over-year growth 2025-2030 (%)

12.7.4 Egypt - Market size and forecast 2025-2030

Chart on Egypt - Market size and forecast 2025-2030 ($ million)
Data Table on Egypt - Market size and forecast 2025-2030 ($ million)
Chart on Egypt - Year-over-year growth 2025-2030 (%)
Data Table on Egypt - Year-over-year growth 2025-2030 (%)

12.7.5 Turkey - Market size and forecast 2025-2030

Chart on Turkey - Market size and forecast 2025-2030 ($ million)
Data Table on Turkey - Market size and forecast 2025-2030 ($ million)
Chart on Turkey - Year-over-year growth 2025-2030 (%)
Data Table on Turkey - Year-over-year growth 2025-2030 (%)

12.8 Market opportunity by geography

Market opportunity by geography ($ million)
Data Tables on Market opportunity by geography ($ million)

13. Drivers, Challenges, and Opportunity

13.1 Market drivers

Rising health consciousness and demand for dietary supplements
Expanding applications in food and beverage industry
Growing utilization in pharmaceutical and personal care sectors

13.2 Market challenges

Price fluctuations and supply chain instability
Product instability and degradation
Stringent regulatory landscape

13.3 Impact of drivers and challenges

Impact of drivers and challenges in 2025 and 2030

13.4 Market opportunities

Focus on sustainable and natural production methods
Innovations in delivery systems and bioavailability
Strategic consolidation and regional production shifts

14. Competitive Landscape

14.1 Overview

14.2

Overview on criticality of inputs and factors of differentiation

14.3 Landscape disruption

Overview on factors of disruption

14.4 Industry risks

Impact of key risks on business

15. Competitive Analysis

15.1 Companies profiled

Companies covered

15.2 Company ranking index

15.3 Market positioning of companies

Matrix on companies position and classification

15.4 Archer Daniels Midland Co.

Archer Daniels Midland Co. - Overview
Archer Daniels Midland Co. - Business segments
Archer Daniels Midland Co. - Key news
Archer Daniels Midland Co. - Key offerings
Archer Daniels Midland Co. - Segment focus
SWOT

15.5 BASF SE

BASF SE - Overview
BASF SE - Business segments
BASF SE - Key news
BASF SE - Key offerings
BASF SE - Segment focus
SWOT

15.6 Bio Techne Corp.

Bio Techne Corp. - Overview
Bio Techne Corp. - Business segments
Bio Techne Corp. - Key news
Bio Techne Corp. - Key offerings
Bio Techne Corp. - Segment focus
SWOT

15.7 CSPC Pharmaceutical Group Ltd.

CSPC Pharmaceutical Group Ltd. - Overview
CSPC Pharmaceutical Group Ltd. - Business segments
CSPC Pharmaceutical Group Ltd. - Key offerings
CSPC Pharmaceutical Group Ltd. - Segment focus
SWOT

15.8 DSM Firmenich AG

DSM Firmenich AG - Overview
DSM Firmenich AG - Business segments
DSM Firmenich AG - Key offerings
DSM Firmenich AG - Segment focus
SWOT

15.9 Glanbia plc

Glanbia plc - Overview
Glanbia plc - Business segments
Glanbia plc - Key offerings
Glanbia plc - Segment focus
SWOT

15.10 MP Biomedicals Inc.

MP Biomedicals Inc. - Overview
MP Biomedicals Inc. - Product / Service
MP Biomedicals Inc. - Key offerings
SWOT

15.11 Northeast Pharmaceutical Group

Northeast Pharmaceutical Group - Overview
Northeast Pharmaceutical Group - Product / Service
Northeast Pharmaceutical Group - Key offerings
SWOT

15.12 Pharmavite LLC

Pharmavite LLC - Overview
Pharmavite LLC - Product / Service
Pharmavite LLC - Key offerings
SWOT

15.13 Prinova Group LLC

Prinova Group LLC - Overview
Prinova Group LLC - Product / Service
Prinova Group LLC - Key offerings
SWOT

15.14 Reckitt Benckiser Group Plc

Reckitt Benckiser Group Plc - Overview
Reckitt Benckiser Group Plc - Business segments
Reckitt Benckiser Group Plc - Key offerings
Reckitt Benckiser Group Plc - Segment focus
SWOT

15.15 Sigma Aldrich Chemicals Ltd.

Sigma Aldrich Chemicals Ltd. - Overview
Sigma Aldrich Chemicals Ltd. - Product / Service
Sigma Aldrich Chemicals Ltd. - Key offerings
SWOT

15.16 Sinochem Group Co. Ltd.

Sinochem Group Co. Ltd. - Overview
Sinochem Group Co. Ltd. - Product / Service
Sinochem Group Co. Ltd. - Key offerings
SWOT

15.17 Spectrum Chemical Mfg. Corp.

Spectrum Chemical Mfg. Corp. - Overview
Spectrum Chemical Mfg. Corp. - Product / Service
Spectrum Chemical Mfg. Corp. - Key offerings
SWOT

15.18 Thermo Fisher Scientific Inc.

Thermo Fisher Scientific Inc. - Overview
Thermo Fisher Scientific Inc. - Business segments
Thermo Fisher Scientific Inc. - Key news
Thermo Fisher Scientific Inc. - Key offerings
Thermo Fisher Scientific Inc. - Segment focus
SWOT

16. Appendix

16.1 Scope of the report

Market definition
Objectives
Notes and caveats

16.2 Inclusions and exclusions checklist

Inclusions checklist
Exclusions checklist

16.3 Currency conversion rates for US$

16.4 Research methodology

16.5 Data procurement

Information sources

16.6 Data validation

16.7 Validation techniques employed for market sizing

16.8 Data synthesis

16.9 360 degree market analysis

16.10 List of abbreviations

Research Methodology

Technavio presents a detailed picture of the market by way of study, synthesis, and summation of data from multiple sources. The analysts have presented the various facets of the market with a particular focus on identifying the key industry influencers. The data thus presented is comprehensive, reliable, and the result of extensive research, both primary and secondary.

INFORMATION SOURCES

Primary sources

  • Manufacturers and suppliers
  • Channel partners
  • Industry experts
  • Strategic decision makers

Secondary sources

  • Industry journals and periodicals
  • Government data
  • Financial reports of key industry players
  • Historical data
  • Press releases

DATA ANALYSIS

Data Synthesis

  • Collation of data
  • Estimation of key figures
  • Analysis of derived insights

Data Validation

  • Triangulation with data models
  • Reference against proprietary databases
  • Corroboration with industry experts

REPORT WRITING

Qualitative

  • Market drivers
  • Market challenges
  • Market trends
  • Five forces analysis

Quantitative

  • Market size and forecast
  • Market segmentation
  • Geographical insights
  • Competitive landscape

Interested in this report?

Get your sample now to see our research methodology and insights!

Download Now

Frequently Asked Questions

Ascorbic Acid market growth will increase by USD 393.7 million during 2026-2030.

The Ascorbic Acid market is expected to grow at a CAGR of 5.3% during 2026-2030.

Ascorbic Acid market is segmented by Variant (Powder, Liquid) End-user (Pharmaceutical, Food and beverages, Personal care, Others) Type (Sodium ascorbate, Calcium ascorbate, Potassium ascorbate, Others)

Archer Daniels Midland Co., BASF SE, Bio Techne Corp., CSPC Pharmaceutical Group Ltd., DSM Firmenich AG, FoodChem International Corp., Glanbia plc, MP Biomedicals Inc., Northeast Pharmaceutical Group, Nutricost, Pharmavite LLC, Prinova Group LLC, Reckitt Benckiser Group Plc, Sigma Aldrich Chemicals Ltd., Sinochem Group Co. Ltd., Spectrum Chemical Mfg. Corp., SternVitamin GmbH Co. KG, Thermo Fisher Scientific Inc., Tokyo Chemical Industry Co. are a few of the key vendors in the Ascorbic Acid market.

North America will register the highest growth rate of 31.9% among the other regions. Therefore, the Ascorbic Acid market in North America is expected to garner significant business opportunities for the vendors during the forecast period.

Germany, UK, France, Italy, Spain, The Netherlands, US, Canada, Mexico, China, India, Japan, South Korea, Australia, Indonesia, Brazil, Argentina, Chile, Saudi Arabia, UAE, South Africa, Egypt, Turkey

  • Rising health consciousness and demand for dietary supplements is the driving factor this market.

The Ascorbic Acid market vendors should focus on grabbing business opportunities from the Variant segment as it accounted for the largest market share in the base year.
RIA - Research AI Assistant
Ask RIA
