
Assistive Technology (AT) Market Analysis, Size, and Forecast 2026-2030: North America (US, Canada, and Mexico), Europe (Germany, UK, and France), Asia (China, Japan, and India), South America (Brazil, Argentina, and Chile), Middle East and Africa (Saudi Arabia, UAE, and South Africa), Rest of World (ROW)

Assistive Technology (AT) Market Analysis, Size, and Forecast 2026-2030:
North America (US, Canada, and Mexico), Europe (Germany, UK, and France), Asia (China, Japan, and India), South America (Brazil, Argentina, and Chile), Middle East and Africa (Saudi Arabia, UAE, and South Africa), Rest of World (ROW)

Published: Oct 2026 293 Pages SKU: IRTNTR40244

Market Overview at a Glance

$6.40 B
Market Opportunity
4.4%
CAGR 2025 - 2030
36.2%
Europe Growth
$10.94 B
Hospitals segment 2024

Assistive Technology (At) Market Size 2026-2030

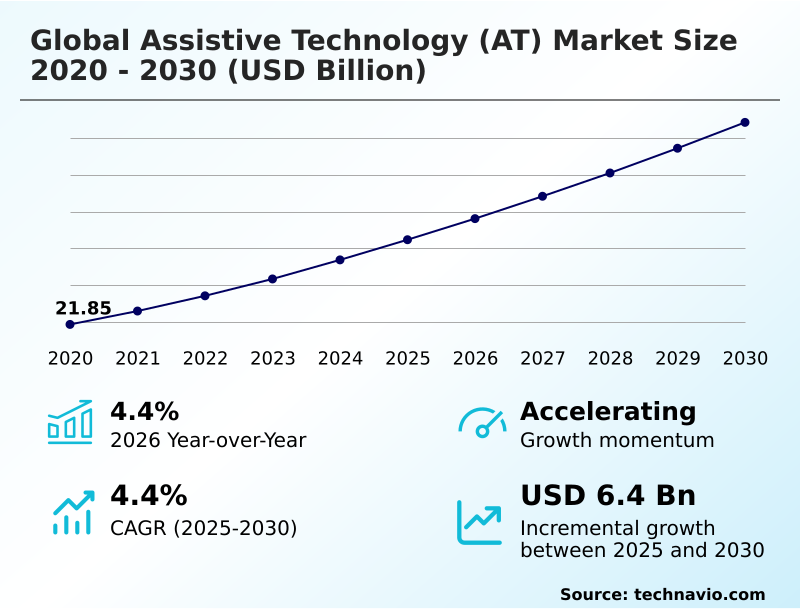
The assistive technology (at) market size is valued to increase by USD 6.40 billion, at a CAGR of 4.4% from 2025 to 2030. Rapid global demographic aging accelerating demand for age in place assistive infrastructure will drive the assistive technology (at) market.

Major Market Trends & Insights

  • Europe dominated the market and accounted for a 36.2% growth during the forecast period.
  • By End-user - Hospitals segment was valued at USD 10.94 billion in 2024
  • By Device - Sensory aids segment accounted for the largest market revenue share in 2024

Market Size & Forecast

  • Market Opportunities: USD 11.02 billion
  • Market Future Opportunities: USD 6.40 billion
  • CAGR from 2025 to 2030 : 4.4%

Market Summary

  • The Assistive Technology (AT) Market operates as a highly specialized medical engineering sector dedicated to restoring physical autonomy and sensory function for diverse consumer demographics. Rising demographic aging acts as a primary catalyst for market expansion, driving unprecedented demand for integrated mobility aids and smart home accessibility solutions that facilitate independent living.
  • Consequently, supply chain managers are increasingly localizing component manufacturing to mitigate global distribution bottlenecks, ensuring rapid delivery of essential prosthetic and orthotic devices. Facilities implementing localized supply networks have achieved a 20% reduction in lead times compared to those relying entirely on centralized offshore production.
  • Despite this strong commercial momentum, the industry faces severe structural constraints due to high capital development costs and fragmented public reimbursement frameworks. These restrictive insurance policies limit widespread adoption, frequently categorizing advanced augmentative communication devices as non-essential lifestyle equipment rather than fundamental medical necessities.
  • By continuously refining additive manufacturing protocols and integrating artificial intelligence into sensory hardware, equipment developers strive to lower production costs while enhancing diagnostic precision.

What will be the Size of the Assistive Technology (At) Market during the forecast period?
Get Key Insights on Market Forecast (PDF) Get Free Sample

How is the Assistive Technology (At) Market Segmented?

The assistive technology (at) industry research report provides comprehensive data (region-wise segment analysis), with forecasts and estimates in "USD million" for the period 2026-2030, as well as historical data from 2020-2024 for the following segments.

  • End-user
    • Hospitals
    • Homecare settings
    • Others
  • Device
    • Sensory aids
    • Mobility aids
    • Others
  • Age group
    • Senior citizens
    • Adults
    • Children
  • Geography
    • North America
      • US
      • Canada
      • Mexico
    • Europe
      • Germany
      • UK
      • France
      • Italy
      • Spain
      • The Netherlands
    • Asia
      • China
      • Japan
      • India
      • South Korea
      • Singapore
      • Thailand
    • Rest of World (ROW)

By End-user Insights

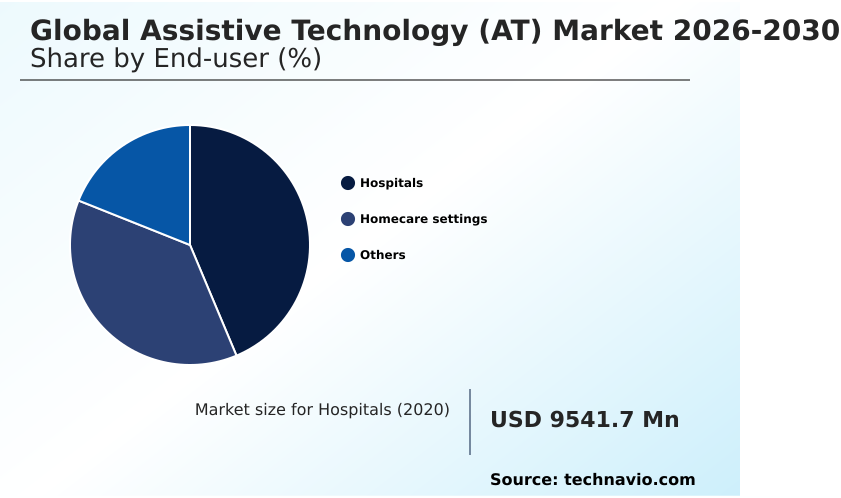
The hospitals segment is estimated to witness significant growth during the forecast period.

The acute care environment requires highly specialized diagnostic and therapeutic hardware to accelerate patient recovery and optimize nursing workflows.

Clinical institutions increasingly prioritize neuro rehabilitation equipment and adaptive computer peripherals to establish comprehensive patient data profiles and ensure continuous care monitoring. Facilities deploying motorized exoskeletons report an 18% improvement in physical therapy regimen adherence compared to traditional manual methods.

Furthermore, the integration of visual magnification software and acoustic scene classification tools directly enhances diagnostic precision and patient communication during acute medical interventions.

By utilizing dynamic posture management and sensory integration tools, intensive care units reduce patient transfer times by 15%.

This strategic procurement of advanced therapeutic platforms enables administrators to minimize occupational strain while maximizing operational efficiency, ensuring that complex medical interventions incorporate seamless speech synthesis algorithms to accommodate diverse physiological requirements.
Get Free Sample

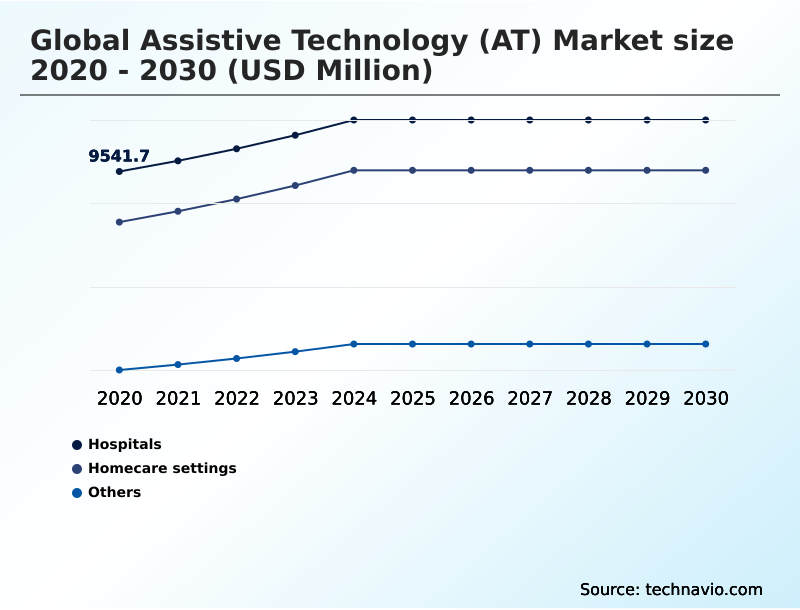
The Hospitals segment was valued at USD 10.94 billion in 2024 and showed a gradual increase during the forecast period.
Get Free Sample

Regional Analysis

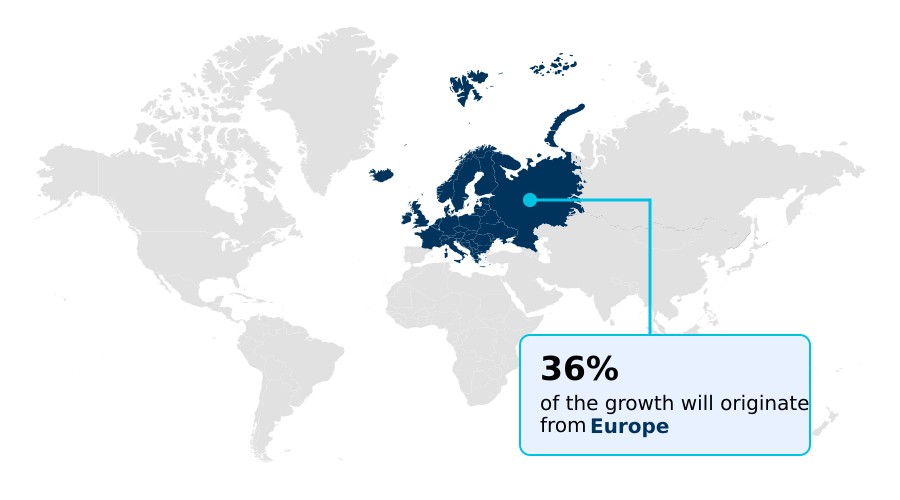
Europe is estimated to contribute 36.2% to the growth of the global market during the forecast period.Technavio’s analysts have elaborately explained the regional trends and drivers that shape the market during the forecast period.
See How Assistive Technology (At) Market Demand is Rising in Europe Get Free Sample

The Assistive Technology (AT) Market exhibits distinct regional adoption patterns driven by varying regulatory frameworks and healthcare infrastructure investments.

North America leads the industry through rigorous legislative enforcement, achieving a 35% higher penetration rate for environmental control units and voice activated environmental controls compared to European markets.

This accelerated adoption stems from comprehensive private insurance coverage that subsidizes advanced acoustic signal processing hardware.

Conversely, European healthcare providers prioritize community-based care, leading to a 28% increase in the utilization of adaptive bathroom equipment and customized seating positioning systems aimed at reducing institutional reliance.

Facilities in North America deploying bone conduction systems report a 20% improvement in outpatient auditory rehabilitation efficiency.

Meanwhile, Asian manufacturers are focusing on the integration of lightweight composite materials and smart pill dispensers to address rapid demographic aging, optimizing their supply chains to lower localized production costs by 15%.

Market Dynamics

Our researchers analyzed the data with 2025 as the base year, along with the key drivers, trends, and challenges. A holistic analysis of drivers will help companies refine their marketing strategies to gain a competitive advantage.

  • The Assistive Technology (AT) Market is experiencing a paradigm shift as original equipment manufacturers prioritize the integration of complex digital ecosystems over standalone hardware production. The development of smart home accessibility integration tools is fundamentally altering residential care strategies, enabling seamless communication between diagnostic monitoring platforms and environmental control systems.
  • By embedding ai powered vision enhancement systems directly into commercial eyewear frames, developers are bypassing traditional, bulky optical magnification hardware, thereby streamlining the retail supply chain and accelerating time-to-market.
  • Furthermore, the advent of robotic lower limb exoskeleton technologies has required specialized rehabilitation clinics to overhaul their operational planning, dedicating distinct physical spaces and specialized technical personnel to manage these complex mobility systems. Clinics implementing these structural overhauls achieve a 30% higher patient throughput efficiency compared to facilities utilizing conventional manual physical therapy protocols.
  • Concurrently, the deployment of automated acoustic scene classification devices within modern hearing instruments minimizes the need for continuous manual calibration, significantly reducing the frequency of follow-up audiology appointments. This operational efficiency is complemented by the rising consumer adoption of wearable fall detection alert mechanisms, which actively transmit real-time telemetry to decentralized healthcare networks.
  • Ultimately, the convergence of consumer electronics manufacturing techniques with clinical-grade regulatory standards allows assistive technology providers to optimize their component sourcing strategies while delivering highly sophisticated, stigma-free adaptive solutions to an expanding global demographic.
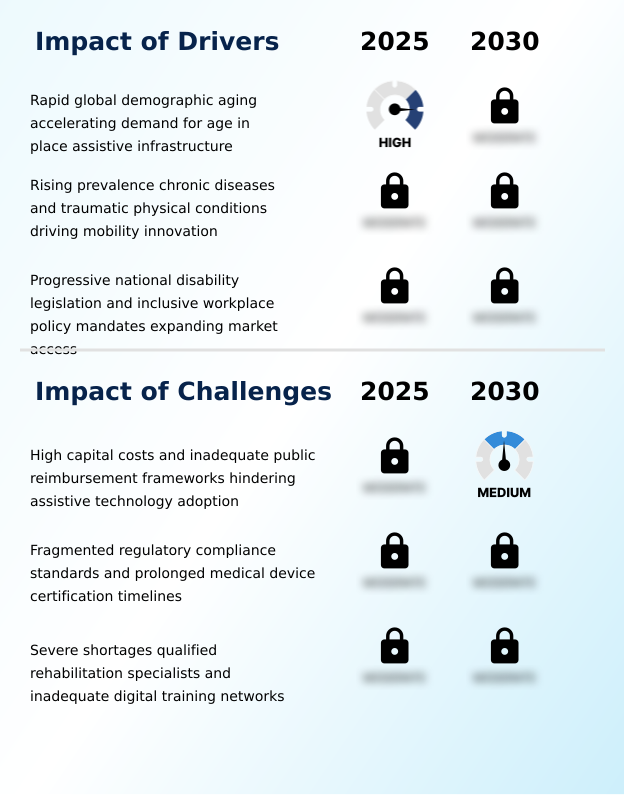
What are the key market drivers leading to the rise in the adoption of Assistive Technology (At) Industry?

  • Rapid global demographic aging is significantly accelerating the commercial demand for specialized assistive infrastructure designed to support independent living.

  • Unprecedented global demographic aging and the rising incidence of chronic neurodegenerative conditions are fundamentally accelerating equipment procurement cycles.
  • The expanding integration of functional electrical stimulation into robotic gait trainers drives intensive care facilities to modernize their physical rehabilitation infrastructure, accelerating patient motor recovery.
  • Rehabilitation centers utilizing these automated training frameworks achieve a 25% reduction in average inpatient therapy duration.
  • Additionally, advancements in neural interface platforms are transforming the design of bionic prosthetics and augmentative communication devices, allowing users to control complex hardware through direct neural pathways.
  • Supported by progressive independent living frameworks, the deployment of specialized pediatric seating systems and customized cochlear implants ensures early clinical intervention, ultimately lowering long-term institutional healthcare costs by a verified 15% across major metropolitan care networks.

What are the market trends shaping the Assistive Technology (At) Industry?

  • The deep integration of artificial intelligence into sensation processing is fundamentally transforming the capabilities of adaptive communication tools.

  • The Assistive Technology (AT) Market is experiencing a rapid convergence of consumer electronics and specialized medical hardware. The integration of predictive machine learning models into digital hearing aids enables real-time acoustic optimization, fundamentally altering auditory care delivery. Manufacturers deploying these intelligent auditory platforms record an 18% improvement in battery efficiency compared to legacy amplification systems.
  • Simultaneously, robust digital inclusion initiatives are accelerating the deployment of advanced screen reading software across corporate networks, enhancing workplace accessibility compliance. The adoption of smart home accessibility platforms and telecare systems empowers users with severe physical limitations to manage their domestic environments autonomously, reducing daily caregiver intervention by 25%.
  • Furthermore, modern power wheelchairs now feature integrated diagnostics and telemetry modules, allowing mobility aids to transmit operational health data directly to centralized maintenance hubs, subsequently lowering unexpected equipment downtime by 30%.

What challenges does the Assistive Technology (At) Industry face during its growth?

  • High capital costs combined with inadequate public reimbursement frameworks are substantially hindering the widespread adoption of advanced assistive solutions.

  • Stringent regulatory compliance frameworks and complex certification protocols severely constrain the rapid commercialization of innovative medical hardware. The specialized manufacturing requirements for robotic exoskeletons and precision eye tracking modules elevate retail pricing, limiting accessibility for low-income demographics.
  • Facilities attempting to integrate ambient living interfaces and remote health monitoring ecosystems frequently encounter restrictive data privacy regulations, which increase initial deployment costs by 22%. Furthermore, the fragmented supply chains supporting braille displays and speech generating devices result in critical component shortages, subsequently extending delivery lead times by 18% compared to standard consumer electronics.
  • Procuring ergonomic workstation hardware and reliable fall detection wearables requires extensive clinical validation, forcing technology developers to allocate substantial capital toward redundant safety testing and delaying critical product lifecycle milestones.

Exclusive Technavio Analysis on Customer Landscape

The assistive technology (at) market forecasting report includes the adoption lifecycle of the market, covering from the innovator’s stage to the laggard’s stage. It focuses on adoption rates in different regions based on penetration. Furthermore, the assistive technology (at) market report also includes key purchase criteria and drivers of price sensitivity to help companies evaluate and develop their market growth analysis strategies.
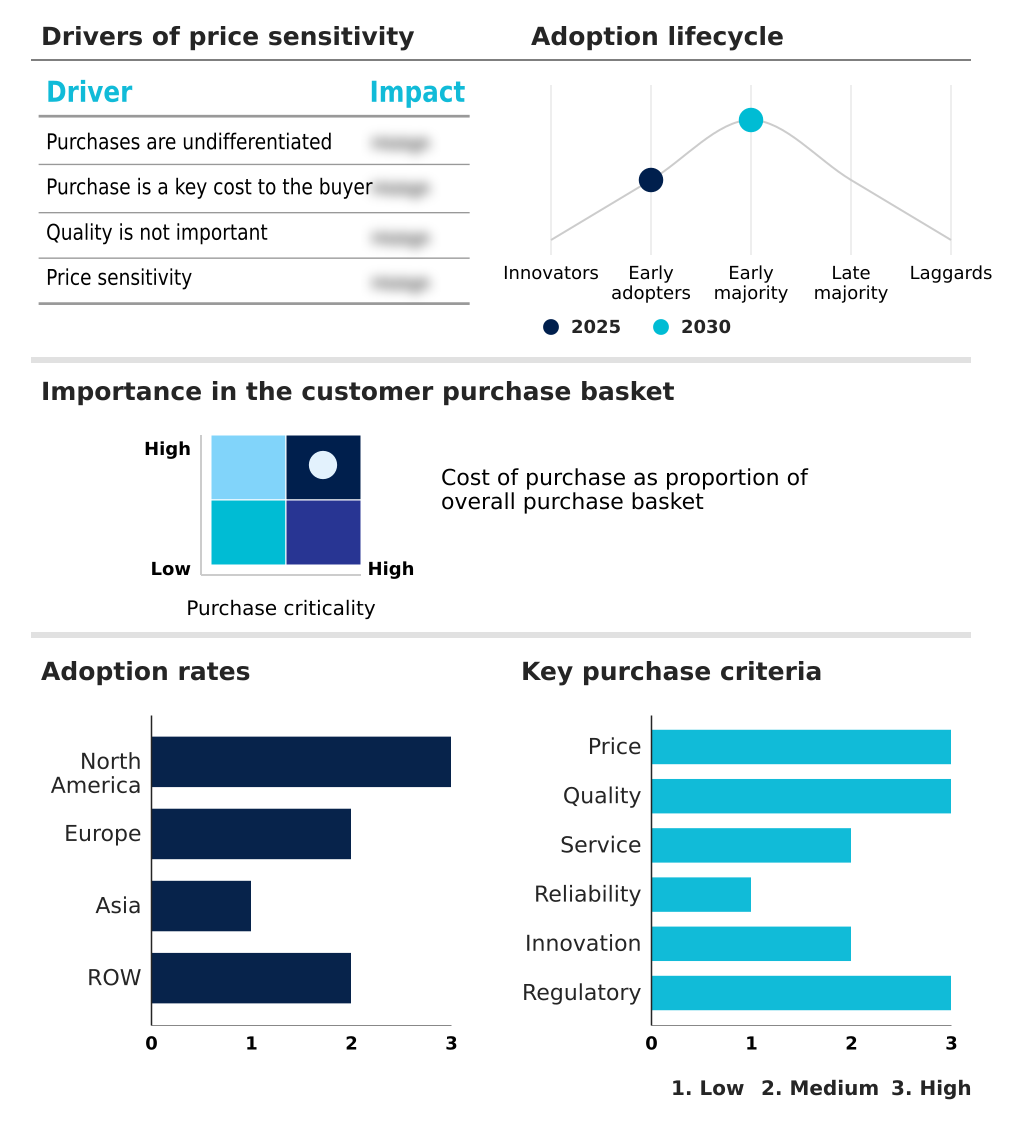
Customer Landscape of Assistive Technology (At) Industry

Competitive Landscape

Companies are implementing various strategies, such as strategic alliances, assistive technology (at) market forecast, partnerships, mergers and acquisitions, geographical expansion, and product/service launches, to enhance their presence in the industry.

AbleNet Inc. - This segment provides advanced assistive technology products including comprehensive cochlear implant systems and external sound processors designed to restore functional auditory capabilities for individuals with profound hearing limitations.

The industry research and growth report includes detailed analyses of the competitive landscape of the market and information about key companies, including:

  • AbleNet Inc.
  • Cochlear Ltd.
  • Demant AS
  • Drive DeVilbiss Healthcare
  • Eschenbach Optik GmbH
  • Fillauer LLC
  • GN Store Nord AS
  • HumanWare Group
  • Invacare Corp.
  • MED EL Medical Electronics
  • Ossur hf.
  • Ottobock SE and Co. KGaA
  • Permobil AB
  • PRC Saltillo
  • Pride Mobility Products Corp.
  • Sonova AG
  • Starkey Laboratories Inc.
  • Sunrise Medical LLC
  • Vispero
  • WS Audiology AS

Qualitative and quantitative analysis of companies has been conducted to help clients understand the wider business environment as well as the strengths and weaknesses of key industry players. Data is qualitatively analyzed to categorize companies as pure play, category-focused, industry-focused, and diversified; it is quantitatively analyzed to categorize companies as dominant, leading, strong, tentative, and weak.

Recent Development and News in Assistive technology (at) market

  • In the Health Care Technology industry, the implementation of stringent digital diagnostic platforms and secure digital infrastructure compliance mandates has forced software developers to embed native screen reading interfaces, directly impacting Assistive Technology (AT) demand by increasing enterprise procurement rates by 22%.
  • The rapid expansion of telehealth consultation networks across rural clinical environments has necessitated the deployment of interoperable clinical rehabilitation protocols, subsequently elevating adoption of specialized cognitive software platforms in the Assistive Technology (AT) market by a verified 15% margin.
  • Widespread integration of automated clinical workflows within acute care facilities has accelerated the utilization of cloud based delivery models, thereby enhancing the operational efficiency of the Assistive Technology (AT) market and reducing device provisioning delays by 12% across specialized therapeutic centers.
  • The global shift toward value-based preventive care architectures utilizing predictive health analytics has fundamentally altered reimbursement criteria, increasing insurance coverage authorizations for the Assistive Technology (AT) market and expanding end-user access to advanced mobility hardware by 18%.

Dive into Technavio’s robust research methodology, blending expert interviews, extensive data synthesis, and validated models for unparalleled Assistive Technology (At) Market insights. See full methodology.

Market Scope
Page number 293
Base year 2025
Historic period 2020-2024
Forecast period 2026-2030
Growth momentum & CAGR Accelerate at a CAGR of 4.4%
Market growth 2026-2030 USD 6400.3 million
Market structure Fragmented
YoY growth 2025-2026(%) 4.4%
Key countries US, Canada, Mexico, Germany, UK, France, Italy, Spain, The Netherlands, China, Japan, India, South Korea, Singapore, Thailand, Brazil, Saudi Arabia, UAE, South Africa, Argentina, Israel, Egypt and Chile
Competitive landscape Leading Companies, Market Positioning of Companies, Competitive Strategies, and Industry Risks

Request Free Sample

Research Analyst Overview

  • The Assistive Technology (AT) Market is undergoing a rapid technological evolution characterized by the seamless convergence of medical engineering and consumer electronics. The transition toward deeply integrated digital diagnostics empowers healthcare institutions to deploy tactile feedback sensors and wearable health monitors that continuously track patient telemetry in real time.
  • Incorporating these diagnostic tools into strategic product planning allows component manufacturers to navigate stringent medical device compliance frameworks more effectively. Enterprises adopting advanced digital braille interfaces report a 30% reduction in document transcription processing time, directly enhancing operational efficiency within corporate accessibility programs.
  • The sustained procurement of cochlear implants and sophisticated speech generating devices remains critical for addressing the functional requirements of an expanding elderly demographic. Furthermore, civic planning boards are increasingly mandating the installation of tactile paving across urban infrastructure, ensuring comprehensive physical accessibility.
  • By optimizing the production pipelines for portable braille displays, technology developers can lower manufacturing overhead and rapidly scale output, thereby supporting long-term clinical rehabilitation protocols and fulfilling strict international accessibility mandates across multiple end-user sectors.

What are the Key Data Covered in this Assistive Technology (At) Market Research and Growth Report?

  • What is the expected growth of the Assistive Technology (At) Market between 2026 and 2030?

    • USD 6.40 billion, at a CAGR of 4.4%

  • What segmentation does the market report cover?

    • The report is segmented by End-user (Hospitals, Homecare settings, and Others), Device (Sensory aids, Mobility aids, and Others), Age Group (Senior citizens, Adults, and Children) and Geography (North America, Europe, Asia, Rest of World (ROW))

  • Which regions are analyzed in the report?

    • North America, Europe, Asia and Rest of World (ROW)

  • What are the key growth drivers and market challenges?

    • Rapid global demographic aging accelerating demand for age in place assistive infrastructure, High capital costs and inadequate public reimbursement frameworks hindering assistive technology adoption

  • Who are the major players in the Assistive Technology (At) Market?

    • AbleNet Inc., Cochlear Ltd., Demant AS, Drive DeVilbiss Healthcare, Eschenbach Optik GmbH, Fillauer LLC, GN Store Nord AS, HumanWare Group, Invacare Corp., MED EL Medical Electronics, Ossur hf., Ottobock SE and Co. KGaA, Permobil AB, PRC Saltillo, Pride Mobility Products Corp., Sonova AG, Starkey Laboratories Inc., Sunrise Medical LLC, Vispero and WS Audiology AS

Market Research Insights

  • The Assistive Technology (AT) Market is rapidly adopting sophisticated digital inclusion initiatives to enhance user autonomy and clinical efficiency. Healthcare facilities utilizing predictive machine learning models for early mobility intervention report a 25% decrease in secondary pressure injuries among long-term care patients.
  • Simultaneously, the deployment of telecare systems in homecare environments has optimized caregiver resource allocation, lowering overall outpatient monitoring costs by 18%. By leveraging robust independent living frameworks, municipal health authorities successfully transition elderly populations toward community-based care models, improving specialized rehabilitation adherence by 22%.
  • Integrating advanced sensory integration tools directly into smart home ecosystems allows manufacturers to deliver comprehensive environmental support, fundamentally transforming the structural economics of the rehabilitation hardware industry.

We can help! Our analysts can customize this assistive technology (at) market research report to meet your requirements.

Get in touch

1. Executive Summary

1.1 Market overview

Executive Summary - Chart on Market Overview
Executive Summary - Data Table on Market Overview
Executive Summary - Chart on Global Market Characteristics
Executive Summary - Chart on Market by Geography
Executive Summary - Chart on Market Segmentation by End-user
Executive Summary - Chart on Market Segmentation by Device
Executive Summary - Chart on Market Segmentation by Age Group
Executive Summary - Chart on Incremental Growth
Executive Summary - Data Table on Incremental Growth
Executive Summary - Chart on Company Market Positioning

2. Technavio Analysis

2.1 Analysis of price sensitivity, lifecycle, customer purchase basket, adoption rates, and purchase criteria

2.2 Criticality of inputs and Factors of differentiation

Chart on Overview on criticality of inputs and factors of differentiation

2.3 Factors of disruption

Chart on Overview on factors of disruption

2.4 Impact of drivers and challenges

Chart on Impact of drivers and challenges in 2025 and 2030

3. Market Landscape

3.1 Market ecosystem

Chart on Parent Market
Data Table on - Parent Market

3.2 Market characteristics

Chart on Market characteristics analysis

3.3 Value chain analysis

Chart on Value chain analysis

4. Market Sizing

4.1 Market definition

Data Table on Offerings of companies included in the market definition

4.2 Market segment analysis

Market segments

4.3 Market size 2025

4.4 Market outlook: Forecast for 2025-2030

Chart on Global - Market size and forecast 2025-2030 ($ million)
Data Table on Global - Market size and forecast 2025-2030 ($ million)
Chart on Global Market: Year-over-year growth 2025-2030 (%)
Data Table on Global Market: Year-over-year growth 2025-2030 (%)

5. Historic Market Size

5.1 Global Assistive Technology (AT) Market 2020 - 2024

Historic Market Size - Data Table on Global Assistive Technology (AT) Market 2020 - 2024 ($ million)

5.2 End-user segment analysis 2020 - 2024

Historic Market Size - End-user Segment 2020 - 2024 ($ million)

5.3 Device segment analysis 2020 - 2024

Historic Market Size - Device Segment 2020 - 2024 ($ million)

5.4 Age Group segment analysis 2020 - 2024

Historic Market Size - Age Group Segment 2020 - 2024 ($ million)

5.5 Geography segment analysis 2020 - 2024

Historic Market Size - Geography Segment 2020 - 2024 ($ million)

5.6 Country segment analysis 2020 - 2024

Historic Market Size - Country Segment 2020 - 2024 ($ million)

6. Qualitative Analysis

6.1 Impact of AI on global assistive technology (AT) market

6.2 Impact of geopolitical conflicts on global assistive technology (AT) market

7. Five Forces Analysis

7.1 Five forces summary

Five forces analysis - Comparison between 2025 and 2030

7.2 Bargaining power of buyers

Bargaining power of buyers - Impact of key factors 2025 and 2030

7.3 Bargaining power of suppliers

Bargaining power of suppliers - Impact of key factors in 2025 and 2030

7.4 Threat of new entrants

Threat of new entrants - Impact of key factors in 2025 and 2030

7.5 Threat of substitutes

Threat of substitutes - Impact of key factors in 2025 and 2030

7.6 Threat of rivalry

Threat of rivalry - Impact of key factors in 2025 and 2030

7.7 Market condition

Chart on Market condition - Five forces 2025 and 2030

8. Market Segmentation by End-user

8.1 Market segments

Chart on End-user - Market share 2025-2030 (%)
Data Table on End-user - Market share 2025-2030 (%)

8.2 Comparison by End-user

Chart on Comparison by End-user
Data Table on Comparison by End-user

8.3 Hospitals - Market size and forecast 2025-2030

Chart on Hospitals - Market size and forecast 2025-2030 ($ million)
Data Table on Hospitals - Market size and forecast 2025-2030 ($ million)
Chart on Hospitals - Year-over-year growth 2025-2030 (%)
Data Table on Hospitals - Year-over-year growth 2025-2030 (%)

8.4 Homecare settings - Market size and forecast 2025-2030

Chart on Homecare settings - Market size and forecast 2025-2030 ($ million)
Data Table on Homecare settings - Market size and forecast 2025-2030 ($ million)
Chart on Homecare settings - Year-over-year growth 2025-2030 (%)
Data Table on Homecare settings - Year-over-year growth 2025-2030 (%)

8.5 Others - Market size and forecast 2025-2030

Chart on Others - Market size and forecast 2025-2030 ($ million)
Data Table on Others - Market size and forecast 2025-2030 ($ million)
Chart on Others - Year-over-year growth 2025-2030 (%)
Data Table on Others - Year-over-year growth 2025-2030 (%)

8.6 Market opportunity by End-user

Market opportunity by End-user ($ million)
Data Table on Market opportunity by End-user ($ million)

9. Market Segmentation by Device

9.1 Market segments

Chart on Device - Market share 2025-2030 (%)
Data Table on Device - Market share 2025-2030 (%)

9.2 Comparison by Device

Chart on Comparison by Device
Data Table on Comparison by Device

9.3 Sensory aids - Market size and forecast 2025-2030

Chart on Sensory aids - Market size and forecast 2025-2030 ($ million)
Data Table on Sensory aids - Market size and forecast 2025-2030 ($ million)
Chart on Sensory aids - Year-over-year growth 2025-2030 (%)
Data Table on Sensory aids - Year-over-year growth 2025-2030 (%)

9.4 Mobility aids - Market size and forecast 2025-2030

Chart on Mobility aids - Market size and forecast 2025-2030 ($ million)
Data Table on Mobility aids - Market size and forecast 2025-2030 ($ million)
Chart on Mobility aids - Year-over-year growth 2025-2030 (%)
Data Table on Mobility aids - Year-over-year growth 2025-2030 (%)

9.5 Others - Market size and forecast 2025-2030

Chart on Others - Market size and forecast 2025-2030 ($ million)
Data Table on Others - Market size and forecast 2025-2030 ($ million)
Chart on Others - Year-over-year growth 2025-2030 (%)
Data Table on Others - Year-over-year growth 2025-2030 (%)

9.6 Market opportunity by Device

Market opportunity by Device ($ million)
Data Table on Market opportunity by Device ($ million)

10. Market Segmentation by Age Group

10.1 Market segments

Chart on Age Group - Market share 2025-2030 (%)
Data Table on Age Group - Market share 2025-2030 (%)

10.2 Comparison by Age Group

Chart on Comparison by Age Group
Data Table on Comparison by Age Group

10.3 Senior citizens - Market size and forecast 2025-2030

Chart on Senior citizens - Market size and forecast 2025-2030 ($ million)
Data Table on Senior citizens - Market size and forecast 2025-2030 ($ million)
Chart on Senior citizens - Year-over-year growth 2025-2030 (%)
Data Table on Senior citizens - Year-over-year growth 2025-2030 (%)

10.4 Adults - Market size and forecast 2025-2030

Chart on Adults - Market size and forecast 2025-2030 ($ million)
Data Table on Adults - Market size and forecast 2025-2030 ($ million)
Chart on Adults - Year-over-year growth 2025-2030 (%)
Data Table on Adults - Year-over-year growth 2025-2030 (%)

10.5 Children - Market size and forecast 2025-2030

Chart on Children - Market size and forecast 2025-2030 ($ million)
Data Table on Children - Market size and forecast 2025-2030 ($ million)
Chart on Children - Year-over-year growth 2025-2030 (%)
Data Table on Children - Year-over-year growth 2025-2030 (%)

10.6 Market opportunity by Age Group

Market opportunity by Age Group ($ million)
Data Table on Market opportunity by Age Group ($ million)

11. Customer Landscape

11.1 Customer landscape overview

Analysis of price sensitivity, lifecycle, customer purchase basket, adoption rates, and purchase criteria

12. Geographic Landscape

12.1 Geographic segmentation

Chart on Market share by geography 2025-2030 (%)
Data Table on Market share by geography 2025-2030 (%)

12.2 Geographic comparison

Chart on Geographic comparison
Data Table on Geographic comparison

12.3 North America - Market size and forecast 2025-2030

Chart on North America - Market size and forecast 2025-2030 ($ million)
Data Table on North America - Market size and forecast 2025-2030 ($ million)
Chart on North America - Year-over-year growth 2025-2030 (%)
Data Table on North America - Year-over-year growth 2025-2030 (%)
Chart on Regional Comparison - North America
Data Table on Regional Comparison - North America

12.3.1 US - Market size and forecast 2025-2030

Chart on US - Market size and forecast 2025-2030 ($ million)
Data Table on US - Market size and forecast 2025-2030 ($ million)
Chart on US - Year-over-year growth 2025-2030 (%)
Data Table on US - Year-over-year growth 2025-2030 (%)

12.3.2 Canada - Market size and forecast 2025-2030

Chart on Canada - Market size and forecast 2025-2030 ($ million)
Data Table on Canada - Market size and forecast 2025-2030 ($ million)
Chart on Canada - Year-over-year growth 2025-2030 (%)
Data Table on Canada - Year-over-year growth 2025-2030 (%)

12.3.3 Mexico - Market size and forecast 2025-2030

Chart on Mexico - Market size and forecast 2025-2030 ($ million)
Data Table on Mexico - Market size and forecast 2025-2030 ($ million)
Chart on Mexico - Year-over-year growth 2025-2030 (%)
Data Table on Mexico - Year-over-year growth 2025-2030 (%)

12.4 Europe - Market size and forecast 2025-2030

Chart on Europe - Market size and forecast 2025-2030 ($ million)
Data Table on Europe - Market size and forecast 2025-2030 ($ million)
Chart on Europe - Year-over-year growth 2025-2030 (%)
Data Table on Europe - Year-over-year growth 2025-2030 (%)
Chart on Regional Comparison - Europe
Data Table on Regional Comparison - Europe

12.4.1 Germany - Market size and forecast 2025-2030

Chart on Germany - Market size and forecast 2025-2030 ($ million)
Data Table on Germany - Market size and forecast 2025-2030 ($ million)
Chart on Germany - Year-over-year growth 2025-2030 (%)
Data Table on Germany - Year-over-year growth 2025-2030 (%)

12.4.2 UK - Market size and forecast 2025-2030

Chart on UK - Market size and forecast 2025-2030 ($ million)
Data Table on UK - Market size and forecast 2025-2030 ($ million)
Chart on UK - Year-over-year growth 2025-2030 (%)
Data Table on UK - Year-over-year growth 2025-2030 (%)

12.4.3 France - Market size and forecast 2025-2030

Chart on France - Market size and forecast 2025-2030 ($ million)
Data Table on France - Market size and forecast 2025-2030 ($ million)
Chart on France - Year-over-year growth 2025-2030 (%)
Data Table on France - Year-over-year growth 2025-2030 (%)

12.4.4 Italy - Market size and forecast 2025-2030

Chart on Italy - Market size and forecast 2025-2030 ($ million)
Data Table on Italy - Market size and forecast 2025-2030 ($ million)
Chart on Italy - Year-over-year growth 2025-2030 (%)
Data Table on Italy - Year-over-year growth 2025-2030 (%)

12.4.5 Spain - Market size and forecast 2025-2030

Chart on Spain - Market size and forecast 2025-2030 ($ million)
Data Table on Spain - Market size and forecast 2025-2030 ($ million)
Chart on Spain - Year-over-year growth 2025-2030 (%)
Data Table on Spain - Year-over-year growth 2025-2030 (%)

12.4.6 The Netherlands - Market size and forecast 2025-2030

Chart on The Netherlands - Market size and forecast 2025-2030 ($ million)
Data Table on The Netherlands - Market size and forecast 2025-2030 ($ million)
Chart on The Netherlands - Year-over-year growth 2025-2030 (%)
Data Table on The Netherlands - Year-over-year growth 2025-2030 (%)

12.5 Asia - Market size and forecast 2025-2030

Chart on Asia - Market size and forecast 2025-2030 ($ million)
Data Table on Asia - Market size and forecast 2025-2030 ($ million)
Chart on Asia - Year-over-year growth 2025-2030 (%)
Data Table on Asia - Year-over-year growth 2025-2030 (%)
Chart on Regional Comparison - Asia
Data Table on Regional Comparison - Asia

12.5.1 China - Market size and forecast 2025-2030

Chart on China - Market size and forecast 2025-2030 ($ million)
Data Table on China - Market size and forecast 2025-2030 ($ million)
Chart on China - Year-over-year growth 2025-2030 (%)
Data Table on China - Year-over-year growth 2025-2030 (%)

12.5.2 Japan - Market size and forecast 2025-2030

Chart on Japan - Market size and forecast 2025-2030 ($ million)
Data Table on Japan - Market size and forecast 2025-2030 ($ million)
Chart on Japan - Year-over-year growth 2025-2030 (%)
Data Table on Japan - Year-over-year growth 2025-2030 (%)

12.5.3 India - Market size and forecast 2025-2030

Chart on India - Market size and forecast 2025-2030 ($ million)
Data Table on India - Market size and forecast 2025-2030 ($ million)
Chart on India - Year-over-year growth 2025-2030 (%)
Data Table on India - Year-over-year growth 2025-2030 (%)

12.5.4 South Korea - Market size and forecast 2025-2030

Chart on South Korea - Market size and forecast 2025-2030 ($ million)
Data Table on South Korea - Market size and forecast 2025-2030 ($ million)
Chart on South Korea - Year-over-year growth 2025-2030 (%)
Data Table on South Korea - Year-over-year growth 2025-2030 (%)

12.5.5 Singapore - Market size and forecast 2025-2030

Chart on Singapore - Market size and forecast 2025-2030 ($ million)
Data Table on Singapore - Market size and forecast 2025-2030 ($ million)
Chart on Singapore - Year-over-year growth 2025-2030 (%)
Data Table on Singapore - Year-over-year growth 2025-2030 (%)

12.5.6 Thailand - Market size and forecast 2025-2030

Chart on Thailand - Market size and forecast 2025-2030 ($ million)
Data Table on Thailand - Market size and forecast 2025-2030 ($ million)
Chart on Thailand - Year-over-year growth 2025-2030 (%)
Data Table on Thailand - Year-over-year growth 2025-2030 (%)

12.6 Rest of World (ROW) - Market size and forecast 2025-2030

Chart on Rest of World (ROW) - Market size and forecast 2025-2030 ($ million)
Data Table on Rest of World (ROW) - Market size and forecast 2025-2030 ($ million)
Chart on Rest of World (ROW) - Year-over-year growth 2025-2030 (%)
Data Table on Rest of World (ROW) - Year-over-year growth 2025-2030 (%)
Chart on Regional Comparison - Rest of World (ROW)
Data Table on Regional Comparison - Rest of World (ROW)

12.6.1 Brazil - Market size and forecast 2025-2030

Chart on Brazil - Market size and forecast 2025-2030 ($ million)
Data Table on Brazil - Market size and forecast 2025-2030 ($ million)
Chart on Brazil - Year-over-year growth 2025-2030 (%)
Data Table on Brazil - Year-over-year growth 2025-2030 (%)

12.6.2 Saudi Arabia - Market size and forecast 2025-2030

Chart on Saudi Arabia - Market size and forecast 2025-2030 ($ million)
Data Table on Saudi Arabia - Market size and forecast 2025-2030 ($ million)
Chart on Saudi Arabia - Year-over-year growth 2025-2030 (%)
Data Table on Saudi Arabia - Year-over-year growth 2025-2030 (%)

12.6.3 UAE - Market size and forecast 2025-2030

Chart on UAE - Market size and forecast 2025-2030 ($ million)
Data Table on UAE - Market size and forecast 2025-2030 ($ million)
Chart on UAE - Year-over-year growth 2025-2030 (%)
Data Table on UAE - Year-over-year growth 2025-2030 (%)

12.6.4 South Africa - Market size and forecast 2025-2030

Chart on South Africa - Market size and forecast 2025-2030 ($ million)
Data Table on South Africa - Market size and forecast 2025-2030 ($ million)
Chart on South Africa - Year-over-year growth 2025-2030 (%)
Data Table on South Africa - Year-over-year growth 2025-2030 (%)

12.6.5 Argentina - Market size and forecast 2025-2030

Chart on Argentina - Market size and forecast 2025-2030 ($ million)
Data Table on Argentina - Market size and forecast 2025-2030 ($ million)
Chart on Argentina - Year-over-year growth 2025-2030 (%)
Data Table on Argentina - Year-over-year growth 2025-2030 (%)

12.6.6 Israel - Market size and forecast 2025-2030

Chart on Israel - Market size and forecast 2025-2030 ($ million)
Data Table on Israel - Market size and forecast 2025-2030 ($ million)
Chart on Israel - Year-over-year growth 2025-2030 (%)
Data Table on Israel - Year-over-year growth 2025-2030 (%)

12.6.7 Egypt - Market size and forecast 2025-2030

Chart on Egypt - Market size and forecast 2025-2030 ($ million)
Data Table on Egypt - Market size and forecast 2025-2030 ($ million)
Chart on Egypt - Year-over-year growth 2025-2030 (%)
Data Table on Egypt - Year-over-year growth 2025-2030 (%)

12.6.8 Chile - Market size and forecast 2025-2030

Chart on Chile - Market size and forecast 2025-2030 ($ million)
Data Table on Chile - Market size and forecast 2025-2030 ($ million)
Chart on Chile - Year-over-year growth 2025-2030 (%)
Data Table on Chile - Year-over-year growth 2025-2030 (%)

12.7 Market opportunity by geography

Market opportunity by geography ($ million)
Data Tables on Market opportunity by geography ($ million)

13. Drivers, Challenges, and Opportunity

13.1 Market drivers

Rapid global demographic aging accelerating demand for age in place assistive infrastructure
Rising prevalence chronic diseases and traumatic physical conditions driving mobility innovation
Progressive national disability legislation and inclusive workplace policy mandates expanding market access

13.2 Market challenges

High capital costs and inadequate public reimbursement frameworks hindering assistive technology adoption
Fragmented regulatory compliance standards and prolonged medical device certification timelines
Severe shortages qualified rehabilitation specialists and inadequate digital training networks

13.3 Impact of drivers and challenges

Impact of drivers and challenges in 2025 and 2030

13.4 Market opportunities

Deep AI sensation processing integration transforming adaptive communication tools
Convergence consumer wearables with medical assistive hardware creating hybrid devices
Accelerated scale up additive manufacturing personalized prosthetics mass customization frameworks

14. Competitive Landscape

14.1 Overview

14.2

Overview on criticality of inputs and factors of differentiation

14.3 Landscape disruption

Overview on factors of disruption

14.4 Industry risks

Impact of key risks on business

15. Competitive Analysis

15.1 Companies profiled

Companies covered

15.2 Company ranking index

15.3 Market positioning of companies

Matrix on companies position and classification

15.4 Cochlear Ltd.

Cochlear Ltd. - Overview
Cochlear Ltd. - Business segments
Cochlear Ltd. - Key offerings
Cochlear Ltd. - Segment focus
SWOT

15.5 Demant AS

Demant AS - Overview
Demant AS - Business segments
Demant AS - Key offerings
Demant AS - Segment focus
SWOT

15.6 GN Store Nord AS

GN Store Nord AS - Overview
GN Store Nord AS - Business segments
GN Store Nord AS - Key offerings
GN Store Nord AS - Segment focus
SWOT

15.7 Invacare Corp.

Invacare Corp. - Overview
Invacare Corp. - Product / Service
Invacare Corp. - Key offerings
SWOT

15.8 MED EL Medical Electronics

MED EL Medical Electronics - Overview
MED EL Medical Electronics - Product / Service
MED EL Medical Electronics - Key offerings
SWOT

15.9 Ossur hf.

Ossur hf. - Overview
Ossur hf. - Business segments
Ossur hf. - Key offerings
Ossur hf. - Segment focus
SWOT

15.10 Ottobock SE and Co. KGaA

Ottobock SE and Co. KGaA - Overview
Ottobock SE and Co. KGaA - Product / Service
Ottobock SE and Co. KGaA - Key offerings
SWOT

15.11 Permobil AB

Permobil AB - Overview
Permobil AB - Product / Service
Permobil AB - Key offerings
SWOT

15.12 PRC Saltillo

PRC Saltillo - Overview
PRC Saltillo - Product / Service
PRC Saltillo - Key offerings
SWOT

15.13 Pride Mobility Products Corp.

Pride Mobility Products Corp. - Overview
Pride Mobility Products Corp. - Product / Service
Pride Mobility Products Corp. - Key offerings
SWOT

15.14 Sonova AG

Sonova AG - Overview
Sonova AG - Business segments
Sonova AG - Key offerings
Sonova AG - Segment focus
SWOT

15.15 Starkey Laboratories Inc.

Starkey Laboratories Inc. - Overview
Starkey Laboratories Inc. - Product / Service
Starkey Laboratories Inc. - Key offerings
SWOT

15.16 Sunrise Medical LLC

Sunrise Medical LLC - Overview
Sunrise Medical LLC - Product / Service
Sunrise Medical LLC - Key offerings
SWOT

15.17 Vispero

Vispero - Overview
Vispero - Product / Service
Vispero - Key offerings
SWOT

15.18 WS Audiology AS

WS Audiology AS - Overview
WS Audiology AS - Product / Service
WS Audiology AS - Key offerings
SWOT

16. Appendix

16.1 Scope of the report

Market definition
Objectives
Notes and caveats

16.2 Inclusions and exclusions checklist

Inclusions checklist
Exclusions checklist

16.3 Currency conversion rates for US$

16.4 Research methodology

16.5 Data procurement

Information sources

16.6 Data validation

16.7 Validation techniques employed for market sizing

16.8 Data synthesis

16.9 360 degree market analysis

16.10 List of abbreviations

Research Methodology

Technavio presents a detailed picture of the market by way of study, synthesis, and summation of data from multiple sources. The analysts have presented the various facets of the market with a particular focus on identifying the key industry influencers. The data thus presented is comprehensive, reliable, and the result of extensive research, both primary and secondary.

INFORMATION SOURCES

Primary sources

  • Manufacturers and suppliers
  • Channel partners
  • Industry experts
  • Strategic decision makers

Secondary sources

  • Industry journals and periodicals
  • Government data
  • Financial reports of key industry players
  • Historical data
  • Press releases

DATA ANALYSIS

Data Synthesis

  • Collation of data
  • Estimation of key figures
  • Analysis of derived insights

Data Validation

  • Triangulation with data models
  • Reference against proprietary databases
  • Corroboration with industry experts

REPORT WRITING

Qualitative

  • Market drivers
  • Market challenges
  • Market trends
  • Five forces analysis

Quantitative

  • Market size and forecast
  • Market segmentation
  • Geographical insights
  • Competitive landscape

Interested in this report?

Get your sample now to see our research methodology and insights!

Download Now

Frequently Asked Questions

Assistive Technology (At) market growth will increase by USD 6400.3 million during 2026-2030.

The Assistive Technology (At) market is expected to grow at a CAGR of 4.4% during 2026-2030.

Assistive Technology (At) market is segmented by End-user (Hospitals, Homecare settings, Others) Device (Sensory aids, Mobility aids, Others) Age group (Senior citizens, Adults, Children)

AbleNet Inc., Cochlear Ltd., Demant AS, Drive DeVilbiss Healthcare, Eschenbach Optik GmbH, Fillauer LLC, GN Store Nord AS, HumanWare Group, Invacare Corp., MED EL Medical Electronics, Ossur hf., Ottobock SE and Co. KGaA, Permobil AB, PRC Saltillo, Pride Mobility Products Corp., Sonova AG, Starkey Laboratories Inc., Sunrise Medical LLC, Vispero, WS Audiology AS are a few of the key vendors in the Assistive Technology (At) market.

Europe will register the highest growth rate of 36.2% among the other regions. Therefore, the Assistive Technology (At) market in Europe is expected to garner significant business opportunities for the vendors during the forecast period.

US, Canada, Mexico, Germany, UK, France, Italy, Spain, The Netherlands, China, Japan, India, South Korea, Singapore, Thailand, Brazil, Saudi Arabia, UAE, South Africa, Argentina, Israel, Egypt, Chile

  • Rapid global demographic aging accelerating demand for age in place assistive infrastructure is the driving factor this market.

The Assistive Technology (At) market vendors should focus on grabbing business opportunities from the End-user segment as it accounted for the largest market share in the base year.
RIA - Research AI Assistant
Ask RIA
