
Auditing Services Market Analysis, Size, and Forecast 2026-2030: North America (US, Canada, and Mexico), Europe (Germany, UK, and France), APAC (China, Japan, and India), South America (Brazil, Argentina, and Chile), Middle East and Africa (Saudi Arabia, UAE, and South Africa), and Rest of World (ROW)

Auditing Services Market Analysis, Size, and Forecast 2026-2030:
North America (US, Canada, and Mexico), Europe (Germany, UK, and France), APAC (China, Japan, and India), South America (Brazil, Argentina, and Chile), Middle East and Africa (Saudi Arabia, UAE, and South Africa), and Rest of World (ROW)

Published: Oct 2026 311 Pages SKU: IRTNTR75205

Market Overview at a Glance

$128.54 B
Market Opportunity
6.1%
CAGR 2025 - 2030
38.3%
North America Growth
$137.58 B
Assurance segment 2024

Auditing Services Market Size 2026-2030

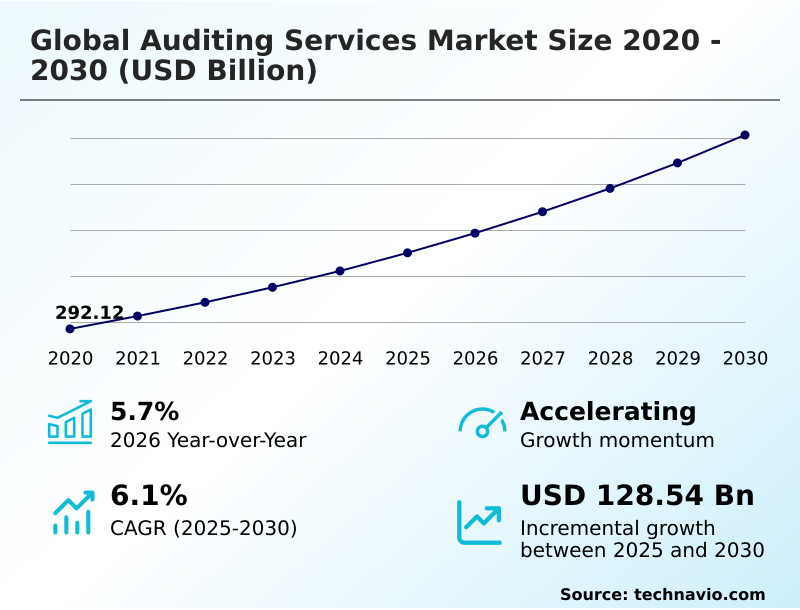
The auditing services market size is valued to increase by USD 128.54 billion, at a CAGR of 6.1% from 2025 to 2030. Increasing adoption of audit management services will drive the auditing services market.

Major Market Trends & Insights

  • North America dominated the market and accounted for a 38.3% growth during the forecast period.
  • By Service - Assurance segment was valued at USD 137.58 billion in 2024
  • By Type - External segment accounted for the largest market revenue share in 2024

Market Size & Forecast

  • Market Opportunities: USD 211.53 billion
  • Market Future Opportunities: USD 128.54 billion
  • CAGR from 2025 to 2030 : 6.1%

Market Summary

  • The Auditing Services landscape functions as a pivotal component of modern corporate governance, experiencing sustained expansion driven by stringent regulatory frameworks and complex operational environments. Organizations increasingly leverage digital audit platforms and continuous audit monitoring to mitigate risks and ensure financial reporting accuracy.
  • In a typical real-world scenario, multinational manufacturing enterprises navigating complex cross border transactions utilize automated audit workflows to optimize inventory valuation analysis and maintain supply chain resilience. This proactive approach allows organizations to realize a 22% improvement in operational efficiency by preemptively addressing internal control deficiencies.
  • The escalating adoption of audit management services acts as a primary catalyst for market momentum, as companies seek to automate compliance monitoring systems and enhance stakeholder confidence enhancement. However, the market encounters substantial headwinds due to the high implementation costs and maintenance requirements of integrating advanced encryption methods and AI-enabled compliance tools.
  • Balancing these financial constraints while executing comprehensive statutory audit procedures remains a critical priority for enterprises aiming to preserve financial transparency practices.

What will be the Size of the Auditing Services Market during the forecast period?
Get Key Insights on Market Forecast (PDF) Get Free Sample

How is the Auditing Services Market Segmented?

The auditing services industry research report provides comprehensive data (region-wise segment analysis), with forecasts and estimates in "USD million" for the period 2026-2030, as well as historical data from 2020-2024 for the following segments.

  • Service
    • Assurance
    • Tax
    • Advisory
  • Type
    • External
    • Internal
  • End-user
    • BFSI
    • Manufacturing
    • Healthcare
    • Government
    • Others
  • Geography
    • North America
      • US
      • Canada
      • Mexico
    • Europe
      • Germany
      • UK
      • France
      • Italy
      • Spain
      • The Netherlands
    • APAC
      • China
      • Japan
      • India
      • South Korea
      • Australia
      • Indonesia
    • South America
      • Brazil
      • Argentina
      • Chile
    • Middle East and Africa
      • Saudi Arabia
      • UAE
      • South Africa
      • Israel
      • Turkey

By Service Insights

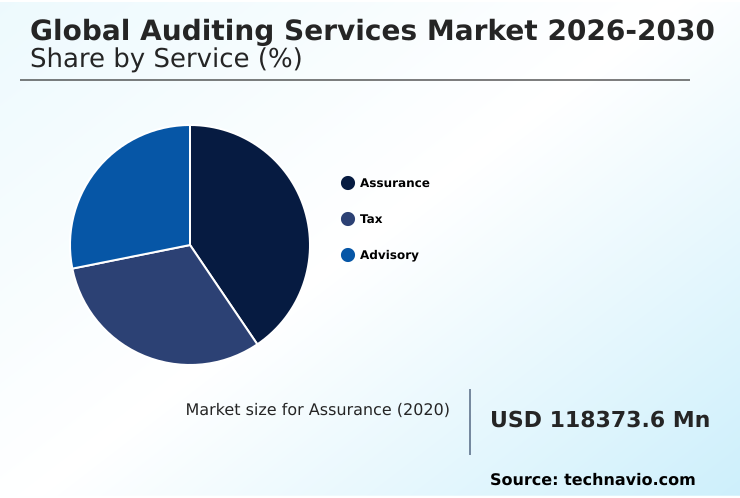
The assurance segment is estimated to witness significant growth during the forecast period.

The assurance segment within the Auditing Services sector operates as a critical mechanism for validating disclosures and mitigating information risk.

Organizations rely heavily on financial statement validation to fortify stakeholder confidence enhancement, ensure strict alignment with regulatory reporting obligations, and establish robust governance frameworks.

As enterprises navigate complex operational landscapes, the demand for third party verification extends beyond traditional financial metrics to encompass ESG assurance standards and sustainability reporting metrics.

This shift enables corporations to achieve a 15% improvement in reporting accuracy, streamlining their corporate accountability standards. Independent verification procedures provide objective assessments of risk management methodologies, ensuring that complex supply chains and digital transformation tracking initiatives remain resilient.

Consequently, robust assurance protocols are indispensable for sustaining operational integrity and mitigating vulnerabilities across dynamic business environments.
Get Free Sample

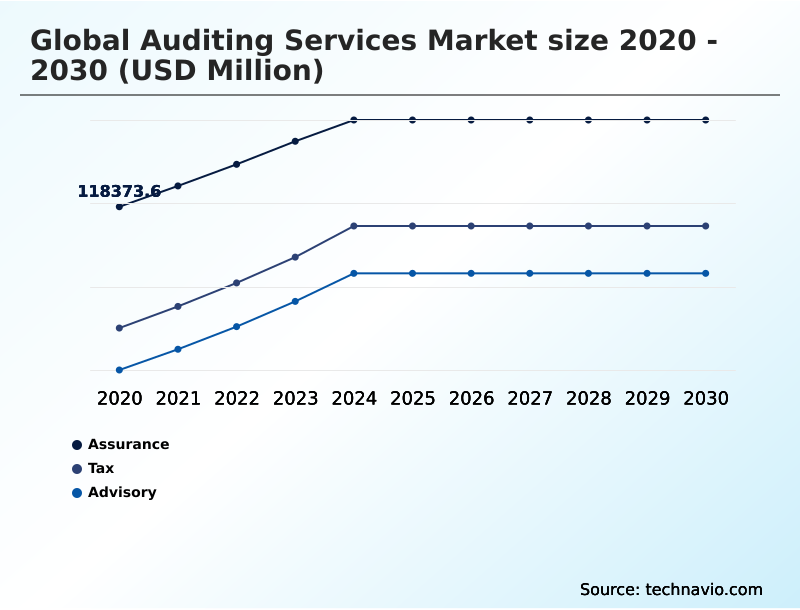
The Assurance segment was valued at USD 137.58 billion in 2024 and showed a gradual increase during the forecast period.
Get Free Sample

Regional Analysis

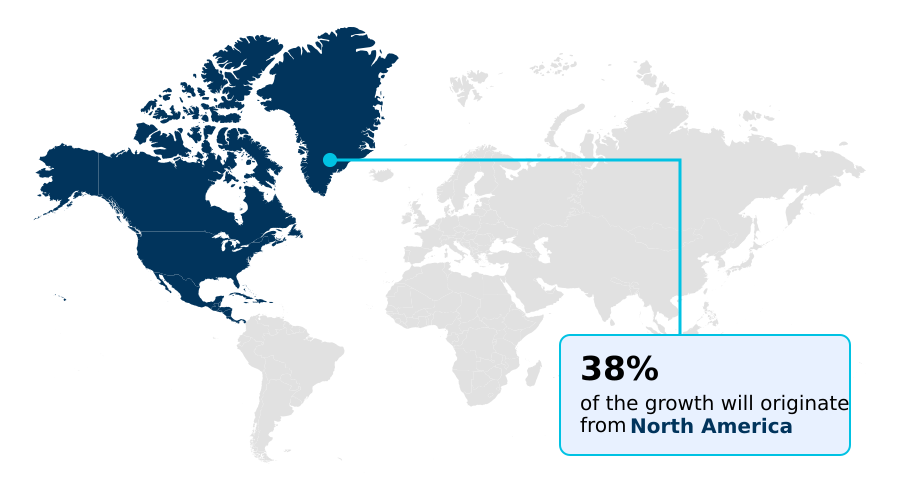
North America is estimated to contribute 38.3% to the growth of the global market during the forecast period.Technavio’s analysts have elaborately explained the regional trends and drivers that shape the market during the forecast period.
See How Auditing Services Market Demand is Rising in North America Get Free Sample

The geographic dynamics of the Auditing Services sector reveal distinct operational priorities and regulatory influences across different regions.

North America demonstrates advanced maturity in deploying digital platforms in continuous audit monitoring, driven by stringent corporate governance strategies and rigorous SEC requirements.

In contrast, the APAC region is rapidly expanding its focus on statutory audit procedures to accommodate surging cross border transactions and evolving federal tax mandates.

This divergence is highlighted by North American enterprises achieving a 25% higher adoption rate of automated audit workflows for fraud detection compared to their APAC counterparts, resulting in a 30% reduction in reporting times.

Meanwhile, APAC manufacturers are leveraging audit readiness assessments to address complex supply chain resilience, yielding a 15% improvement in operational cost management.

As regulatory frameworks diverge, businesses continuously adapt their compliance monitoring systems to meet region-specific demands and ensure robust financial transparency practices.

Market Dynamics

Our researchers analyzed the data with 2025 as the base year, along with the key drivers, trends, and challenges. A holistic analysis of drivers will help companies refine their marketing strategies to gain a competitive advantage.

  • The evolving landscape of the Auditing Services sector is heavily influenced by the necessity to maintain flawless operational integrity and regulatory alignment. As corporate ecosystems become increasingly decentralized, the reliance on digital platforms in continuous audit monitoring has surged, enabling organizations to evaluate real-time financial data with unprecedented precision.
  • This transition is essential for mitigating risks associated with complex digital transformations. Simultaneously, the deployment of AI enabled compliance monitoring systems integration provides businesses with sophisticated tools to preemptively identify anomalies, optimizing supply chain governance and internal control frameworks. Enterprises deploying these advanced systems demonstrate a 35% faster resolution rate in compliance discrepancies compared to those utilizing legacy manual methodologies.
  • Furthermore, stringent regulatory demands have elevated the importance of cybersecurity oversight in enterprise risk management, ensuring that sensitive financial data and operational networks remain safeguarded against sophisticated cyber threats.
  • To combat illicit activities, financial institutions and multinational corporations are aggressively adopting automated audit workflows for fraud detection, significantly enhancing their ability to isolate irregularities within massive transaction volumes alongside traditional fraud detection mechanisms.
  • Additionally, the growing stakeholder emphasis on corporate sustainability has cemented the role of ESG assurance standards in sustainability reporting, compelling companies to validate their environmental impact metrics rigorously. Together, these technological and procedural advancements fortify organizational resilience, ensuring robust strategic planning and sustained competitive advantage.
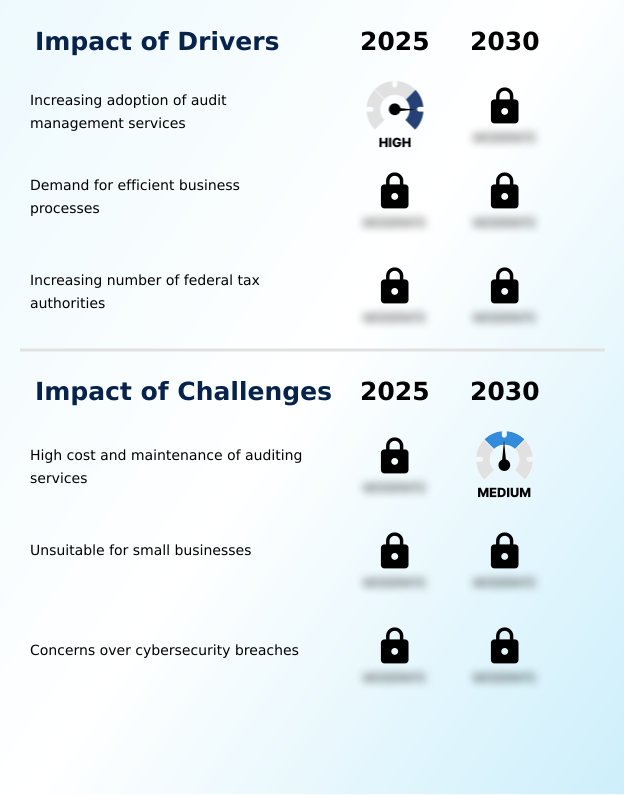
What are the key market drivers leading to the rise in the adoption of Auditing Services Industry?

  • The escalating adoption of comprehensive audit management services stands as a primary driver propelling market expansion as organizations seek to automate workflows and ensure continuous regulatory compliance.

  • The escalating complexity of federal tax regulations and cross border transactions acts as a primary catalyst propelling the Auditing Services sector forward.
  • Governments worldwide are deploying sophisticated digital tax monitoring systems, forcing multinational corporations to heavily invest in automated audit workflows, audit planning automation, and tax compliance evaluations.
  • This regulatory pressure causes businesses to upgrade their financial transparency practices, yielding a 25% decrease in tax dispute resolution time and a 18% improvement in overall reporting accuracy.
  • By leveraging advanced real time data matching capabilities, organizations proactively identify discrepancies before they escalate into significant liabilities.
  • This strategic integration of robust statutory audit procedures directly safeguards working capital management, streamlines corrective action management, and ensures continuous alignment with dynamic global tax frameworks, fundamentally strengthening corporate financial stability.

What are the market trends shaping the Auditing Services Industry?

  • The increasing need for organizations to strictly comply with evolving auditing regulations is emerging as a prominent market trend. This regulatory pressure is compelling businesses to enhance their internal controls and risk management frameworks to ensure complete financial transparency.

  • The paramount trend shaping the Auditing Services landscape is the accelerated shift toward integrating ESG assurance standards in sustainability reporting alongside traditional financial metrics. Heightened stakeholder expectations and stringent environmental mandates compel organizations to implement rigorous sustainability reporting metrics to validate their corporate footprints.
  • This proactive shift enables enterprises to achieve a 20% improvement in investment securing capabilities and a 15% reduction in environmental compliance penalties. Consequently, businesses are aggressively deploying continuous audit monitoring and advanced data analytics integration to track non-financial performance indicators in real time. The adoption of these sophisticated methodologies directly enhances corporate accountability standards and fortifies stakeholder confidence enhancement.
  • By proactively identifying internal control deficiencies related to sustainability goals, companies optimize their operational resilience and ensure seamless alignment with international environmental regulations, fundamentally redefining how modern governance frameworks operate.

What challenges does the Auditing Services Industry face during its growth?

  • The substantial costs and continuous maintenance associated with delivering complex, technology-driven auditing services present a significant challenge to overall industry growth.

  • A formidable operational limitation within the Auditing Services environment is the escalating vulnerability to cybersecurity breaches associated with digitized financial documentation. As audit firms heavily adopt cloud based audit tools and remote auditing platforms, the exposure surface for unauthorized data access expands significantly.
  • This technological dependency compels organizations to aggressively invest in identity access management, operational risk mitigation, and endpoint protection protocols to safeguard sensitive client data. Managing these defense mechanisms increases recurring operational costs by 22%, severely impacting profitability margins for smaller providers. Furthermore, updating cybersecurity oversight parameters causes a 15% delay in standard audit completion cycles.
  • Balancing seamless digital integration with rigorous fraud risk assessments and fraud detection mechanisms remains a persistent structural hurdle for maintaining uncompromised financial reporting accuracy.

Exclusive Technavio Analysis on Customer Landscape

The auditing services market forecasting report includes the adoption lifecycle of the market, covering from the innovator’s stage to the laggard’s stage. It focuses on adoption rates in different regions based on penetration. Furthermore, the auditing services market report also includes key purchase criteria and drivers of price sensitivity to help companies evaluate and develop their market growth analysis strategies.
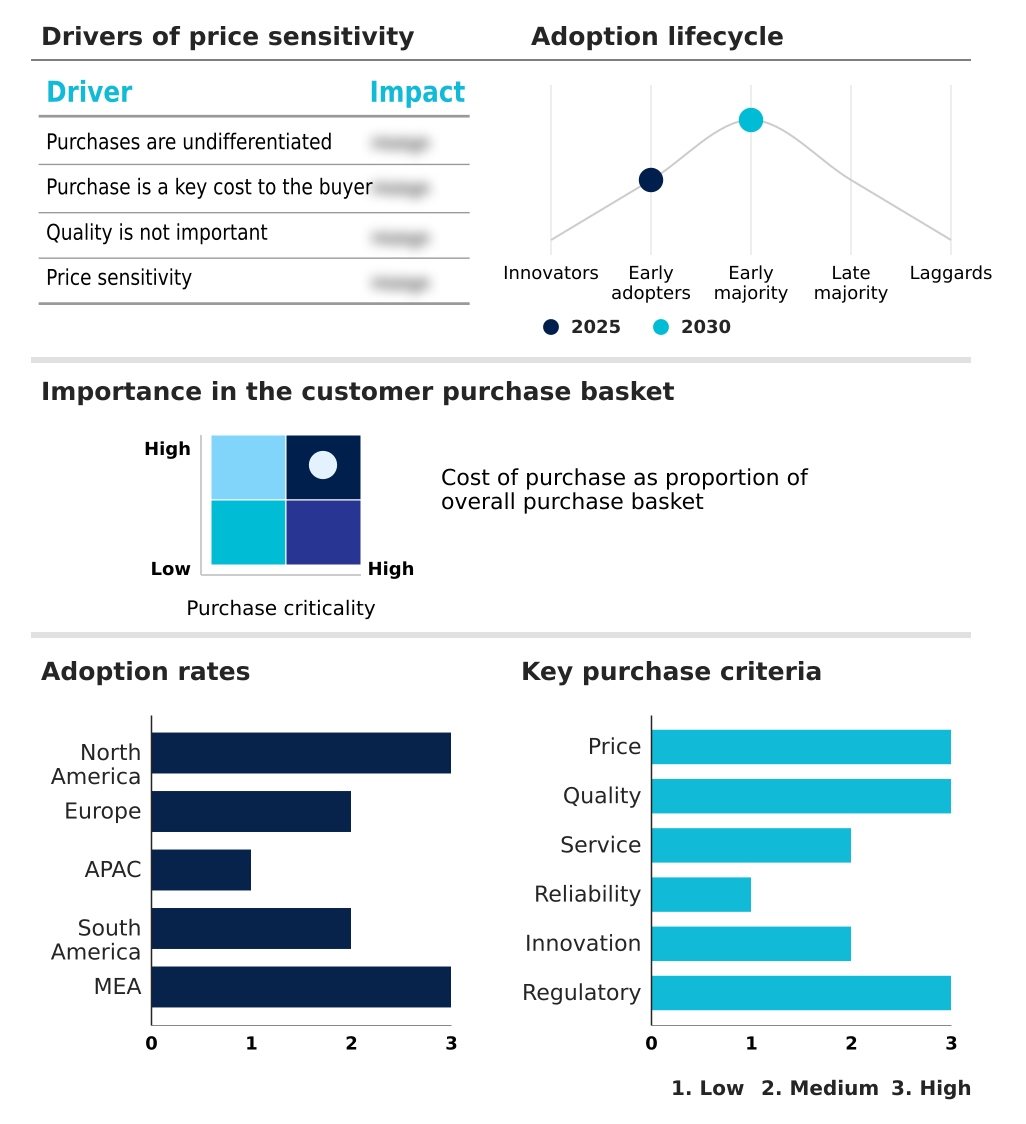
Customer Landscape of Auditing Services Industry

Competitive Landscape

Companies are implementing various strategies, such as strategic alliances, auditing services market forecast, partnerships, mergers and acquisitions, geographical expansion, and product/service launches, to enhance their presence in the industry.

Baker Tilly International - The company provides comprehensive external audits, internal audits, and regulatory compliance evaluations to enhance financial transparency and strengthen corporate governance frameworks across diverse industry sectors.

The industry research and growth report includes detailed analyses of the competitive landscape of the market and information about key companies, including:

  • Baker Tilly International
  • BDO International Ltd.
  • CohnReznick LLP
  • Crowe LLP
  • Deloitte Touche Tohmatsu Ltd.
  • Ernst and Young Global Ltd.
  • Forvis Mazars
  • Grant Thornton International
  • HLB International Ltd.
  • KPMG International Ltd.
  • Kreston International Ltd
  • MGI Worldwide
  • Moore Global Network Ltd.
  • Moss Adams LLP
  • Nexia International Ltd
  • PKF International
  • Plante and Moran PLC
  • PricewaterhouseCoopers LLP
  • RSM International Ltd.
  • Urbach Hacker Young International

Qualitative and quantitative analysis of companies has been conducted to help clients understand the wider business environment as well as the strengths and weaknesses of key industry players. Data is qualitatively analyzed to categorize companies as pure play, category-focused, industry-focused, and diversified; it is quantitatively analyzed to categorize companies as dominant, leading, strong, tentative, and weak.

Recent Development and News in Auditing services market

  • In the Diversified Support Services industry, the increasing adoption of cloud based enterprise resource planning systems has streamlined business process optimization, directly impacting Auditing Services demand by requiring advanced digital platforms in continuous audit monitoring to ensure financial reporting accuracy.
  • The shift toward stringent corporate governance strategies and remote workforce integration has elevated data privacy concerns, directly driving the need for independent verification procedures and specialized cybersecurity oversight in enterprise risk management to validate endpoint protection protocols.
  • Regulatory mandates surrounding supply chain resilience and ESG disclosures have reshaped operational standards, compelling organizations to leverage third party verification and ESG assurance standards in sustainability reporting to maintain stakeholder confidence enhancement and compliance.
  • The integration of AI enabled automated tax calculation software across outsourced financial operations has accelerated digital tax monitoring, significantly increasing the requirement for specialized information systems auditing and real time data matching to prevent internal control deficiencies.

Dive into Technavio’s robust research methodology, blending expert interviews, extensive data synthesis, and validated models for unparalleled Auditing Services Market insights. See full methodology.

Market Scope
Page number 311
Base year 2025
Historic period 2020-2024
Forecast period 2026-2030
Growth momentum & CAGR Accelerate at a CAGR of 6.1%
Market growth 2026-2030 USD 128539.5 million
Market structure Fragmented
YoY growth 2025-2026(%) 5.7%
Key countries US, Canada, Mexico, Germany, UK, France, Italy, Spain, The Netherlands, China, Japan, India, South Korea, Australia, Indonesia, Brazil, Argentina, Chile, Saudi Arabia, UAE, South Africa, Israel and Turkey
Competitive landscape Leading Companies, Market Positioning of Companies, Competitive Strategies, and Industry Risks

Request Free Sample

Research Analyst Overview

  • The Auditing Services domain operates as a continuously evolving ecosystem crucial for sustaining corporate integrity and operational resilience. Boardrooms are increasingly prioritizing enterprise risk management as a foundational element of strategic product planning and capital allocation. This critical shift is primarily driven by the necessity to navigate labyrinthine regulatory reporting obligations and mitigate exposure to multifaceted operational vulnerabilities.
  • By integrating sophisticated data analytics integration and automated audit workflows, organizations have successfully achieved a 28% reduction in compliance processing time, directly translating into enhanced operational bandwidth and accelerated strategic decision-making. The implementation of rigorous internal control testing and comprehensive audit readiness assessments ensures that complex business frameworks remain fortified against emerging risks.
  • Furthermore, the deployment of advanced risk assessment methodologies allows corporate leadership to align financial transparency practices with long-term profitability objectives. As the regulatory environment becomes exponentially more intricate, the continuous refinement of forensic accounting protocols remains paramount for safeguarding organizational assets and ensuring sustained alignment with evolving governance mandates.

What are the Key Data Covered in this Auditing Services Market Research and Growth Report?

  • What is the expected growth of the Auditing Services Market between 2026 and 2030?

    • USD 128.54 billion, at a CAGR of 6.1%

  • What segmentation does the market report cover?

    • The report is segmented by Service (Assurance, Tax, and Advisory), Type (External, and Internal), End-user (BFSI, Manufacturing, Healthcare, Government, and Others) and Geography (North America, Europe, APAC, South America, Middle East and Africa)

  • Which regions are analyzed in the report?

    • North America, Europe, APAC, South America and Middle East and Africa

  • What are the key growth drivers and market challenges?

    • Increasing adoption of audit management services, High cost and maintenance of auditing services

  • Who are the major players in the Auditing Services Market?

    • Baker Tilly International, BDO International Ltd., CohnReznick LLP, Crowe LLP, Deloitte Touche Tohmatsu Ltd., Ernst and Young Global Ltd., Forvis Mazars, Grant Thornton International, HLB International Ltd., KPMG International Ltd., Kreston International Ltd, MGI Worldwide, Moore Global Network Ltd., Moss Adams LLP, Nexia International Ltd, PKF International, Plante and Moran PLC, PricewaterhouseCoopers LLP, RSM International Ltd. and Urbach Hacker Young International

Market Research Insights

  • The Auditing Services landscape is rapidly evolving to address complex regulatory demands and stringent corporate accountability standards. Organizations are actively deploying remote auditing platforms and agile audit methodologies to streamline independent verification procedures across global operations. By integrating these advanced frameworks, enterprises have achieved a 15% reduction in compliance-related penalties and a 20% improvement in resource utilization tracking.
  • Furthermore, the strategic application of robust fraud risk assessments enables businesses to optimize working capital management, leading to an 18% decrease in financial discrepancies. This continuous evolution ensures that companies can successfully navigate digital tax monitoring challenges while maintaining superior operational efficiency and financial integrity.

We can help! Our analysts can customize this auditing services market research report to meet your requirements.

Get in touch

1. Executive Summary

1.1 Market overview

Executive Summary - Chart on Market Overview
Executive Summary - Data Table on Market Overview
Executive Summary - Chart on Global Market Characteristics
Executive Summary - Chart on Market by Geography
Executive Summary - Chart on Market Segmentation by Service
Executive Summary - Chart on Market Segmentation by Type
Executive Summary - Chart on Market Segmentation by End-user
Executive Summary - Chart on Incremental Growth
Executive Summary - Data Table on Incremental Growth
Executive Summary - Chart on Company Market Positioning

2. Technavio Analysis

2.1 Analysis of price sensitivity, lifecycle, customer purchase basket, adoption rates, and purchase criteria

2.2 Criticality of inputs and Factors of differentiation

Chart on Overview on criticality of inputs and factors of differentiation

2.3 Factors of disruption

Chart on Overview on factors of disruption

2.4 Impact of drivers and challenges

Chart on Impact of drivers and challenges in 2025 and 2030

3. Market Landscape

3.1 Market ecosystem

Chart on Parent Market
Data Table on - Parent Market

3.2 Market characteristics

Chart on Market characteristics analysis

3.3 Value chain analysis

Chart on Value chain analysis

4. Market Sizing

4.1 Market definition

Data Table on Offerings of companies included in the market definition

4.2 Market segment analysis

Market segments

4.3 Market size 2025

4.4 Market outlook: Forecast for 2025-2030

Chart on Global - Market size and forecast 2025-2030 ($ million)
Data Table on Global - Market size and forecast 2025-2030 ($ million)
Chart on Global Market: Year-over-year growth 2025-2030 (%)
Data Table on Global Market: Year-over-year growth 2025-2030 (%)

5. Historic Market Size

5.1 Global Auditing Services Market 2020 - 2024

Historic Market Size - Data Table on Global Auditing Services Market 2020 - 2024 ($ million)

5.2 Service segment analysis 2020 - 2024

Historic Market Size - Service Segment 2020 - 2024 ($ million)

5.3 Type segment analysis 2020 - 2024

Historic Market Size - Type Segment 2020 - 2024 ($ million)

5.4 End-user segment analysis 2020 - 2024

Historic Market Size - End-user Segment 2020 - 2024 ($ million)

5.5 Geography segment analysis 2020 - 2024

Historic Market Size - Geography Segment 2020 - 2024 ($ million)

5.6 Country segment analysis 2020 - 2024

Historic Market Size - Country Segment 2020 - 2024 ($ million)

6. Qualitative Analysis

6.1 Impact of AI on Global Auditing Services Market

6.2 Impact of Geopolitical Conflicts on Global Auditing Services Market

7. Five Forces Analysis

7.1 Five forces summary

Five forces analysis - Comparison between 2025 and 2030

7.2 Bargaining power of buyers

Bargaining power of buyers - Impact of key factors 2025 and 2030

7.3 Bargaining power of suppliers

Bargaining power of suppliers - Impact of key factors in 2025 and 2030

7.4 Threat of new entrants

Threat of new entrants - Impact of key factors in 2025 and 2030

7.5 Threat of substitutes

Threat of substitutes - Impact of key factors in 2025 and 2030

7.6 Threat of rivalry

Threat of rivalry - Impact of key factors in 2025 and 2030

7.7 Market condition

Chart on Market condition - Five forces 2025 and 2030

8. Market Segmentation by Service

8.1 Market segments

Chart on Service - Market share 2025-2030 (%)
Data Table on Service - Market share 2025-2030 (%)

8.2 Comparison by Service

Chart on Comparison by Service
Data Table on Comparison by Service

8.3 Assurance - Market size and forecast 2025-2030

Chart on Assurance - Market size and forecast 2025-2030 ($ million)
Data Table on Assurance - Market size and forecast 2025-2030 ($ million)
Chart on Assurance - Year-over-year growth 2025-2030 (%)
Data Table on Assurance - Year-over-year growth 2025-2030 (%)

8.4 Tax - Market size and forecast 2025-2030

Chart on Tax - Market size and forecast 2025-2030 ($ million)
Data Table on Tax - Market size and forecast 2025-2030 ($ million)
Chart on Tax - Year-over-year growth 2025-2030 (%)
Data Table on Tax - Year-over-year growth 2025-2030 (%)

8.5 Advisory - Market size and forecast 2025-2030

Chart on Advisory - Market size and forecast 2025-2030 ($ million)
Data Table on Advisory - Market size and forecast 2025-2030 ($ million)
Chart on Advisory - Year-over-year growth 2025-2030 (%)
Data Table on Advisory - Year-over-year growth 2025-2030 (%)

8.6 Market opportunity by Service

Market opportunity by Service ($ million)
Data Table on Market opportunity by Service ($ million)

9. Market Segmentation by Type

9.1 Market segments

Chart on Type - Market share 2025-2030 (%)
Data Table on Type - Market share 2025-2030 (%)

9.2 Comparison by Type

Chart on Comparison by Type
Data Table on Comparison by Type

9.3 External - Market size and forecast 2025-2030

Chart on External - Market size and forecast 2025-2030 ($ million)
Data Table on External - Market size and forecast 2025-2030 ($ million)
Chart on External - Year-over-year growth 2025-2030 (%)
Data Table on External - Year-over-year growth 2025-2030 (%)

9.4 Internal - Market size and forecast 2025-2030

Chart on Internal - Market size and forecast 2025-2030 ($ million)
Data Table on Internal - Market size and forecast 2025-2030 ($ million)
Chart on Internal - Year-over-year growth 2025-2030 (%)
Data Table on Internal - Year-over-year growth 2025-2030 (%)

9.5 Market opportunity by Type

Market opportunity by Type ($ million)
Data Table on Market opportunity by Type ($ million)

10. Market Segmentation by End-user

10.1 Market segments

Chart on End-user - Market share 2025-2030 (%)
Data Table on End-user - Market share 2025-2030 (%)

10.2 Comparison by End-user

Chart on Comparison by End-user
Data Table on Comparison by End-user

10.3 BFSI - Market size and forecast 2025-2030

Chart on BFSI - Market size and forecast 2025-2030 ($ million)
Data Table on BFSI - Market size and forecast 2025-2030 ($ million)
Chart on BFSI - Year-over-year growth 2025-2030 (%)
Data Table on BFSI - Year-over-year growth 2025-2030 (%)

10.4 Manufacturing - Market size and forecast 2025-2030

Chart on Manufacturing - Market size and forecast 2025-2030 ($ million)
Data Table on Manufacturing - Market size and forecast 2025-2030 ($ million)
Chart on Manufacturing - Year-over-year growth 2025-2030 (%)
Data Table on Manufacturing - Year-over-year growth 2025-2030 (%)

10.5 Healthcare - Market size and forecast 2025-2030

Chart on Healthcare - Market size and forecast 2025-2030 ($ million)
Data Table on Healthcare - Market size and forecast 2025-2030 ($ million)
Chart on Healthcare - Year-over-year growth 2025-2030 (%)
Data Table on Healthcare - Year-over-year growth 2025-2030 (%)

10.6 Government - Market size and forecast 2025-2030

Chart on Government - Market size and forecast 2025-2030 ($ million)
Data Table on Government - Market size and forecast 2025-2030 ($ million)
Chart on Government - Year-over-year growth 2025-2030 (%)
Data Table on Government - Year-over-year growth 2025-2030 (%)

10.7 Others - Market size and forecast 2025-2030

Chart on Others - Market size and forecast 2025-2030 ($ million)
Data Table on Others - Market size and forecast 2025-2030 ($ million)
Chart on Others - Year-over-year growth 2025-2030 (%)
Data Table on Others - Year-over-year growth 2025-2030 (%)

10.8 Market opportunity by End-user

Market opportunity by End-user ($ million)
Data Table on Market opportunity by End-user ($ million)

11. Customer Landscape

11.1 Customer landscape overview

Analysis of price sensitivity, lifecycle, customer purchase basket, adoption rates, and purchase criteria

12. Geographic Landscape

12.1 Geographic segmentation

Chart on Market share by geography 2025-2030 (%)
Data Table on Market share by geography 2025-2030 (%)

12.2 Geographic comparison

Chart on Geographic comparison
Data Table on Geographic comparison

12.3 North America - Market size and forecast 2025-2030

Chart on North America - Market size and forecast 2025-2030 ($ million)
Data Table on North America - Market size and forecast 2025-2030 ($ million)
Chart on North America - Year-over-year growth 2025-2030 (%)
Data Table on North America - Year-over-year growth 2025-2030 (%)
Chart on Regional Comparison - North America
Data Table on Regional Comparison - North America

12.3.1 US - Market size and forecast 2025-2030

Chart on US - Market size and forecast 2025-2030 ($ million)
Data Table on US - Market size and forecast 2025-2030 ($ million)
Chart on US - Year-over-year growth 2025-2030 (%)
Data Table on US - Year-over-year growth 2025-2030 (%)

12.3.2 Canada - Market size and forecast 2025-2030

Chart on Canada - Market size and forecast 2025-2030 ($ million)
Data Table on Canada - Market size and forecast 2025-2030 ($ million)
Chart on Canada - Year-over-year growth 2025-2030 (%)
Data Table on Canada - Year-over-year growth 2025-2030 (%)

12.3.3 Mexico - Market size and forecast 2025-2030

Chart on Mexico - Market size and forecast 2025-2030 ($ million)
Data Table on Mexico - Market size and forecast 2025-2030 ($ million)
Chart on Mexico - Year-over-year growth 2025-2030 (%)
Data Table on Mexico - Year-over-year growth 2025-2030 (%)

12.4 Europe - Market size and forecast 2025-2030

Chart on Europe - Market size and forecast 2025-2030 ($ million)
Data Table on Europe - Market size and forecast 2025-2030 ($ million)
Chart on Europe - Year-over-year growth 2025-2030 (%)
Data Table on Europe - Year-over-year growth 2025-2030 (%)
Chart on Regional Comparison - Europe
Data Table on Regional Comparison - Europe

12.4.1 Germany - Market size and forecast 2025-2030

Chart on Germany - Market size and forecast 2025-2030 ($ million)
Data Table on Germany - Market size and forecast 2025-2030 ($ million)
Chart on Germany - Year-over-year growth 2025-2030 (%)
Data Table on Germany - Year-over-year growth 2025-2030 (%)

12.4.2 UK - Market size and forecast 2025-2030

Chart on UK - Market size and forecast 2025-2030 ($ million)
Data Table on UK - Market size and forecast 2025-2030 ($ million)
Chart on UK - Year-over-year growth 2025-2030 (%)
Data Table on UK - Year-over-year growth 2025-2030 (%)

12.4.3 France - Market size and forecast 2025-2030

Chart on France - Market size and forecast 2025-2030 ($ million)
Data Table on France - Market size and forecast 2025-2030 ($ million)
Chart on France - Year-over-year growth 2025-2030 (%)
Data Table on France - Year-over-year growth 2025-2030 (%)

12.4.4 Italy - Market size and forecast 2025-2030

Chart on Italy - Market size and forecast 2025-2030 ($ million)
Data Table on Italy - Market size and forecast 2025-2030 ($ million)
Chart on Italy - Year-over-year growth 2025-2030 (%)
Data Table on Italy - Year-over-year growth 2025-2030 (%)

12.4.5 Spain - Market size and forecast 2025-2030

Chart on Spain - Market size and forecast 2025-2030 ($ million)
Data Table on Spain - Market size and forecast 2025-2030 ($ million)
Chart on Spain - Year-over-year growth 2025-2030 (%)
Data Table on Spain - Year-over-year growth 2025-2030 (%)

12.4.6 The Netherlands - Market size and forecast 2025-2030

Chart on The Netherlands - Market size and forecast 2025-2030 ($ million)
Data Table on The Netherlands - Market size and forecast 2025-2030 ($ million)
Chart on The Netherlands - Year-over-year growth 2025-2030 (%)
Data Table on The Netherlands - Year-over-year growth 2025-2030 (%)

12.5 APAC - Market size and forecast 2025-2030

Chart on APAC - Market size and forecast 2025-2030 ($ million)
Data Table on APAC - Market size and forecast 2025-2030 ($ million)
Chart on APAC - Year-over-year growth 2025-2030 (%)
Data Table on APAC - Year-over-year growth 2025-2030 (%)
Chart on Regional Comparison - APAC
Data Table on Regional Comparison - APAC

12.5.1 China - Market size and forecast 2025-2030

Chart on China - Market size and forecast 2025-2030 ($ million)
Data Table on China - Market size and forecast 2025-2030 ($ million)
Chart on China - Year-over-year growth 2025-2030 (%)
Data Table on China - Year-over-year growth 2025-2030 (%)

12.5.2 Japan - Market size and forecast 2025-2030

Chart on Japan - Market size and forecast 2025-2030 ($ million)
Data Table on Japan - Market size and forecast 2025-2030 ($ million)
Chart on Japan - Year-over-year growth 2025-2030 (%)
Data Table on Japan - Year-over-year growth 2025-2030 (%)

12.5.3 India - Market size and forecast 2025-2030

Chart on India - Market size and forecast 2025-2030 ($ million)
Data Table on India - Market size and forecast 2025-2030 ($ million)
Chart on India - Year-over-year growth 2025-2030 (%)
Data Table on India - Year-over-year growth 2025-2030 (%)

12.5.4 South Korea - Market size and forecast 2025-2030

Chart on South Korea - Market size and forecast 2025-2030 ($ million)
Data Table on South Korea - Market size and forecast 2025-2030 ($ million)
Chart on South Korea - Year-over-year growth 2025-2030 (%)
Data Table on South Korea - Year-over-year growth 2025-2030 (%)

12.5.5 Australia - Market size and forecast 2025-2030

Chart on Australia - Market size and forecast 2025-2030 ($ million)
Data Table on Australia - Market size and forecast 2025-2030 ($ million)
Chart on Australia - Year-over-year growth 2025-2030 (%)
Data Table on Australia - Year-over-year growth 2025-2030 (%)

12.5.6 Indonesia - Market size and forecast 2025-2030

Chart on Indonesia - Market size and forecast 2025-2030 ($ million)
Data Table on Indonesia - Market size and forecast 2025-2030 ($ million)
Chart on Indonesia - Year-over-year growth 2025-2030 (%)
Data Table on Indonesia - Year-over-year growth 2025-2030 (%)

12.6 South America - Market size and forecast 2025-2030

Chart on South America - Market size and forecast 2025-2030 ($ million)
Data Table on South America - Market size and forecast 2025-2030 ($ million)
Chart on South America - Year-over-year growth 2025-2030 (%)
Data Table on South America - Year-over-year growth 2025-2030 (%)
Chart on Regional Comparison - South America
Data Table on Regional Comparison - South America

12.6.1 Brazil - Market size and forecast 2025-2030

Chart on Brazil - Market size and forecast 2025-2030 ($ million)
Data Table on Brazil - Market size and forecast 2025-2030 ($ million)
Chart on Brazil - Year-over-year growth 2025-2030 (%)
Data Table on Brazil - Year-over-year growth 2025-2030 (%)

12.6.2 Argentina - Market size and forecast 2025-2030

Chart on Argentina - Market size and forecast 2025-2030 ($ million)
Data Table on Argentina - Market size and forecast 2025-2030 ($ million)
Chart on Argentina - Year-over-year growth 2025-2030 (%)
Data Table on Argentina - Year-over-year growth 2025-2030 (%)

12.6.3 Chile - Market size and forecast 2025-2030

Chart on Chile - Market size and forecast 2025-2030 ($ million)
Data Table on Chile - Market size and forecast 2025-2030 ($ million)
Chart on Chile - Year-over-year growth 2025-2030 (%)
Data Table on Chile - Year-over-year growth 2025-2030 (%)

12.7 Middle East and Africa - Market size and forecast 2025-2030

Chart on Middle East and Africa - Market size and forecast 2025-2030 ($ million)
Data Table on Middle East and Africa - Market size and forecast 2025-2030 ($ million)
Chart on Middle East and Africa - Year-over-year growth 2025-2030 (%)
Data Table on Middle East and Africa - Year-over-year growth 2025-2030 (%)
Chart on Regional Comparison - Middle East and Africa
Data Table on Regional Comparison - Middle East and Africa

12.7.1 Saudi Arabia - Market size and forecast 2025-2030

Chart on Saudi Arabia - Market size and forecast 2025-2030 ($ million)
Data Table on Saudi Arabia - Market size and forecast 2025-2030 ($ million)
Chart on Saudi Arabia - Year-over-year growth 2025-2030 (%)
Data Table on Saudi Arabia - Year-over-year growth 2025-2030 (%)

12.7.2 UAE - Market size and forecast 2025-2030

Chart on UAE - Market size and forecast 2025-2030 ($ million)
Data Table on UAE - Market size and forecast 2025-2030 ($ million)
Chart on UAE - Year-over-year growth 2025-2030 (%)
Data Table on UAE - Year-over-year growth 2025-2030 (%)

12.7.3 South Africa - Market size and forecast 2025-2030

Chart on South Africa - Market size and forecast 2025-2030 ($ million)
Data Table on South Africa - Market size and forecast 2025-2030 ($ million)
Chart on South Africa - Year-over-year growth 2025-2030 (%)
Data Table on South Africa - Year-over-year growth 2025-2030 (%)

12.7.4 Israel - Market size and forecast 2025-2030

Chart on Israel - Market size and forecast 2025-2030 ($ million)
Data Table on Israel - Market size and forecast 2025-2030 ($ million)
Chart on Israel - Year-over-year growth 2025-2030 (%)
Data Table on Israel - Year-over-year growth 2025-2030 (%)

12.7.5 Turkey - Market size and forecast 2025-2030

Chart on Turkey - Market size and forecast 2025-2030 ($ million)
Data Table on Turkey - Market size and forecast 2025-2030 ($ million)
Chart on Turkey - Year-over-year growth 2025-2030 (%)
Data Table on Turkey - Year-over-year growth 2025-2030 (%)

12.8 Market opportunity by geography

Market opportunity by geography ($ million)
Data Tables on Market opportunity by geography ($ million)

13. Drivers, Challenges, and Opportunity

13.1 Market drivers

Increasing adoption of audit management services
Demand for efficient business processes
Increasing number of federal tax authorities

13.2 Market challenges

High cost and maintenance of auditing services
Unsuitable for small businesses
Concerns over cybersecurity breaches

13.3 Impact of drivers and challenges

Impact of drivers and challenges in 2025 and 2030

13.4 Market opportunities

Need of organizations to comply with auditing regulations
Rise in growth of financing of small and medium businesses
Proper management of inventory systems and working capital

14. Competitive Landscape

14.1 Overview

14.2

Overview on criticality of inputs and factors of differentiation

14.3 Landscape disruption

Overview on factors of disruption

14.4 Industry risks

Impact of key risks on business

15. Competitive Analysis

15.1 Companies profiled

Companies covered

15.2 Company ranking index

15.3 Market positioning of companies

Matrix on companies position and classification

15.4 Baker Tilly International

Baker Tilly International - Overview
Baker Tilly International - Product / Service
Baker Tilly International - Key offerings
SWOT

15.5 BDO International Ltd.

BDO International Ltd. - Overview
BDO International Ltd. - Product / Service
BDO International Ltd. - Key offerings
SWOT

15.6 Crowe LLP

Crowe LLP - Overview
Crowe LLP - Product / Service
Crowe LLP - Key offerings
SWOT

15.7 Deloitte Touche Tohmatsu Ltd.

Deloitte Touche Tohmatsu Ltd. - Overview
Deloitte Touche Tohmatsu Ltd. - Business segments
Deloitte Touche Tohmatsu Ltd. - Key offerings
Deloitte Touche Tohmatsu Ltd. - Segment focus
SWOT

15.8 Ernst and Young Global Ltd.

Ernst and Young Global Ltd. - Overview
Ernst and Young Global Ltd. - Product / Service
Ernst and Young Global Ltd. - Key offerings
SWOT

15.9 Forvis Mazars

Forvis Mazars - Overview
Forvis Mazars - Product / Service
Forvis Mazars - Key offerings
SWOT

15.10 Grant Thornton International

Grant Thornton International - Overview
Grant Thornton International - Product / Service
Grant Thornton International - Key offerings
SWOT

15.11 KPMG International Ltd.

KPMG International Ltd. - Overview
KPMG International Ltd. - Product / Service
KPMG International Ltd. - Key offerings
SWOT

15.12 MGI Worldwide

MGI Worldwide - Overview
MGI Worldwide - Product / Service
MGI Worldwide - Key offerings
SWOT

15.13 Moore Global Network Ltd.

Moore Global Network Ltd. - Overview
Moore Global Network Ltd. - Product / Service
Moore Global Network Ltd. - Key offerings
SWOT

15.14 PKF International

PKF International - Overview
PKF International - Product / Service
PKF International - Key offerings
SWOT

15.15 Plante and Moran PLC

Plante and Moran PLC - Overview
Plante and Moran PLC - Product / Service
Plante and Moran PLC - Key offerings
SWOT

15.16 PricewaterhouseCoopers LLP

PricewaterhouseCoopers LLP - Overview
PricewaterhouseCoopers LLP - Product / Service
PricewaterhouseCoopers LLP - Key offerings
SWOT

15.17 RSM International Ltd.

RSM International Ltd. - Overview
RSM International Ltd. - Product / Service
RSM International Ltd. - Key offerings
SWOT

15.18 Urbach Hacker Young International

Urbach Hacker Young International - Overview
Urbach Hacker Young International - Product / Service
Urbach Hacker Young International - Key offerings
SWOT

16. Appendix

16.1 Scope of the report

Market definition
Objectives
Notes and caveats

16.2 Inclusions and exclusions checklist

Inclusions checklist
Exclusions checklist

16.3 Currency conversion rates for US$

16.4 Research methodology

16.5 Data procurement

Information sources

16.6 Data validation

16.7 Validation techniques employed for market sizing

16.8 Data synthesis

16.9 360 degree market analysis

16.10 List of abbreviations

Research Methodology

Technavio presents a detailed picture of the market by way of study, synthesis, and summation of data from multiple sources. The analysts have presented the various facets of the market with a particular focus on identifying the key industry influencers. The data thus presented is comprehensive, reliable, and the result of extensive research, both primary and secondary.

INFORMATION SOURCES

Primary sources

  • Manufacturers and suppliers
  • Channel partners
  • Industry experts
  • Strategic decision makers

Secondary sources

  • Industry journals and periodicals
  • Government data
  • Financial reports of key industry players
  • Historical data
  • Press releases

DATA ANALYSIS

Data Synthesis

  • Collation of data
  • Estimation of key figures
  • Analysis of derived insights

Data Validation

  • Triangulation with data models
  • Reference against proprietary databases
  • Corroboration with industry experts

REPORT WRITING

Qualitative

  • Market drivers
  • Market challenges
  • Market trends
  • Five forces analysis

Quantitative

  • Market size and forecast
  • Market segmentation
  • Geographical insights
  • Competitive landscape

Interested in this report?

Get your sample now to see our research methodology and insights!

Download Now

Frequently Asked Questions

Auditing Services market growth will increase by USD 128539.5 million during 2026-2030.

The Auditing Services market is expected to grow at a CAGR of 6.1% during 2026-2030.

Auditing Services market is segmented by Service (Assurance, Tax, Advisory) Type (External, Internal) End-user (BFSI, Manufacturing, Healthcare, Government, Others)

Baker Tilly International, BDO International Ltd., CohnReznick LLP, Crowe LLP, Deloitte Touche Tohmatsu Ltd., Ernst and Young Global Ltd., Forvis Mazars, Grant Thornton International, HLB International Ltd., KPMG International Ltd., Kreston International Ltd, MGI Worldwide, Moore Global Network Ltd., Moss Adams LLP, Nexia International Ltd, PKF International, Plante and Moran PLC, PricewaterhouseCoopers LLP, RSM International Ltd., Urbach Hacker Young International are a few of the key vendors in the Auditing Services market.

North America will register the highest growth rate of 38.3% among the other regions. Therefore, the Auditing Services market in North America is expected to garner significant business opportunities for the vendors during the forecast period.

US, Canada, Mexico, Germany, UK, France, Italy, Spain, The Netherlands, China, Japan, India, South Korea, Australia, Indonesia, Brazil, Argentina, Chile, Saudi Arabia, UAE, South Africa, Israel, Turkey

  • Increasing adoption of audit management services is the driving factor this market.

The Auditing Services market vendors should focus on grabbing business opportunities from the Service segment as it accounted for the largest market share in the base year.
RIA - Research AI Assistant
Ask RIA
