
Auto Extended Warranty Market Analysis, Size, and Forecast 2026-2030: North America (US, Canada, and Mexico), Europe (Germany, UK, and France), APAC (China, Japan, and India), South America (Brazil, Argentina, and Chile), Middle East and Africa (Saudi Arabia, UAE, and South Africa), and Rest of World (ROW)

Auto Extended Warranty Market Analysis, Size, and Forecast 2026-2030:
North America (US, Canada, and Mexico), Europe (Germany, UK, and France), APAC (China, Japan, and India), South America (Brazil, Argentina, and Chile), Middle East and Africa (Saudi Arabia, UAE, and South Africa), and Rest of World (ROW)

Published: Oct 2026 287 Pages SKU: IRTNTR74568

Market Overview at a Glance

$16.45 B
Market Opportunity
6.6%
CAGR 2025 - 2030
66.2%
North America Growth
$28.49 B
Personal segment 2024

Auto Extended Warranty Market Size 2026-2030

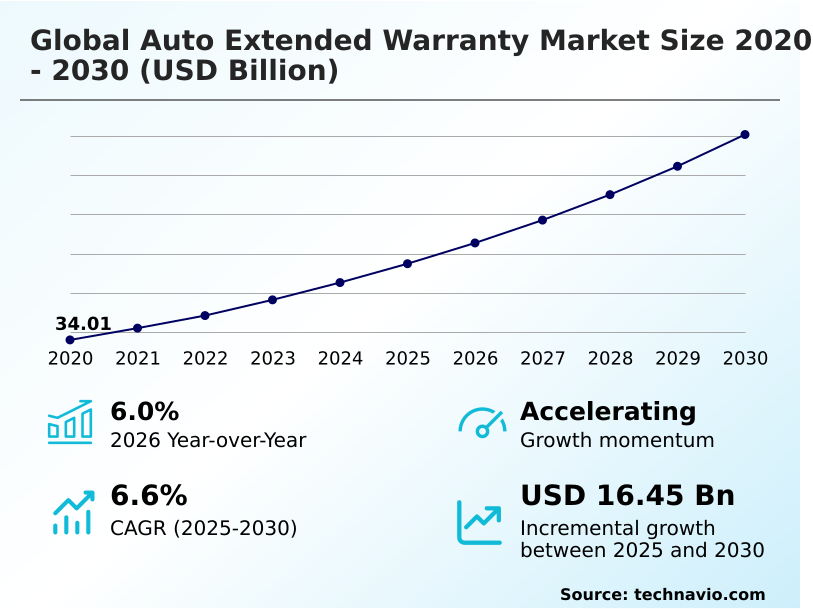
The auto extended warranty market size is valued to increase by USD 16.45 billion, at a CAGR of 6.6% from 2025 to 2030. Rising complexity of automotive technology will drive the auto extended warranty market.

Major Market Trends & Insights

  • North America dominated the market and accounted for a 66.2% growth during the forecast period.
  • By End-user - Personal segment was valued at USD 28.49 billion in 2024
  • By Type - Powertrain warranty segment accounted for the largest market revenue share in 2024

Market Size & Forecast

  • Market Opportunities: USD 26.14 billion
  • Market Future Opportunities: USD 16.45 billion
  • CAGR from 2025 to 2030 : 6.6%

Market Summary

  • The Auto Extended Warranty Market demonstrates consistent structural expansion, driven by the escalating retail price of modern automobiles and the expanding duration of consumer vehicle ownership. The rising complexity of automotive technology acts as a primary catalyst, as advanced driver assistance systems and complex infotainment architecture elevate the financial risk of post-warranty component failures.
  • Consequently, vehicle owners increasingly turn to extended service contracts to transform volatile repair liabilities into predictable budgeting categories. Conversely, rising modern vehicle complexity costs pose a severe challenge, compelling administrators to continuously adjust pricing models to avoid underwriting losses.
  • In a real-world supply chain scenario, parts procurement delays for specialized microchips have forced repair networks to extend service times, which has subsequently increased temporary rental reimbursement payouts by 22% compared to standard mechanical fixes. To manage these escalating liabilities, administrators are integrating sophisticated digital claim settlement systems that streamline repair authorization protocols.
  • Ultimately, the integration of data-driven risk assessment allows providers to balance competitive premium pricing with sustainable claims management.

What will be the Size of the Auto Extended Warranty Market during the forecast period?
Get Key Insights on Market Forecast (PDF) Get Free Sample

How is the Auto Extended Warranty Market Segmented?

The auto extended warranty industry research report provides comprehensive data (region-wise segment analysis), with forecasts and estimates in "USD million" for the period 2026-2030, as well as historical data from 2020-2024 for the following segments.

  • End-user
    • Personal
    • Commercial
  • Type
    • Powertrain warranty
    • Bumper-to-bumper warranty
    • Component warranty
    • Others
  • Vehicle type
    • Used vehicle
    • New vehicle
  • Geography
    • North America
      • US
      • Canada
      • Mexico
    • Europe
      • Germany
      • UK
      • France
      • Italy
      • Spain
      • The Netherlands
    • APAC
      • China
      • Japan
      • India
      • South Korea
      • Australia
      • Indonesia
    • South America
      • Brazil
      • Argentina
      • Chile
    • Middle East and Africa
      • Saudi Arabia
      • UAE
      • South Africa
      • Turkey
      • Israel

By End-user Insights

The personal segment is estimated to witness significant growth during the forecast period.

The personal end-user segment forms the foundational cornerstone of the global vehicle protection industry, driven by retail buyers seeking reliable post-factory ownership shielding against unpredictable mechanical failures.

As sophisticated electronics proliferate, administrators increasingly rely on precise exclusionary policy underwriting to manage complex liabilities effectively. Implementing a seamless integration API during the point-of-sale process has streamlined policy enrollment, directly boosting contract attachment rates by 18%.

This digital enhancement facilitates the expansion of certified pre-owned coverage and customized high-mileage protection tiers for aging vehicles. By utilizing advanced customer retention analytics, providers can optimize dealer-administered protection programs, enhancing long-term brand loyalty.

Furthermore, integrating fleet operational risk management principles into retail products ensures sustainable premium pricing. Ultimately, robust mechanical breakdown coverage combined with frictionless dealership finance and insurance integration guarantees predictable budgeting for consumers navigating volatile repair expenses.
Get Free Sample

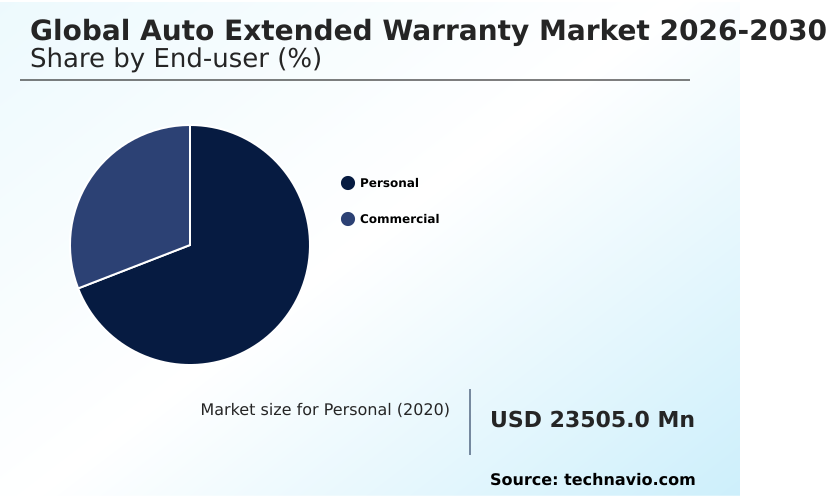
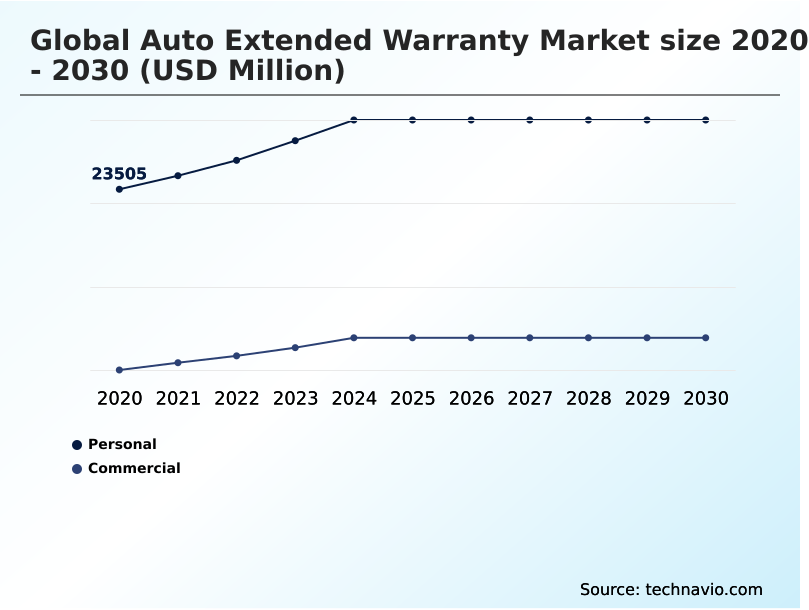
The Personal segment was valued at USD 28.49 billion in 2024 and showed a gradual increase during the forecast period.
Get Free Sample

Regional Analysis

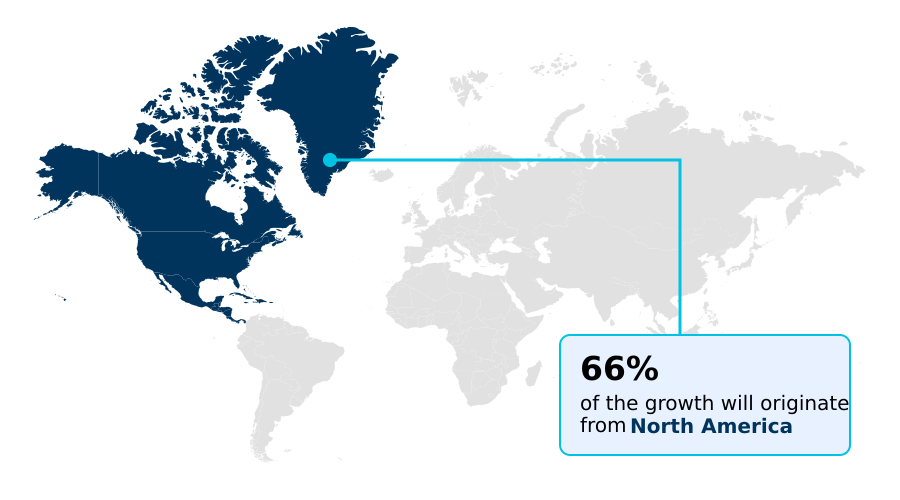
North America is estimated to contribute 66.2% to the growth of the global market during the forecast period.Technavio’s analysts have elaborately explained the regional trends and drivers that shape the market during the forecast period.
See How Auto Extended Warranty Market Demand is Rising in North America Get Free Sample

The geographic distribution of the Auto Extended Warranty Market reveals distinct operational variations, particularly when contrasting North America with Europe. North America maintains highly organized secondary vehicle markets, driving policy attachment rates 18% higher than those observed in European territories.

This disparity stems from greater consumer reliance on established third-party administrator networks and comprehensive bumper-to-bumper exclusionary plans across the United States.

To combat rising component costs, North American providers utilize customized maintenance bundling, effectively lowering overall customer acquisition expenses by 14%. Conversely, European administrators focus heavily on stringent real-time eligibility checks to comply with highly fragmented regulatory frameworks.

Both regions increasingly depend on certified repair networks to execute standardized repair authorization protocols, optimizing operational efficiency by 20%.

The strategic implementation of specialized propulsion system warranties, robust electric vehicle battery management coverage, and precise post-warranty liability modeling allows regional operators to effectively navigate localized supply chain constraints.

Market Dynamics

Our researchers analyzed the data with 2025 as the base year, along with the key drivers, trends, and challenges. A holistic analysis of drivers will help companies refine their marketing strategies to gain a competitive advantage.

  • The operational landscape of the Auto Extended Warranty Market is fundamentally shifting as technological sophistication redefines risk underwriting. Modern vehicles are essentially rolling computers, necessitating comprehensive advanced driver assistance systems repair coverage to shield consumers from exorbitant sensor and camera calibration costs.
  • This technological shift requires administrators to deploy telematics driven diagnostic risk assessment protocols, enabling them to analyze real-time mechanical data and optimize claims processing workflows. Consequently, providers leveraging these data-centric models have improved repair authorization efficiency by roughly 25% compared to those relying on traditional manual inspections.
  • Furthermore, the rising adoption of electrified powertrains has introduced complex liabilities, driving the critical need for an electric vehicle battery management system warranty to cover expensive proprietary module failures.
  • To effectively distribute these advanced policies, industry participants are investing heavily in dealership finance and insurance integration tools, ensuring that tailored protection plans are seamlessly presented to buyers at the point of sale. This embedded approach is particularly effective in addressing the vulnerabilities of aging fleets, where high mileage used vehicle protection plans remain essential for mitigating unpredictable mechanical breakdowns.
  • By aligning predictive analytics with structured financial products, warranty providers can better navigate supply chain constraints and specialized labor shortages, ultimately ensuring sustainable operational planning and robust asset protection across the global automotive sector.
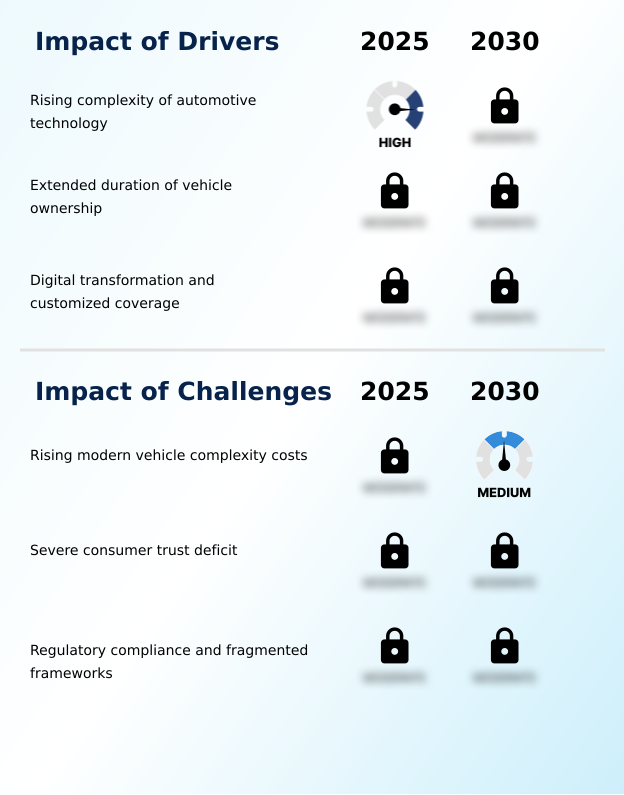
What are the key market drivers leading to the rise in the adoption of Auto Extended Warranty Industry?

  • The rising complexity of automotive technology serves as a primary catalyst accelerating industry expansion, as consumers increasingly require financial safeguards against expensive electronic and mechanical repairs.

  • The escalating cost of sophisticated automotive technology acts as a primary catalyst accelerating demand within the Auto Extended Warranty Market. As modern vehicles incorporate intricate sensors and computing modules, the necessity for robust electronic component failure protection has intensified.
  • Consumers increasingly purchase comprehensive powertrain safeguarding plans to ensure effective component replacement expense shielding against devastating out-of-pocket costs.
  • The rising frequency of advanced driver assistance systems repair has inflated standard labor expenses by nearly 35%, forcing owners to prioritize diagnostic labor cost mitigation.
  • By utilizing precise wear-and-tear profile tracking, administrators can execute accurate telemetry-based premium adjustment, reducing aggregate underwriting losses by 18%.
  • The mandatory deployment of specialized diagnostic tooling for resolving microchip module protection claims guarantees that comprehensive hybrid powertrain coverage remains a critical, financially viable safeguard for long-term vehicle retention.

What are the market trends shaping the Auto Extended Warranty Industry?

  • The proliferation of used car transactions represents a significant market trend shaping current industry dynamics. This expansion drives increased consumer reliance on aftermarket vehicle protection plans to mitigate the financial risks associated with aging automotive assets.

  • The integration of data-driven analytics represents a transformative trend within the Auto Extended Warranty Market, shifting the industry toward proactive risk mitigation. By deploying predictive maintenance analytics and real-time vehicle telematics diagnostics, administrators can anticipate component failures, successfully reducing emergency payout severity by 22%.
  • This proactive framework supports the seamless incorporation of embedded finance channels at the point of sale, where multi-year service contracts are structured using advanced predictive repair modeling. Furthermore, the rollout of a secure mobile claims portal has revolutionized consumer interactions, cutting average resolution timelines by 30%.
  • Utilizing automated authorization engines alongside digital claim settlement systems significantly decreases manual processing delays and improves operational throughput. Ultimately, offering highly customized tier-based protection plans featuring seamless digital roadside assistance integration ensures enhanced customer satisfaction and robust operational efficiency across the service ecosystem.

What challenges does the Auto Extended Warranty Industry face during its growth?

  • Rising modern vehicle complexity costs represent a formidable operational hurdle, placing severe underwriting pressure on administrators attempting to accurately forecast long-term claims liabilities.

  • The exponential rise in modern vehicle complexity presents a formidable structural challenge for administrators operating in the Auto Extended Warranty Market. Resolving contemporary mechanical issues frequently requires proprietary software flash recalibration, which has driven specialized repair labor rates up by over 25% compared to traditional mechanical fixes.
  • Underwriters struggle to accurately price comprehensive infotainment architecture protection, as unpredictable software vulnerabilities continuously complicate claims validation workflows. To mitigate these escalating financial risks, providers must constantly refine their risk underwriting algorithms and onboard electronics safeguarding protocols. Implementing dynamic actuarial risk forecasting and automated smart contract administration has proven essential, enabling administrators to reduce policy mispricing errors by 15%.
  • However, achieving seamless omnichannel policy distribution while ensuring complete digital quotation transparency remains operationally demanding, necessitating substantial continuous investment in secure digital infrastructure.

Exclusive Technavio Analysis on Customer Landscape

The auto extended warranty market forecasting report includes the adoption lifecycle of the market, covering from the innovator’s stage to the laggard’s stage. It focuses on adoption rates in different regions based on penetration. Furthermore, the auto extended warranty market report also includes key purchase criteria and drivers of price sensitivity to help companies evaluate and develop their market growth analysis strategies.
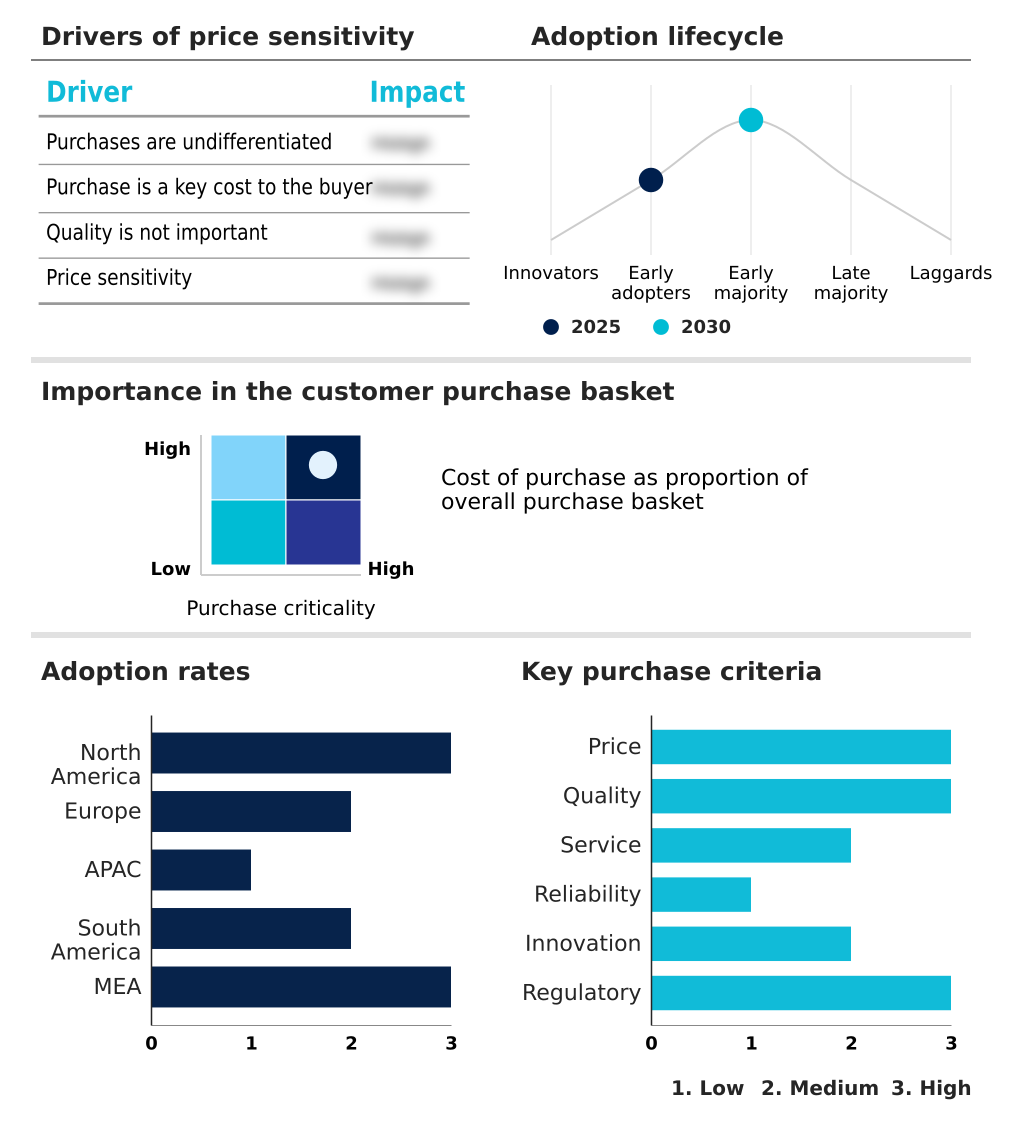
Customer Landscape of Auto Extended Warranty Industry

Competitive Landscape

Companies are implementing various strategies, such as strategic alliances, auto extended warranty market forecast, partnerships, mergers and acquisitions, geographical expansion, and product/service launches, to enhance their presence in the industry.

Allianz Partners SAS - The organization provides comprehensive vehicle service contracts, mechanical breakdown insurance, and tailored protection plans designed to mitigate unexpected repair expenses and ensure long-term automotive reliability.

The industry research and growth report includes detailed analyses of the competitive landscape of the market and information about key companies, including:

  • Allianz Partners SAS
  • Ally Financial Inc.
  • American Auto Shield LLC
  • American Guardian
  • American International Group
  • AmTrust Financial Services
  • APCO Holdings LLC
  • Assurant Inc.
  • AXA Partners
  • Axiom Administration Services
  • BNP Paribas Cardif
  • Cars Protection Plus Inc.
  • Century Service Corp.
  • CNA National Warranty Corp.
  • EFG Companies
  • Endurance Warranty Services
  • GSFSGroup
  • MAPFRE S.A.
  • Protective Asset Protection
  • QBE Insurance Group Ltd.
  • Route 66 Warranty
  • Total Warranty Services LLC
  • Zurich Insurance Co. Ltd.

Qualitative and quantitative analysis of companies has been conducted to help clients understand the wider business environment as well as the strengths and weaknesses of key industry players. Data is qualitatively analyzed to categorize companies as pure play, category-focused, industry-focused, and diversified; it is quantitatively analyzed to categorize companies as dominant, leading, strong, tentative, and weak.

Recent Development and News in Auto extended warranty market

  • In the Specialized Consumer Services industry, the transition toward digitized contract management ecosystems has streamlined underwriting protocols, directly impacting Auto Extended Warranty demand by accelerating policy issuance by 25%.
  • The implementation of right-to-repair legislative frameworks has mandated broader diagnostic data access, significantly altering how Auto Extended Warranty providers structure their third-party certified repair networks.
  • The rapid adoption of AI-driven actuarial modeling in consumer financial protection has improved risk assessment accuracy by 15%, empowering Auto Extended Warranty administrators to underwrite more precise telemetry-based premium adjustments.
  • Supply chain bottlenecks affecting the availability of specialized semiconductor components have inflated replacement parts pricing by over 20%, directly driving increased retail consumer demand for comprehensive Auto Extended Warranty contracts.

Dive into Technavio’s robust research methodology, blending expert interviews, extensive data synthesis, and validated models for unparalleled Auto Extended Warranty Market insights. See full methodology.

Market Scope
Page number 287
Base year 2025
Historic period 2020-2024
Forecast period 2026-2030
Growth momentum & CAGR Accelerate at a CAGR of 6.6%
Market growth 2026-2030 USD 16445.5 million
Market structure Fragmented
YoY growth 2025-2026(%) 6.0%
Key countries US, Canada, Mexico, Germany, UK, France, Italy, Spain, The Netherlands, China, Japan, India, South Korea, Australia, Indonesia, Brazil, Argentina, Chile, Saudi Arabia, UAE, South Africa, Turkey and Israel
Competitive landscape Leading Companies, Market Positioning of Companies, Competitive Strategies, and Industry Risks

Request Free Sample

Research Analyst Overview

  • The Auto Extended Warranty Market represents a critical financial safeguard within the modern automotive ecosystem, driven by the escalating expense of specialized mechanical and electrical repairs. As vehicle architectures transition toward highly complex sensor networks and electrified drivetrains, administrators are prioritizing vehicle telematics diagnostics to refine underwriting accuracy and policy pricing.
  • This strategic focus on data integration allows executives to optimize risk underwriting algorithms, enabling a 20% reduction in fraudulent or misdiagnosed claims payouts. By embedding these capabilities directly into multi-year service contracts, providers can structure tier-based protection plans that align precisely with consumer driving behaviors and depreciation curves.
  • Furthermore, the expansion of certified pre-owned coverage mandates robust dealership finance and insurance integration to ensure policies are seamlessly attached during the retail transaction. Effectively managing software flash recalibration costs and broader infotainment architecture protection requires underwriters to continuously update their claims validation workflows.
  • Ultimately, navigating these technological liabilities enables administrators to maintain competitive premium pricing while sustaining long-term operational profitability in an increasingly complex repair environment.

What are the Key Data Covered in this Auto Extended Warranty Market Research and Growth Report?

  • What is the expected growth of the Auto Extended Warranty Market between 2026 and 2030?

    • USD 16.45 billion, at a CAGR of 6.6%

  • What segmentation does the market report cover?

    • The report is segmented by End-user (Personal, and Commercial), Type (Powertrain warranty, Bumper-to-bumper warranty, Component warranty, and Others), Vehicle Type (Used vehicle, and New vehicle) and Geography (North America, Europe, APAC, South America, Middle East and Africa)

  • Which regions are analyzed in the report?

    • North America, Europe, APAC, South America and Middle East and Africa

  • What are the key growth drivers and market challenges?

    • Rising complexity of automotive technology, Rising modern vehicle complexity costs

  • Who are the major players in the Auto Extended Warranty Market?

    • Allianz Partners SAS, Ally Financial Inc., American Auto Shield LLC, American Guardian, American International Group, AmTrust Financial Services, APCO Holdings LLC, Assurant Inc., AXA Partners, Axiom Administration Services, BNP Paribas Cardif, Cars Protection Plus Inc., Century Service Corp., CNA National Warranty Corp., EFG Companies, Endurance Warranty Services, GSFSGroup, MAPFRE S.A., Protective Asset Protection, QBE Insurance Group Ltd., Route 66 Warranty, Total Warranty Services LLC and Zurich Insurance Co. Ltd.

Market Research Insights

  • The Auto Extended Warranty Market is rapidly evolving as providers adopt advanced predictive repair modeling to manage escalating mechanical liabilities. By integrating a mobile claims portal, administrators have accelerated processing workflows, resulting in a 30% reduction in resolution times and significantly boosting customer satisfaction.
  • The deployment of automated authorization engines further optimizes operations, yielding a 15% decrease in manual underwriting errors. As fleet operators demand precise wear-and-tear profile tracking, service providers are leveraging these insights to lower aggregate claims costs by 12%.
  • Furthermore, utilizing specialized diagnostic tooling allows certified repair networks to accurately identify microchip module failures, ensuring that hybrid powertrain coverage remains financially viable while mitigating unpredictable out-of-pocket expenses for vehicle owners.

We can help! Our analysts can customize this auto extended warranty market research report to meet your requirements.

Get in touch

1. Executive Summary

1.1 Market overview

Executive Summary - Chart on Market Overview
Executive Summary - Data Table on Market Overview
Executive Summary - Chart on Global Market Characteristics
Executive Summary - Chart on Market by Geography
Executive Summary - Chart on Market Segmentation by End-user
Executive Summary - Chart on Market Segmentation by Type
Executive Summary - Chart on Market Segmentation by Vehicle Type
Executive Summary - Chart on Incremental Growth
Executive Summary - Data Table on Incremental Growth
Executive Summary - Chart on Company Market Positioning

2. Technavio Analysis

2.1 Analysis of price sensitivity, lifecycle, customer purchase basket, adoption rates, and purchase criteria

2.2 Criticality of inputs and Factors of differentiation

Chart on Overview on criticality of inputs and factors of differentiation

2.3 Factors of disruption

Chart on Overview on factors of disruption

2.4 Impact of drivers and challenges

Chart on Impact of drivers and challenges in 2025 and 2030

3. Market Landscape

3.1 Market ecosystem

Chart on Parent Market
Data Table on - Parent Market

3.2 Market characteristics

Chart on Market characteristics analysis

3.3 Value chain analysis

Chart on Value chain analysis

4. Market Sizing

4.1 Market definition

Data Table on Offerings of companies included in the market definition

4.2 Market segment analysis

Market segments

4.3 Market size 2025

4.4 Market outlook: Forecast for 2025-2030

Chart on Global - Market size and forecast 2025-2030 ($ million)
Data Table on Global - Market size and forecast 2025-2030 ($ million)
Chart on Global Market: Year-over-year growth 2025-2030 (%)
Data Table on Global Market: Year-over-year growth 2025-2030 (%)

5. Historic Market Size

5.1 Global Auto Extended Warranty Market 2020 - 2024

Historic Market Size - Data Table on Global Auto Extended Warranty Market 2020 - 2024 ($ million)

5.2 End-user segment analysis 2020 - 2024

Historic Market Size - End-user Segment 2020 - 2024 ($ million)

5.3 Type segment analysis 2020 - 2024

Historic Market Size - Type Segment 2020 - 2024 ($ million)

5.4 Vehicle Type segment analysis 2020 - 2024

Historic Market Size - Vehicle Type Segment 2020 - 2024 ($ million)

5.5 Geography segment analysis 2020 - 2024

Historic Market Size - Geography Segment 2020 - 2024 ($ million)

5.6 Country segment analysis 2020 - 2024

Historic Market Size - Country Segment 2020 - 2024 ($ million)

6. Qualitative Analysis

6.1 Impact of AI on Global Auto Extended Warranty Market

6.2 Impact of geopolitical conflicts on Global Auto Extended Warranty Market

7. Five Forces Analysis

7.1 Five forces summary

Five forces analysis - Comparison between 2025 and 2030

7.2 Bargaining power of buyers

Bargaining power of buyers - Impact of key factors 2025 and 2030

7.3 Bargaining power of suppliers

Bargaining power of suppliers - Impact of key factors in 2025 and 2030

7.4 Threat of new entrants

Threat of new entrants - Impact of key factors in 2025 and 2030

7.5 Threat of substitutes

Threat of substitutes - Impact of key factors in 2025 and 2030

7.6 Threat of rivalry

Threat of rivalry - Impact of key factors in 2025 and 2030

7.7 Market condition

Chart on Market condition - Five forces 2025 and 2030

8. Market Segmentation by End-user

8.1 Market segments

Chart on End-user - Market share 2025-2030 (%)
Data Table on End-user - Market share 2025-2030 (%)

8.2 Comparison by End-user

Chart on Comparison by End-user
Data Table on Comparison by End-user

8.3 Personal - Market size and forecast 2025-2030

Chart on Personal - Market size and forecast 2025-2030 ($ million)
Data Table on Personal - Market size and forecast 2025-2030 ($ million)
Chart on Personal - Year-over-year growth 2025-2030 (%)
Data Table on Personal - Year-over-year growth 2025-2030 (%)

8.4 Commercial - Market size and forecast 2025-2030

Chart on Commercial - Market size and forecast 2025-2030 ($ million)
Data Table on Commercial - Market size and forecast 2025-2030 ($ million)
Chart on Commercial - Year-over-year growth 2025-2030 (%)
Data Table on Commercial - Year-over-year growth 2025-2030 (%)

8.5 Market opportunity by End-user

Market opportunity by End-user ($ million)
Data Table on Market opportunity by End-user ($ million)

9. Market Segmentation by Type

9.1 Market segments

Chart on Type - Market share 2025-2030 (%)
Data Table on Type - Market share 2025-2030 (%)

9.2 Comparison by Type

Chart on Comparison by Type
Data Table on Comparison by Type

9.3 Powertrain warranty - Market size and forecast 2025-2030

Chart on Powertrain warranty - Market size and forecast 2025-2030 ($ million)
Data Table on Powertrain warranty - Market size and forecast 2025-2030 ($ million)
Chart on Powertrain warranty - Year-over-year growth 2025-2030 (%)
Data Table on Powertrain warranty - Year-over-year growth 2025-2030 (%)

9.4 Bumper-to-bumper warranty - Market size and forecast 2025-2030

Chart on Bumper-to-bumper warranty - Market size and forecast 2025-2030 ($ million)
Data Table on Bumper-to-bumper warranty - Market size and forecast 2025-2030 ($ million)
Chart on Bumper-to-bumper warranty - Year-over-year growth 2025-2030 (%)
Data Table on Bumper-to-bumper warranty - Year-over-year growth 2025-2030 (%)

9.5 Component warranty - Market size and forecast 2025-2030

Chart on Component warranty - Market size and forecast 2025-2030 ($ million)
Data Table on Component warranty - Market size and forecast 2025-2030 ($ million)
Chart on Component warranty - Year-over-year growth 2025-2030 (%)
Data Table on Component warranty - Year-over-year growth 2025-2030 (%)

9.6 Others - Market size and forecast 2025-2030

Chart on Others - Market size and forecast 2025-2030 ($ million)
Data Table on Others - Market size and forecast 2025-2030 ($ million)
Chart on Others - Year-over-year growth 2025-2030 (%)
Data Table on Others - Year-over-year growth 2025-2030 (%)

9.7 Market opportunity by Type

Market opportunity by Type ($ million)
Data Table on Market opportunity by Type ($ million)

10. Market Segmentation by Vehicle Type

10.1 Market segments

Chart on Vehicle Type - Market share 2025-2030 (%)
Data Table on Vehicle Type - Market share 2025-2030 (%)

10.2 Comparison by Vehicle Type

Chart on Comparison by Vehicle Type
Data Table on Comparison by Vehicle Type

10.3 Used vehicle - Market size and forecast 2025-2030

Chart on Used vehicle - Market size and forecast 2025-2030 ($ million)
Data Table on Used vehicle - Market size and forecast 2025-2030 ($ million)
Chart on Used vehicle - Year-over-year growth 2025-2030 (%)
Data Table on Used vehicle - Year-over-year growth 2025-2030 (%)

10.4 New vehicle - Market size and forecast 2025-2030

Chart on New vehicle - Market size and forecast 2025-2030 ($ million)
Data Table on New vehicle - Market size and forecast 2025-2030 ($ million)
Chart on New vehicle - Year-over-year growth 2025-2030 (%)
Data Table on New vehicle - Year-over-year growth 2025-2030 (%)

10.5 Market opportunity by Vehicle Type

Market opportunity by Vehicle Type ($ million)
Data Table on Market opportunity by Vehicle Type ($ million)

11. Customer Landscape

11.1 Customer landscape overview

Analysis of price sensitivity, lifecycle, customer purchase basket, adoption rates, and purchase criteria

12. Geographic Landscape

12.1 Geographic segmentation

Chart on Market share by geography 2025-2030 (%)
Data Table on Market share by geography 2025-2030 (%)

12.2 Geographic comparison

Chart on Geographic comparison
Data Table on Geographic comparison

12.3 North America - Market size and forecast 2025-2030

Chart on North America - Market size and forecast 2025-2030 ($ million)
Data Table on North America - Market size and forecast 2025-2030 ($ million)
Chart on North America - Year-over-year growth 2025-2030 (%)
Data Table on North America - Year-over-year growth 2025-2030 (%)
Chart on Regional Comparison - North America
Data Table on Regional Comparison - North America

12.3.1 US - Market size and forecast 2025-2030

Chart on US - Market size and forecast 2025-2030 ($ million)
Data Table on US - Market size and forecast 2025-2030 ($ million)
Chart on US - Year-over-year growth 2025-2030 (%)
Data Table on US - Year-over-year growth 2025-2030 (%)

12.3.2 Canada - Market size and forecast 2025-2030

Chart on Canada - Market size and forecast 2025-2030 ($ million)
Data Table on Canada - Market size and forecast 2025-2030 ($ million)
Chart on Canada - Year-over-year growth 2025-2030 (%)
Data Table on Canada - Year-over-year growth 2025-2030 (%)

12.3.3 Mexico - Market size and forecast 2025-2030

Chart on Mexico - Market size and forecast 2025-2030 ($ million)
Data Table on Mexico - Market size and forecast 2025-2030 ($ million)
Chart on Mexico - Year-over-year growth 2025-2030 (%)
Data Table on Mexico - Year-over-year growth 2025-2030 (%)

12.4 Europe - Market size and forecast 2025-2030

Chart on Europe - Market size and forecast 2025-2030 ($ million)
Data Table on Europe - Market size and forecast 2025-2030 ($ million)
Chart on Europe - Year-over-year growth 2025-2030 (%)
Data Table on Europe - Year-over-year growth 2025-2030 (%)
Chart on Regional Comparison - Europe
Data Table on Regional Comparison - Europe

12.4.1 Germany - Market size and forecast 2025-2030

Chart on Germany - Market size and forecast 2025-2030 ($ million)
Data Table on Germany - Market size and forecast 2025-2030 ($ million)
Chart on Germany - Year-over-year growth 2025-2030 (%)
Data Table on Germany - Year-over-year growth 2025-2030 (%)

12.4.2 UK - Market size and forecast 2025-2030

Chart on UK - Market size and forecast 2025-2030 ($ million)
Data Table on UK - Market size and forecast 2025-2030 ($ million)
Chart on UK - Year-over-year growth 2025-2030 (%)
Data Table on UK - Year-over-year growth 2025-2030 (%)

12.4.3 France - Market size and forecast 2025-2030

Chart on France - Market size and forecast 2025-2030 ($ million)
Data Table on France - Market size and forecast 2025-2030 ($ million)
Chart on France - Year-over-year growth 2025-2030 (%)
Data Table on France - Year-over-year growth 2025-2030 (%)

12.4.4 Italy - Market size and forecast 2025-2030

Chart on Italy - Market size and forecast 2025-2030 ($ million)
Data Table on Italy - Market size and forecast 2025-2030 ($ million)
Chart on Italy - Year-over-year growth 2025-2030 (%)
Data Table on Italy - Year-over-year growth 2025-2030 (%)

12.4.5 Spain - Market size and forecast 2025-2030

Chart on Spain - Market size and forecast 2025-2030 ($ million)
Data Table on Spain - Market size and forecast 2025-2030 ($ million)
Chart on Spain - Year-over-year growth 2025-2030 (%)
Data Table on Spain - Year-over-year growth 2025-2030 (%)

12.4.6 The Netherlands - Market size and forecast 2025-2030

Chart on The Netherlands - Market size and forecast 2025-2030 ($ million)
Data Table on The Netherlands - Market size and forecast 2025-2030 ($ million)
Chart on The Netherlands - Year-over-year growth 2025-2030 (%)
Data Table on The Netherlands - Year-over-year growth 2025-2030 (%)

12.5 APAC - Market size and forecast 2025-2030

Chart on APAC - Market size and forecast 2025-2030 ($ million)
Data Table on APAC - Market size and forecast 2025-2030 ($ million)
Chart on APAC - Year-over-year growth 2025-2030 (%)
Data Table on APAC - Year-over-year growth 2025-2030 (%)
Chart on Regional Comparison - APAC
Data Table on Regional Comparison - APAC

12.5.1 China - Market size and forecast 2025-2030

Chart on China - Market size and forecast 2025-2030 ($ million)
Data Table on China - Market size and forecast 2025-2030 ($ million)
Chart on China - Year-over-year growth 2025-2030 (%)
Data Table on China - Year-over-year growth 2025-2030 (%)

12.5.2 Japan - Market size and forecast 2025-2030

Chart on Japan - Market size and forecast 2025-2030 ($ million)
Data Table on Japan - Market size and forecast 2025-2030 ($ million)
Chart on Japan - Year-over-year growth 2025-2030 (%)
Data Table on Japan - Year-over-year growth 2025-2030 (%)

12.5.3 India - Market size and forecast 2025-2030

Chart on India - Market size and forecast 2025-2030 ($ million)
Data Table on India - Market size and forecast 2025-2030 ($ million)
Chart on India - Year-over-year growth 2025-2030 (%)
Data Table on India - Year-over-year growth 2025-2030 (%)

12.5.4 South Korea - Market size and forecast 2025-2030

Chart on South Korea - Market size and forecast 2025-2030 ($ million)
Data Table on South Korea - Market size and forecast 2025-2030 ($ million)
Chart on South Korea - Year-over-year growth 2025-2030 (%)
Data Table on South Korea - Year-over-year growth 2025-2030 (%)

12.5.5 Australia - Market size and forecast 2025-2030

Chart on Australia - Market size and forecast 2025-2030 ($ million)
Data Table on Australia - Market size and forecast 2025-2030 ($ million)
Chart on Australia - Year-over-year growth 2025-2030 (%)
Data Table on Australia - Year-over-year growth 2025-2030 (%)

12.5.6 Indonesia - Market size and forecast 2025-2030

Chart on Indonesia - Market size and forecast 2025-2030 ($ million)
Data Table on Indonesia - Market size and forecast 2025-2030 ($ million)
Chart on Indonesia - Year-over-year growth 2025-2030 (%)
Data Table on Indonesia - Year-over-year growth 2025-2030 (%)

12.6 South America - Market size and forecast 2025-2030

Chart on South America - Market size and forecast 2025-2030 ($ million)
Data Table on South America - Market size and forecast 2025-2030 ($ million)
Chart on South America - Year-over-year growth 2025-2030 (%)
Data Table on South America - Year-over-year growth 2025-2030 (%)
Chart on Regional Comparison - South America
Data Table on Regional Comparison - South America

12.6.1 Brazil - Market size and forecast 2025-2030

Chart on Brazil - Market size and forecast 2025-2030 ($ million)
Data Table on Brazil - Market size and forecast 2025-2030 ($ million)
Chart on Brazil - Year-over-year growth 2025-2030 (%)
Data Table on Brazil - Year-over-year growth 2025-2030 (%)

12.6.2 Argentina - Market size and forecast 2025-2030

Chart on Argentina - Market size and forecast 2025-2030 ($ million)
Data Table on Argentina - Market size and forecast 2025-2030 ($ million)
Chart on Argentina - Year-over-year growth 2025-2030 (%)
Data Table on Argentina - Year-over-year growth 2025-2030 (%)

12.6.3 Chile - Market size and forecast 2025-2030

Chart on Chile - Market size and forecast 2025-2030 ($ million)
Data Table on Chile - Market size and forecast 2025-2030 ($ million)
Chart on Chile - Year-over-year growth 2025-2030 (%)
Data Table on Chile - Year-over-year growth 2025-2030 (%)

12.7 Middle East and Africa - Market size and forecast 2025-2030

Chart on Middle East and Africa - Market size and forecast 2025-2030 ($ million)
Data Table on Middle East and Africa - Market size and forecast 2025-2030 ($ million)
Chart on Middle East and Africa - Year-over-year growth 2025-2030 (%)
Data Table on Middle East and Africa - Year-over-year growth 2025-2030 (%)
Chart on Regional Comparison - Middle East and Africa
Data Table on Regional Comparison - Middle East and Africa

12.7.1 Saudi Arabia - Market size and forecast 2025-2030

Chart on Saudi Arabia - Market size and forecast 2025-2030 ($ million)
Data Table on Saudi Arabia - Market size and forecast 2025-2030 ($ million)
Chart on Saudi Arabia - Year-over-year growth 2025-2030 (%)
Data Table on Saudi Arabia - Year-over-year growth 2025-2030 (%)

12.7.2 UAE - Market size and forecast 2025-2030

Chart on UAE - Market size and forecast 2025-2030 ($ million)
Data Table on UAE - Market size and forecast 2025-2030 ($ million)
Chart on UAE - Year-over-year growth 2025-2030 (%)
Data Table on UAE - Year-over-year growth 2025-2030 (%)

12.7.3 South Africa - Market size and forecast 2025-2030

Chart on South Africa - Market size and forecast 2025-2030 ($ million)
Data Table on South Africa - Market size and forecast 2025-2030 ($ million)
Chart on South Africa - Year-over-year growth 2025-2030 (%)
Data Table on South Africa - Year-over-year growth 2025-2030 (%)

12.7.4 Turkey - Market size and forecast 2025-2030

Chart on Turkey - Market size and forecast 2025-2030 ($ million)
Data Table on Turkey - Market size and forecast 2025-2030 ($ million)
Chart on Turkey - Year-over-year growth 2025-2030 (%)
Data Table on Turkey - Year-over-year growth 2025-2030 (%)

12.7.5 Israel - Market size and forecast 2025-2030

Chart on Israel - Market size and forecast 2025-2030 ($ million)
Data Table on Israel - Market size and forecast 2025-2030 ($ million)
Chart on Israel - Year-over-year growth 2025-2030 (%)
Data Table on Israel - Year-over-year growth 2025-2030 (%)

12.8 Market opportunity by geography

Market opportunity by geography ($ million)
Data Tables on Market opportunity by geography ($ million)

13. Drivers, Challenges, and Opportunity

13.1 Market drivers

Rising complexity of automotive technology
Extended duration of vehicle ownership
Digital transformation and customized coverage

13.2 Market challenges

Rising modern vehicle complexity costs
Severe consumer trust deficit
Regulatory compliance and fragmented frameworks

13.3 Impact of drivers and challenges

Impact of drivers and challenges in 2025 and 2030

13.4 Market opportunities

Proliferation of used car transactions
Integration of predictive maintenance analytics
Rise of embedded finance channels

14. Competitive Landscape

14.1 Overview

14.2

Overview on criticality of inputs and factors of differentiation

14.3 Landscape disruption

Overview on factors of disruption

14.4 Industry risks

Impact of key risks on business

15. Competitive Analysis

15.1 Companies profiled

Companies covered

15.2 Company ranking index

15.3 Market positioning of companies

Matrix on companies position and classification

15.4 Allianz Partners SAS

Allianz Partners SAS - Overview
Allianz Partners SAS - Product / Service
Allianz Partners SAS - Key offerings
SWOT

15.5 Ally Financial Inc.

Ally Financial Inc. - Overview
Ally Financial Inc. - Business segments
Ally Financial Inc. - Key offerings
Ally Financial Inc. - Segment focus
SWOT

15.6 American Auto Shield LLC

American Auto Shield LLC - Overview
American Auto Shield LLC - Product / Service
American Auto Shield LLC - Key offerings
SWOT

15.7 American Guardian

American Guardian - Overview
American Guardian - Product / Service
American Guardian - Key offerings
SWOT

15.8 American International Group

American International Group - Overview
American International Group - Business segments
American International Group - Key news
American International Group - Key offerings
American International Group - Segment focus
SWOT

15.9 AmTrust Financial Services

AmTrust Financial Services - Overview
AmTrust Financial Services - Product / Service
AmTrust Financial Services - Key offerings
SWOT

15.10 APCO Holdings LLC

APCO Holdings LLC - Overview
APCO Holdings LLC - Product / Service
APCO Holdings LLC - Key offerings
SWOT

15.11 Assurant Inc.

Assurant Inc. - Overview
Assurant Inc. - Business segments
Assurant Inc. - Key offerings
Assurant Inc. - Segment focus
SWOT

15.12 AXA Partners

AXA Partners - Overview
AXA Partners - Product / Service
AXA Partners - Key offerings
SWOT

15.13 Axiom Administration Services

Axiom Administration Services - Overview
Axiom Administration Services - Product / Service
Axiom Administration Services - Key offerings
SWOT

15.14 BNP Paribas Cardif

BNP Paribas Cardif - Overview
BNP Paribas Cardif - Product / Service
BNP Paribas Cardif - Key offerings
SWOT

15.15 GSFSGroup

GSFSGroup - Overview
GSFSGroup - Product / Service
GSFSGroup - Key offerings
SWOT

15.16 MAPFRE S.A.

MAPFRE S.A. - Overview
MAPFRE S.A. - Business segments
MAPFRE S.A. - Key offerings
MAPFRE S.A. - Segment focus
SWOT

15.17 Protective Asset Protection

Protective Asset Protection - Overview
Protective Asset Protection - Product / Service
Protective Asset Protection - Key offerings
SWOT

15.18 QBE Insurance Group Ltd.

QBE Insurance Group Ltd. - Overview
QBE Insurance Group Ltd. - Business segments
QBE Insurance Group Ltd. - Key news
QBE Insurance Group Ltd. - Key offerings
QBE Insurance Group Ltd. - Segment focus
SWOT

16. Appendix

16.1 Scope of the report

Market definition
Objectives
Notes and caveats

16.2 Inclusions and exclusions checklist

Inclusions checklist
Exclusions checklist

16.3 Currency conversion rates for US$

16.4 Research methodology

16.5 Data procurement

Information sources

16.6 Data validation

16.7 Validation techniques employed for market sizing

16.8 Data synthesis

16.9 360 degree market analysis

16.10 List of abbreviations

Research Methodology

Technavio presents a detailed picture of the market by way of study, synthesis, and summation of data from multiple sources. The analysts have presented the various facets of the market with a particular focus on identifying the key industry influencers. The data thus presented is comprehensive, reliable, and the result of extensive research, both primary and secondary.

INFORMATION SOURCES

Primary sources

  • Manufacturers and suppliers
  • Channel partners
  • Industry experts
  • Strategic decision makers

Secondary sources

  • Industry journals and periodicals
  • Government data
  • Financial reports of key industry players
  • Historical data
  • Press releases

DATA ANALYSIS

Data Synthesis

  • Collation of data
  • Estimation of key figures
  • Analysis of derived insights

Data Validation

  • Triangulation with data models
  • Reference against proprietary databases
  • Corroboration with industry experts

REPORT WRITING

Qualitative

  • Market drivers
  • Market challenges
  • Market trends
  • Five forces analysis

Quantitative

  • Market size and forecast
  • Market segmentation
  • Geographical insights
  • Competitive landscape

Interested in this report?

Get your sample now to see our research methodology and insights!

Download Now

Frequently Asked Questions

Auto Extended Warranty market growth will increase by USD 16445.5 million during 2026-2030.

The Auto Extended Warranty market is expected to grow at a CAGR of 6.6% during 2026-2030.

Auto Extended Warranty market is segmented by End-user (Personal, Commercial) Type (Powertrain warranty, Bumper-to-bumper warranty, Component warranty, Others) Vehicle type (Used vehicle, New vehicle)

Allianz Partners SAS, Ally Financial Inc., American Auto Shield LLC, American Guardian, American International Group, AmTrust Financial Services, APCO Holdings LLC, Assurant Inc., AXA Partners, Axiom Administration Services, BNP Paribas Cardif, Cars Protection Plus Inc., Century Service Corp., CNA National Warranty Corp., EFG Companies, Endurance Warranty Services, GSFSGroup, MAPFRE S.A., Protective Asset Protection, QBE Insurance Group Ltd., Route 66 Warranty, Total Warranty Services LLC, Zurich Insurance Co. Ltd. are a few of the key vendors in the Auto Extended Warranty market.

North America will register the highest growth rate of 66.2% among the other regions. Therefore, the Auto Extended Warranty market in North America is expected to garner significant business opportunities for the vendors during the forecast period.

US, Canada, Mexico, Germany, UK, France, Italy, Spain, The Netherlands, China, Japan, India, South Korea, Australia, Indonesia, Brazil, Argentina, Chile, Saudi Arabia, UAE, South Africa, Turkey, Israel

  • Rising complexity of automotive technology is the driving factor this market.

The Auto Extended Warranty market vendors should focus on grabbing business opportunities from the End-user segment as it accounted for the largest market share in the base year.
RIA - Research AI Assistant
Ask RIA
