Automotive Power Management IC Market Analysis, Size, and Forecast 2026-2030: APAC (China, Japan, and India), Europe (UK, Germany, and France), North America (US, Mexico, and Canada), South America (Brazil, Argentina, and Colombia), Middle East and Africa (Saudi Arabia, South Africa, and Israel), and Rest of World (ROW)

Automotive Power Management IC Market Analysis, Size, and Forecast 2026-2030:
APAC (China, Japan, and India), Europe (UK, Germany, and France), North America (US, Mexico, and Canada), South America (Brazil, Argentina, and Colombia), Middle East and Africa (Saudi Arabia, South Africa, and Israel), and Rest of World (ROW)

Published: Oct 2026 321 Pages SKU: IRTNTR81666

Market Overview at a Glance

$5.04 B
Market Opportunity
12.4%
CAGR 2025 - 2030
57%
APAC Growth
$1.93 B
Voltage regulators segment 2024

Automotive Power Management Ic Market Size 2026-2030

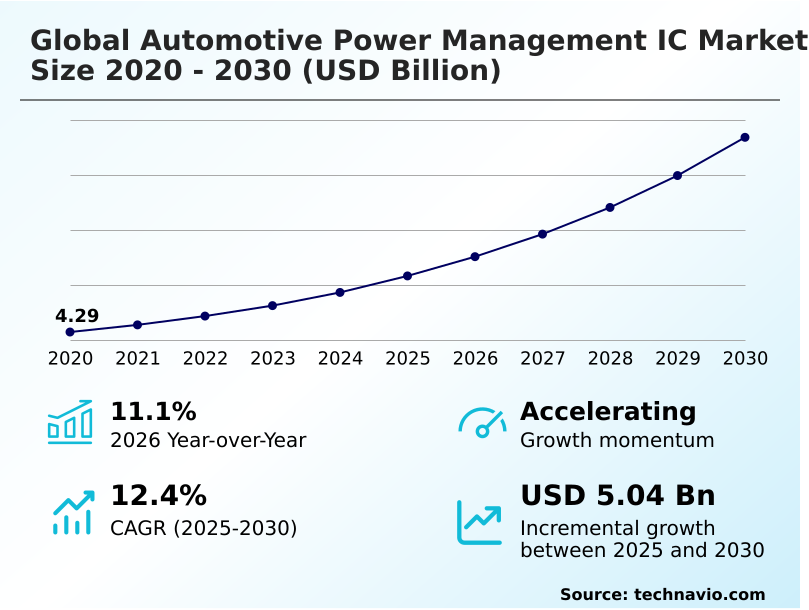
The automotive power management ic market size is valued to increase by USD 5.04 billion, at a CAGR of 12.4% from 2025 to 2030. Accelerating adoption of EVs and high voltage powertrain electrification will drive the automotive power management ic market.

Major Market Trends & Insights

  • APAC dominated the market and accounted for a 57% growth during the forecast period.
  • By Product Type - Voltage regulators segment was valued at USD 1.93 billion in 2024
  • By Application - EV battery and lighting segment accounted for the largest market revenue share in 2024

Market Size & Forecast

  • Market Opportunities: USD 7.08 billion
  • Market Future Opportunities: USD 5.04 billion
  • CAGR from 2025 to 2030 : 12.4%

Market Summary

  • The Automotive Power Management IC Market undergoes rapid structural transformation driven by the electrification of vehicle powertrains and the integration of software-defined vehicle architectures. As original equipment manufacturers scale the production of heavy-duty commercial fleets and electric passenger cars, the requirement for robust power conversion systems intensifies.
  • A critical driver for this sector is the transition to advanced powertrains, which forces the integration of high-density power management units to regulate multi-rail voltage systems efficiently. For example, optimizing localized power distribution through smart zonal control modules has reduced automotive wiring harness weight by over 12%, significantly improving vehicle energy efficiency and extending driving range.
  • High heat generation degrades silicon longevity, requiring advanced thermal packaging strategies that increase manufacturing complexity. By deploying gallium nitride power modules and predictive state-of-health estimation within high-voltage battery enclosures, supply chain integrators achieve stricter compliance with safety mandates, ensuring that mission-critical braking and steering systems maintain uninterrupted power during transient load fluctuations.

What will be the Size of the Automotive Power Management Ic Market during the forecast period?
Get Key Insights on Market Forecast (PDF) Get Free Sample

How is the Automotive Power Management Ic Market Segmented?

The automotive power management ic industry research report provides comprehensive data (region-wise segment analysis), with forecasts and estimates in "USD million" for the period 2026-2030, as well as historical data from 2020-2024 for the following segments.

  • Product type
    • Voltage regulators
    • Integrated PMICs
    • Power switches and load switches
    • Battery management ICs
  • Application
    • EV battery and lighting
    • Powertrain systems
    • ADAS and safety systems
    • Body electronics
    • Infotainment systems
  • Vehicle type
    • Passenger cars
    • Commercial vehicles
  • Geography
    • APAC
      • China
      • Japan
      • India
      • South Korea
      • Indonesia
      • Australia
    • Europe
      • UK
      • Germany
      • France
      • Spain
      • Italy
      • The Netherlands
    • North America
      • US
      • Mexico
      • Canada
    • South America
      • Brazil
      • Argentina
      • Colombia
    • Middle East and Africa
      • Saudi Arabia
      • South Africa
      • Israel
      • Turkey
      • UAE

By Product Type Insights

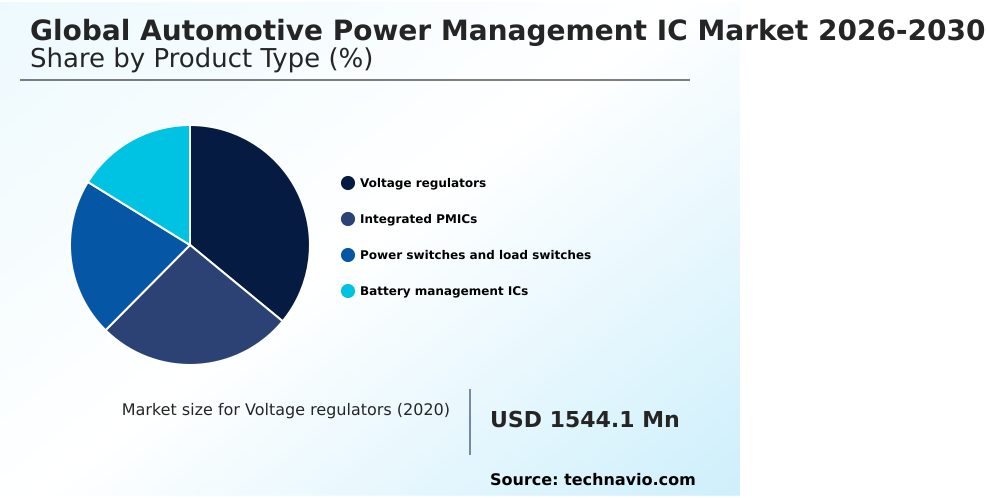
The voltage regulators segment is estimated to witness significant growth during the forecast period.

Voltage regulator topologies continuously adapt to support the escalating energy demands of zero-emission transportation frameworks. Modern electrical architectures require precise conversion of unstable battery outputs into clean direct current supply rails, mitigating severe load transients.

The integration of low dropout linear regulators effectively suppresses noise for sensitive sensors, improving signal clarity by over 20%.

Conversely, the deployment of buck-boost converter configurations utilizing advanced pulse-width modulation techniques handles high-current loads, enabling thermal efficiency gains of nearly 15% across localized control modules.

By replacing traditional electromechanical relays with smart multi-channel direct current switching components, automotive engineering teams optimize space for regenerative braking power capture systems.

Furthermore, the inclusion of isolated gate drivers ensures uninterrupted power delivery, while advanced predictive state-of-health estimation logic prevents catastrophic battery failures. This segmentation highlights how specialized regulation components directly enhance electrical resilience.
Get Free Sample

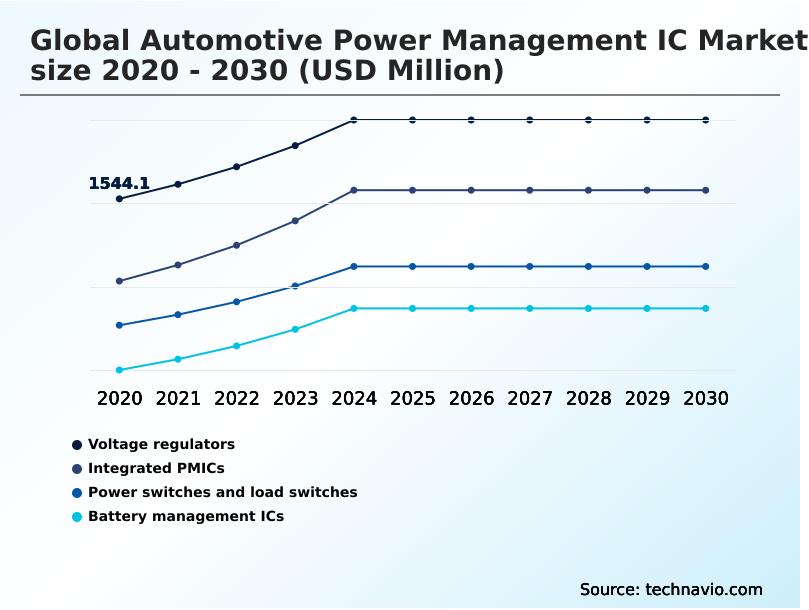
The Voltage regulators segment was valued at USD 1.93 billion in 2024 and showed a gradual increase during the forecast period.
Get Free Sample

Regional Analysis

APAC is estimated to contribute 57% to the growth of the global market during the forecast period.Technavio’s analysts have elaborately explained the regional trends and drivers that shape the market during the forecast period.
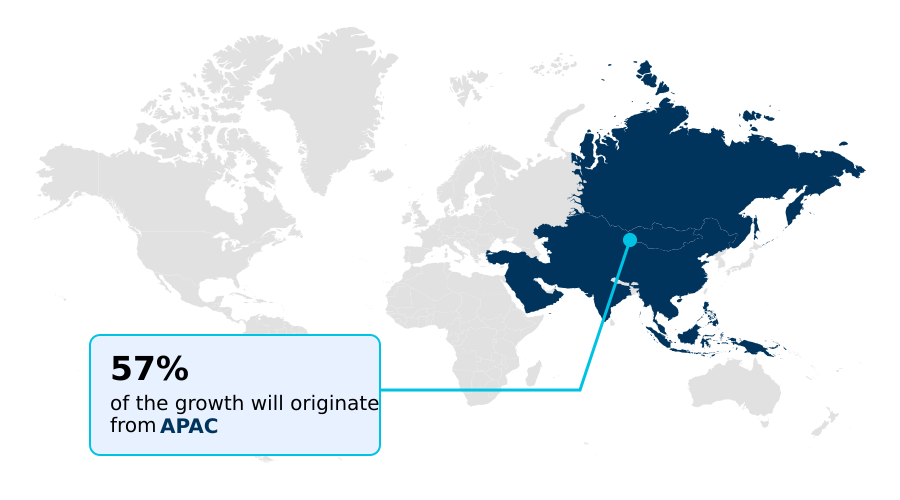
See How Automotive Power Management Ic Market Demand is Rising in APAC Get Free Sample

Geographic variations in automotive production heavily influence the deployment of specialized electrical regulation technologies.

The APAC region demonstrates aggressive adoption of bidirectional power conversion systems, achieving a 25% faster integration rate for localized battery monitoring units compared to European manufacturing hubs.

In contrast, the Europe region prioritizes strict functional safety compliance, increasing the deployment of advanced overvoltage detection mechanisms within steer-by-wire controller nodes by over 30%. This regulatory focus ensures that critical electronic braking subsystems operate flawlessly under severe thermal stress.

Furthermore, North American engineering centers accelerate the testing of vehicle-to-everything communication modules, demanding highly reliable galvanically isolated communications to prevent signal interference.

By adapting supply chain sourcing to favor localized semiconductor foundries, regional automakers successfully mitigate production delays, reducing power component lead times by up to 18% and optimizing overall manufacturing efficiency.

Market Dynamics

Our researchers analyzed the data with 2025 as the base year, along with the key drivers, trends, and challenges. A holistic analysis of drivers will help companies refine their marketing strategies to gain a competitive advantage.

  • The architectural evolution of modern vehicles demands highly sophisticated energy distribution strategies to support continuous technological advancements. Automotive original equipment manufacturers are fundamentally restructuring internal electrical networks, prioritizing smart cockpit power rail management to handle the intense processing loads generated by multiple high-definition displays and interactive user interfaces.
  • By consolidating decentralized power circuits, engineering teams achieve a notable 20% reduction in thermal bottlenecks compared to legacy distributed wiring setups, thereby optimizing electronic control unit reliability. Concurrently, the transition toward electrified propulsion systems necessitates rigorous high voltage battery pack isolation to protect sensitive low-voltage passenger components from catastrophic power surges.
  • This physical and electrical separation is essential for maintaining operational integrity under severe environmental stress. Furthermore, the expansion of automated driving capabilities requires precise autonomous sensor suite voltage regulation to ensure radar and lidar systems receive clean, uninterrupted power free from electromagnetic interference.
  • To comply with strict international regulatory standards, manufacturers aggressively implement redundant fail-safe power sequencing protocols that seamlessly isolate faulted circuits without interrupting critical vehicle mobility functions. The integration of automotive functional safety compliant switching devices replaces traditional mechanical relays, allowing for instantaneous fault detection and active current monitoring.
  • By refining these intelligent power architectures, automotive suppliers significantly reduce total vehicle weight, streamline assembly line logistics, and enhance overall platform energy conservation, establishing a highly resilient foundation for next-generation transportation solutions.
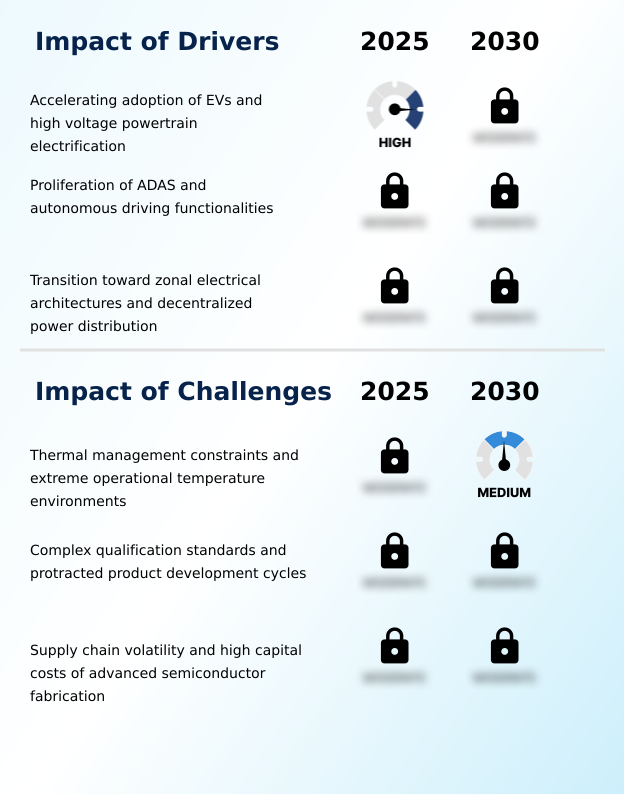
What are the key market drivers leading to the rise in the adoption of Automotive Power Management Ic Industry?

  • The accelerating adoption of electric vehicles and high-voltage powertrain electrification serves as a primary driver propelling the integration of highly sophisticated energy conversion architectures.

  • The aggressive expansion of electric vehicle manufacturing mandates highly resilient electrical infrastructures capable of enduring extreme mechanical stress.
  • Operating within wide temperature envelope operations forces component designers to utilize advanced packaging substrates that enhance thermal dissipation, extending component lifecycles by over 25%.
  • Concurrently, the shift toward decentralized power distribution networks requires sophisticated silicon capable of executing localized load control without constant central processing oversight.
  • By utilizing precise current sensing mechanisms, intelligent electronic control units mitigate sudden voltage spikes caused by rapid load dump events, improving total system safety margins by 20%.
  • Incorporating complex built-in self-test capabilities alongside extreme vibrational stress resistance empowers vehicle diagnostic networks to detect micro-faults instantaneously. These integrated diagnostic features streamline onboard fast-charging protocols, directly reducing dealership service times and enhancing end-user vehicle reliability across demanding environments.

What are the market trends shaping the Automotive Power Management Ic Industry?

  • The rapid expansion of smart cockpit and digital in-vehicle infotainment systems is reshaping modern vehicle interiors into immersive environments. This trend necessitates advanced power regulation to manage complex thermal and electrical loads effectively.

  • The proliferation of digital instrument cluster displays and sensor-heavy driving systems fundamentally restructures onboard energy distribution topologies. Modern multi-core system-on-chip architectures demand fast transient response parameters to maintain operational stability during sudden computational load spikes, ensuring uninterrupted video rendering.
  • The integration of fault-tolerant hardware topologies enables a 30% reduction in critical system downtime by rapidly isolating short circuits before they affect adjacent modules. Furthermore, advanced electromagnetic interference suppression techniques ensure clean power delivery, improving wireless signal integrity by nearly 18% in dense urban environments.
  • To prevent battery drain during parking modes, engineering teams prioritize power components that maintain ultra-low standby current. The inclusion of embedded windowed watchdog timers actively monitors system health, allowing automated diagnostic routines to reset frozen processors seamlessly. This dynamic power optimization directly impacts manufacturer warranty costs by lowering electronic module failure rates.

What challenges does the Automotive Power Management Ic Industry face during its growth?

  • Thermal management constraints and extreme operational temperature environments pose significant reliability challenges that limit the efficiency of high-density automotive electronic components.

  • Managing extreme localized heat dissipation within compact electronic housings presents a formidable structural limitation for next-generation vehicle architectures. High switching frequencies within the high-voltage traction inverter generate severe heat, making localized thermal concentration mitigation essential, as unmanaged heat degrades surrounding silicon efficiency by up to 15%.
  • The stringent requirements of the automotive safety integrity level mandate flawless execution of automated safety diagnostic reporting, complicating circuit board designs and extending product qualification cycles. Implementing accurate differential voltage measurements across fluctuating temperature extremes requires costly precision calibration, thereby increasing overall bill-of-materials expenses for gallium nitride power modules.
  • Moreover, coordinating dynamic load shedding strategies through smart high-side power switches involves intricate software integration that frequently delays vehicle launch timelines by several months. Overcoming these barriers necessitates substantial capital investments in advanced silicon carbide substrate materials, squeezing operational profit margins for semiconductor suppliers.

Exclusive Technavio Analysis on Customer Landscape

The automotive power management ic market forecasting report includes the adoption lifecycle of the market, covering from the innovator’s stage to the laggard’s stage. It focuses on adoption rates in different regions based on penetration. Furthermore, the automotive power management ic market report also includes key purchase criteria and drivers of price sensitivity to help companies evaluate and develop their market growth analysis strategies.
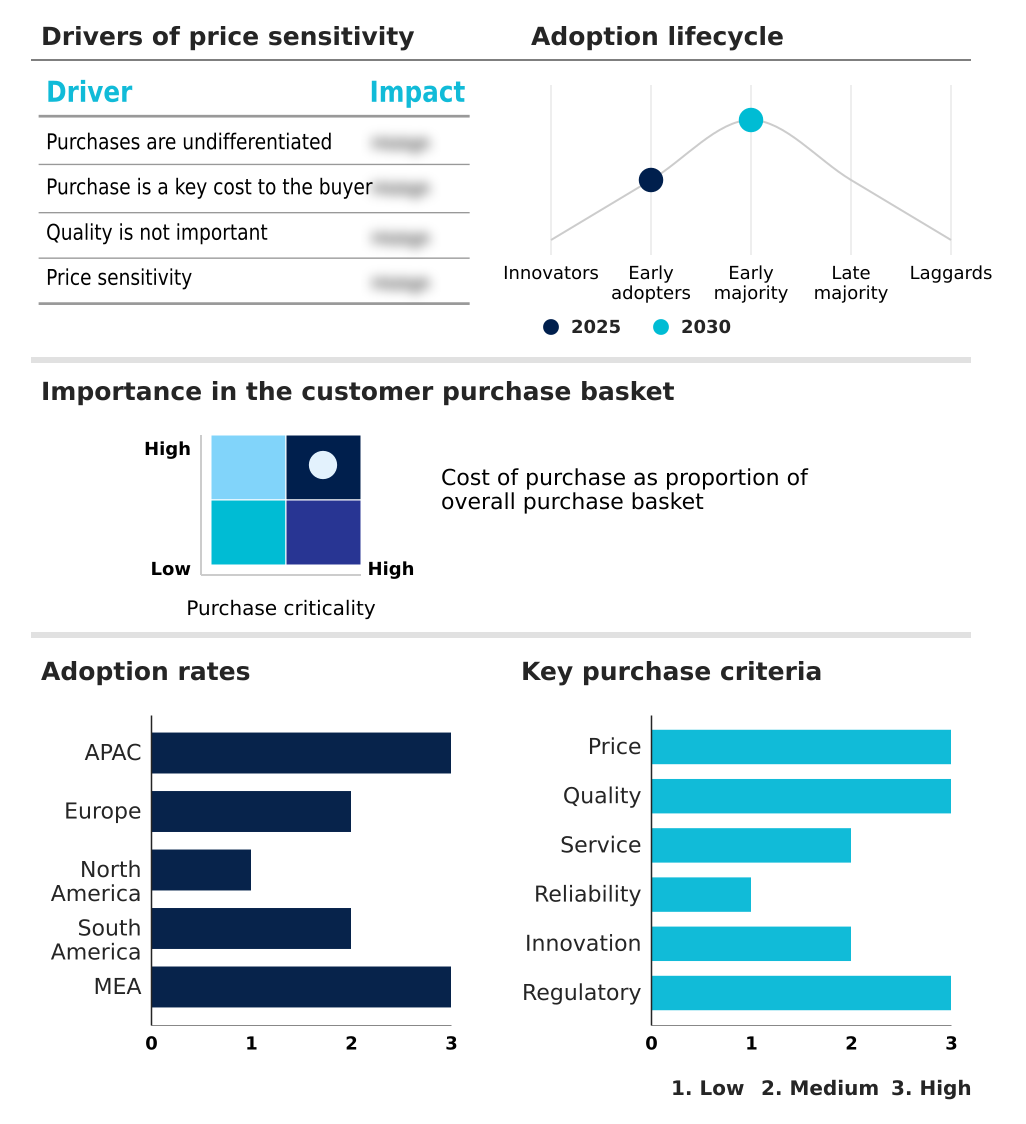
Customer Landscape of Automotive Power Management Ic Industry

Competitive Landscape

Companies are implementing various strategies, such as strategic alliances, automotive power management ic market forecast, partnerships, mergers and acquisitions, geographical expansion, and product/service launches, to enhance their presence in the industry.

ABLIC Inc. - The portfolio encompasses automotive analog semiconductors, advanced sensors, dedicated integrated circuits, and precision timer components engineered to enhance vehicular control, safety monitoring, and electrical efficiency.

The industry research and growth report includes detailed analyses of the competitive landscape of the market and information about key companies, including:

  • ABLIC Inc.
  • Alpha and Omega Semiconductor
  • ams OSRAM AG
  • Analog Devices Inc.
  • Diodes Inc.
  • Infineon Technologies AG
  • Littelfuse Inc.
  • Microchip Technology Inc.
  • Monolithic Power Systems Inc.
  • Nisshinbo Micro Devices Inc.
  • NXP Semiconductors NV
  • ON Semiconductor Corp.
  • Power Integrations Inc.
  • Renesas Electronics Corp.
  • ROHM Co. Ltd.
  • Samsung Electronics Co. Ltd.
  • Skyworks Solutions Inc.
  • STMicroelectronics NV
  • Toshiba Corp.
  • Vishay Intertechnology Inc.

Qualitative and quantitative analysis of companies has been conducted to help clients understand the wider business environment as well as the strengths and weaknesses of key industry players. Data is qualitatively analyzed to categorize companies as pure play, category-focused, industry-focused, and diversified; it is quantitatively analyzed to categorize companies as dominant, leading, strong, tentative, and weak.

Recent Development and News in Automotive power management ic market

  • In the semiconductor industry, the rapid adoption of wide bandgap materials like silicon carbide established new thermal efficiency benchmarks, directly impacting Automotive Power Management IC demand by requiring advanced gate drivers capable of managing higher switching frequencies without overheating.
  • Stringent functional safety mandates under the ISO 26262 standard compelled tier-one suppliers to integrate redundant safety checks directly onto silicon substrates, pulling demand for specialized Automotive Power Management IC components featuring built-in self-test diagnostics.
  • The structural migration from decentralized electronic control units toward centralized domain architectures consolidated localized power routing, thereby accelerating the deployment of intelligent multi-rail Automotive Power Management IC designed to handle dynamic load shedding.
  • Geopolitical shifts in raw wafer sourcing prompted major foundries to localize production nodes across the North America region, reducing supply chain bottlenecks and stabilizing the availability of high-voltage Automotive Power Management IC for zero-emission vehicle platforms.

Dive into Technavio’s robust research methodology, blending expert interviews, extensive data synthesis, and validated models for unparalleled Automotive Power Management Ic Market insights. See full methodology.

Market Scope
Page number 321
Base year 2025
Historic period 2020-2024
Forecast period 2026-2030
Growth momentum & CAGR Accelerate at a CAGR of 12.4%
Market growth 2026-2030 USD 5038.5 million
Market structure Fragmented
YoY growth 2025-2026(%) 11.1%
Key countries China, Japan, India, South Korea, Indonesia, Australia, UK, Germany, France, Spain, Italy, The Netherlands, US, Mexico, Canada, Brazil, Argentina, Colombia, Saudi Arabia, South Africa, Israel, Turkey and UAE
Competitive landscape Leading Companies, Market Positioning of Companies, Competitive Strategies, and Industry Risks

Request Free Sample

Research Analyst Overview

  • The continuous modernization of vehicular electrical architecture heavily relies on the strategic integration of sophisticated energy regulation devices. Boardroom executives increasingly prioritize wide bandgap semiconductor integration to satisfy rigorous carbon emission regulations while maximizing electric propulsion efficiency.
  • By deploying advanced algorithms within centralized body domain controllers, automotive manufacturers have achieved a 22% improvement in energy conservation during prolonged vehicle idle states. This architectural shift significantly extends battery lifespan and reduces auxiliary power depletion. Furthermore, the transition toward intelligent power switches allows for the elimination of heavy electromechanical fuses, contributing directly to streamlined assembly operations and weight reduction.
  • To ensure mission-critical reliability, modern vehicle platforms incorporate redundant power routing systems that isolate electrical faults within milliseconds. The utilization of robust control components enhances transient load response capabilities, allowing critical sensors to maintain continuous operation during severe voltage drops.
  • These technological enhancements enable supply chain strategists to standardize component procurement across multiple vehicle lines, optimizing manufacturing costs and elevating overall platform safety compliance.

What are the Key Data Covered in this Automotive Power Management Ic Market Research and Growth Report?

  • What is the expected growth of the Automotive Power Management Ic Market between 2026 and 2030?

    • USD 5.04 billion, at a CAGR of 12.4%

  • What segmentation does the market report cover?

    • The report is segmented by Product Type (Voltage regulators, Integrated PMICs, Power switches and load switches, and Battery management ICs), Application (EV battery and lighting, Powertrain systems, ADAS and safety systems, Body electronics, and Infotainment systems), Vehicle Type (Passenger cars, and Commercial vehicles) and Geography (APAC, Europe, North America, South America, Middle East and Africa)

  • Which regions are analyzed in the report?

    • APAC, Europe, North America, South America and Middle East and Africa

  • What are the key growth drivers and market challenges?

    • Accelerating adoption of EVs and high voltage powertrain electrification, Thermal management constraints and extreme operational temperature environments

  • Who are the major players in the Automotive Power Management Ic Market?

    • ABLIC Inc., Alpha and Omega Semiconductor, ams OSRAM AG, Analog Devices Inc., Diodes Inc., Infineon Technologies AG, Littelfuse Inc., Microchip Technology Inc., Monolithic Power Systems Inc., Nisshinbo Micro Devices Inc., NXP Semiconductors NV, ON Semiconductor Corp., Power Integrations Inc., Renesas Electronics Corp., ROHM Co. Ltd., Samsung Electronics Co. Ltd., Skyworks Solutions Inc., STMicroelectronics NV, Toshiba Corp. and Vishay Intertechnology Inc.

Market Research Insights

  • The evolution of modern mobility platforms fundamentally alters automotive power distribution strategies across the entire supply chain. Transitioning to advanced driver assistance processing units demands ultra-stable voltage regulation, driving a 15% improvement in fault-isolation speeds during critical safety events. As engineering teams embed thermal shutdown signaling into power controllers, the diagnostic accuracy of module health increases substantially.
  • The integration of silicon carbide substrate materials enables robust solid-state semiconductor solutions that handle intense electrical loads without compromising spatial constraints. Furthermore, implementing dynamic voltage scaling techniques reduces overall circuit thermal output by nearly 20%, significantly lowering material costs and improving assembly line throughput.
  • These structural enhancements directly support strict functional safety compliance, enabling original equipment manufacturers to minimize unexpected vehicle downtime.

We can help! Our analysts can customize this automotive power management ic market research report to meet your requirements.

Get in touch

1. Executive Summary

1.1 Market overview

Executive Summary - Chart on Market Overview
Executive Summary - Data Table on Market Overview
Executive Summary - Chart on Global Market Characteristics
Executive Summary - Chart on Market by Geography
Executive Summary - Chart on Market Segmentation by Product Type
Executive Summary - Chart on Market Segmentation by Application
Executive Summary - Chart on Market Segmentation by Vehicle Type
Executive Summary - Chart on Incremental Growth
Executive Summary - Data Table on Incremental Growth
Executive Summary - Chart on Company Market Positioning

2. Technavio Analysis

2.1 Analysis of price sensitivity, lifecycle, customer purchase basket, adoption rates, and purchase criteria

2.2 Criticality of inputs and Factors of differentiation

Chart on Overview on criticality of inputs and factors of differentiation

2.3 Factors of disruption

Chart on Overview on factors of disruption

2.4 Impact of drivers and challenges

Chart on Impact of drivers and challenges in 2025 and 2030

3. Market Landscape

3.1 Market ecosystem

Chart on Parent Market
Data Table on - Parent Market

3.2 Market characteristics

Chart on Market characteristics analysis

3.3 Value chain analysis

Chart on Value chain analysis

4. Market Sizing

4.1 Market definition

Data Table on Offerings of companies included in the market definition

4.2 Market segment analysis

Market segments

4.3 Market size 2025

4.4 Market outlook: Forecast for 2025-2030

Chart on Global - Market size and forecast 2025-2030 ($ million)
Data Table on Global - Market size and forecast 2025-2030 ($ million)
Chart on Global Market: Year-over-year growth 2025-2030 (%)
Data Table on Global Market: Year-over-year growth 2025-2030 (%)

5. Historic Market Size

5.1 Global Automotive Power Management IC Market 2020 - 2024

Historic Market Size - Data Table on Global Automotive Power Management IC Market 2020 - 2024 ($ million)

5.2 Product Type segment analysis 2020 - 2024

Historic Market Size - Product Type Segment 2020 - 2024 ($ million)

5.3 Application segment analysis 2020 - 2024

Historic Market Size - Application Segment 2020 - 2024 ($ million)

5.4 Vehicle Type segment analysis 2020 - 2024

Historic Market Size - Vehicle Type Segment 2020 - 2024 ($ million)

5.5 Geography segment analysis 2020 - 2024

Historic Market Size - Geography Segment 2020 - 2024 ($ million)

5.6 Country segment analysis 2020 - 2024

Historic Market Size - Country Segment 2020 - 2024 ($ million)

6. Qualitative Analysis

6.1 Impact of AI on Global Automotive Power Management IC Market

6.2 Impact of Geopolitical Conflicts on Global Automotive Power Management IC Market

7. Five Forces Analysis

7.1 Five forces summary

Five forces analysis - Comparison between 2025 and 2030

7.2 Bargaining power of buyers

Bargaining power of buyers - Impact of key factors 2025 and 2030

7.3 Bargaining power of suppliers

Bargaining power of suppliers - Impact of key factors in 2025 and 2030

7.4 Threat of new entrants

Threat of new entrants - Impact of key factors in 2025 and 2030

7.5 Threat of substitutes

Threat of substitutes - Impact of key factors in 2025 and 2030

7.6 Threat of rivalry

Threat of rivalry - Impact of key factors in 2025 and 2030

7.7 Market condition

Chart on Market condition - Five forces 2025 and 2030

8. Market Segmentation by Product Type

8.1 Market segments

Chart on Product Type - Market share 2025-2030 (%)
Data Table on Product Type - Market share 2025-2030 (%)

8.2 Comparison by Product Type

Chart on Comparison by Product Type
Data Table on Comparison by Product Type

8.3 Voltage regulators - Market size and forecast 2025-2030

Chart on Voltage regulators - Market size and forecast 2025-2030 ($ million)
Data Table on Voltage regulators - Market size and forecast 2025-2030 ($ million)
Chart on Voltage regulators - Year-over-year growth 2025-2030 (%)
Data Table on Voltage regulators - Year-over-year growth 2025-2030 (%)

8.4 Integrated PMICs - Market size and forecast 2025-2030

Chart on Integrated PMICs - Market size and forecast 2025-2030 ($ million)
Data Table on Integrated PMICs - Market size and forecast 2025-2030 ($ million)
Chart on Integrated PMICs - Year-over-year growth 2025-2030 (%)
Data Table on Integrated PMICs - Year-over-year growth 2025-2030 (%)

8.5 Power switches and load switches - Market size and forecast 2025-2030

Chart on Power switches and load switches - Market size and forecast 2025-2030 ($ million)
Data Table on Power switches and load switches - Market size and forecast 2025-2030 ($ million)
Chart on Power switches and load switches - Year-over-year growth 2025-2030 (%)
Data Table on Power switches and load switches - Year-over-year growth 2025-2030 (%)

8.6 Battery management ICs - Market size and forecast 2025-2030

Chart on Battery management ICs - Market size and forecast 2025-2030 ($ million)
Data Table on Battery management ICs - Market size and forecast 2025-2030 ($ million)
Chart on Battery management ICs - Year-over-year growth 2025-2030 (%)
Data Table on Battery management ICs - Year-over-year growth 2025-2030 (%)

8.7 Market opportunity by Product Type

Market opportunity by Product Type ($ million)
Data Table on Market opportunity by Product Type ($ million)

9. Market Segmentation by Application

9.1 Market segments

Chart on Application - Market share 2025-2030 (%)
Data Table on Application - Market share 2025-2030 (%)

9.2 Comparison by Application

Chart on Comparison by Application
Data Table on Comparison by Application

9.3 EV battery and lighting - Market size and forecast 2025-2030

Chart on EV battery and lighting - Market size and forecast 2025-2030 ($ million)
Data Table on EV battery and lighting - Market size and forecast 2025-2030 ($ million)
Chart on EV battery and lighting - Year-over-year growth 2025-2030 (%)
Data Table on EV battery and lighting - Year-over-year growth 2025-2030 (%)

9.4 Powertrain systems - Market size and forecast 2025-2030

Chart on Powertrain systems - Market size and forecast 2025-2030 ($ million)
Data Table on Powertrain systems - Market size and forecast 2025-2030 ($ million)
Chart on Powertrain systems - Year-over-year growth 2025-2030 (%)
Data Table on Powertrain systems - Year-over-year growth 2025-2030 (%)

9.5 ADAS and safety systems - Market size and forecast 2025-2030

Chart on ADAS and safety systems - Market size and forecast 2025-2030 ($ million)
Data Table on ADAS and safety systems - Market size and forecast 2025-2030 ($ million)
Chart on ADAS and safety systems - Year-over-year growth 2025-2030 (%)
Data Table on ADAS and safety systems - Year-over-year growth 2025-2030 (%)

9.6 Body electronics - Market size and forecast 2025-2030

Chart on Body electronics - Market size and forecast 2025-2030 ($ million)
Data Table on Body electronics - Market size and forecast 2025-2030 ($ million)
Chart on Body electronics - Year-over-year growth 2025-2030 (%)
Data Table on Body electronics - Year-over-year growth 2025-2030 (%)

9.7 Infotainment systems - Market size and forecast 2025-2030

Chart on Infotainment systems - Market size and forecast 2025-2030 ($ million)
Data Table on Infotainment systems - Market size and forecast 2025-2030 ($ million)
Chart on Infotainment systems - Year-over-year growth 2025-2030 (%)
Data Table on Infotainment systems - Year-over-year growth 2025-2030 (%)

9.8 Market opportunity by Application

Market opportunity by Application ($ million)
Data Table on Market opportunity by Application ($ million)

10. Market Segmentation by Vehicle Type

10.1 Market segments

Chart on Vehicle Type - Market share 2025-2030 (%)
Data Table on Vehicle Type - Market share 2025-2030 (%)

10.2 Comparison by Vehicle Type

Chart on Comparison by Vehicle Type
Data Table on Comparison by Vehicle Type

10.3 Passenger cars - Market size and forecast 2025-2030

Chart on Passenger cars - Market size and forecast 2025-2030 ($ million)
Data Table on Passenger cars - Market size and forecast 2025-2030 ($ million)
Chart on Passenger cars - Year-over-year growth 2025-2030 (%)
Data Table on Passenger cars - Year-over-year growth 2025-2030 (%)

10.4 Commercial vehicles - Market size and forecast 2025-2030

Chart on Commercial vehicles - Market size and forecast 2025-2030 ($ million)
Data Table on Commercial vehicles - Market size and forecast 2025-2030 ($ million)
Chart on Commercial vehicles - Year-over-year growth 2025-2030 (%)
Data Table on Commercial vehicles - Year-over-year growth 2025-2030 (%)

10.5 Market opportunity by Vehicle Type

Market opportunity by Vehicle Type ($ million)
Data Table on Market opportunity by Vehicle Type ($ million)

11. Customer Landscape

11.1 Customer landscape overview

Analysis of price sensitivity, lifecycle, customer purchase basket, adoption rates, and purchase criteria

12. Geographic Landscape

12.1 Geographic segmentation

Chart on Market share by geography 2025-2030 (%)
Data Table on Market share by geography 2025-2030 (%)

12.2 Geographic comparison

Chart on Geographic comparison
Data Table on Geographic comparison

12.3 APAC - Market size and forecast 2025-2030

Chart on APAC - Market size and forecast 2025-2030 ($ million)
Data Table on APAC - Market size and forecast 2025-2030 ($ million)
Chart on APAC - Year-over-year growth 2025-2030 (%)
Data Table on APAC - Year-over-year growth 2025-2030 (%)
Chart on Regional Comparison - APAC
Data Table on Regional Comparison - APAC

12.3.1 China - Market size and forecast 2025-2030

Chart on China - Market size and forecast 2025-2030 ($ million)
Data Table on China - Market size and forecast 2025-2030 ($ million)
Chart on China - Year-over-year growth 2025-2030 (%)
Data Table on China - Year-over-year growth 2025-2030 (%)

12.3.2 Japan - Market size and forecast 2025-2030

Chart on Japan - Market size and forecast 2025-2030 ($ million)
Data Table on Japan - Market size and forecast 2025-2030 ($ million)
Chart on Japan - Year-over-year growth 2025-2030 (%)
Data Table on Japan - Year-over-year growth 2025-2030 (%)

12.3.3 India - Market size and forecast 2025-2030

Chart on India - Market size and forecast 2025-2030 ($ million)
Data Table on India - Market size and forecast 2025-2030 ($ million)
Chart on India - Year-over-year growth 2025-2030 (%)
Data Table on India - Year-over-year growth 2025-2030 (%)

12.3.4 South Korea - Market size and forecast 2025-2030

Chart on South Korea - Market size and forecast 2025-2030 ($ million)
Data Table on South Korea - Market size and forecast 2025-2030 ($ million)
Chart on South Korea - Year-over-year growth 2025-2030 (%)
Data Table on South Korea - Year-over-year growth 2025-2030 (%)

12.3.5 Indonesia - Market size and forecast 2025-2030

Chart on Indonesia - Market size and forecast 2025-2030 ($ million)
Data Table on Indonesia - Market size and forecast 2025-2030 ($ million)
Chart on Indonesia - Year-over-year growth 2025-2030 (%)
Data Table on Indonesia - Year-over-year growth 2025-2030 (%)

12.3.6 Australia - Market size and forecast 2025-2030

Chart on Australia - Market size and forecast 2025-2030 ($ million)
Data Table on Australia - Market size and forecast 2025-2030 ($ million)
Chart on Australia - Year-over-year growth 2025-2030 (%)
Data Table on Australia - Year-over-year growth 2025-2030 (%)

12.4 Europe - Market size and forecast 2025-2030

Chart on Europe - Market size and forecast 2025-2030 ($ million)
Data Table on Europe - Market size and forecast 2025-2030 ($ million)
Chart on Europe - Year-over-year growth 2025-2030 (%)
Data Table on Europe - Year-over-year growth 2025-2030 (%)
Chart on Regional Comparison - Europe
Data Table on Regional Comparison - Europe

12.4.1 UK - Market size and forecast 2025-2030

Chart on UK - Market size and forecast 2025-2030 ($ million)
Data Table on UK - Market size and forecast 2025-2030 ($ million)
Chart on UK - Year-over-year growth 2025-2030 (%)
Data Table on UK - Year-over-year growth 2025-2030 (%)

12.4.2 Germany - Market size and forecast 2025-2030

Chart on Germany - Market size and forecast 2025-2030 ($ million)
Data Table on Germany - Market size and forecast 2025-2030 ($ million)
Chart on Germany - Year-over-year growth 2025-2030 (%)
Data Table on Germany - Year-over-year growth 2025-2030 (%)

12.4.3 France - Market size and forecast 2025-2030

Chart on France - Market size and forecast 2025-2030 ($ million)
Data Table on France - Market size and forecast 2025-2030 ($ million)
Chart on France - Year-over-year growth 2025-2030 (%)
Data Table on France - Year-over-year growth 2025-2030 (%)

12.4.4 Spain - Market size and forecast 2025-2030

Chart on Spain - Market size and forecast 2025-2030 ($ million)
Data Table on Spain - Market size and forecast 2025-2030 ($ million)
Chart on Spain - Year-over-year growth 2025-2030 (%)
Data Table on Spain - Year-over-year growth 2025-2030 (%)

12.4.5 Italy - Market size and forecast 2025-2030

Chart on Italy - Market size and forecast 2025-2030 ($ million)
Data Table on Italy - Market size and forecast 2025-2030 ($ million)
Chart on Italy - Year-over-year growth 2025-2030 (%)
Data Table on Italy - Year-over-year growth 2025-2030 (%)

12.4.6 The Netherlands - Market size and forecast 2025-2030

Chart on The Netherlands - Market size and forecast 2025-2030 ($ million)
Data Table on The Netherlands - Market size and forecast 2025-2030 ($ million)
Chart on The Netherlands - Year-over-year growth 2025-2030 (%)
Data Table on The Netherlands - Year-over-year growth 2025-2030 (%)

12.5 North America - Market size and forecast 2025-2030

Chart on North America - Market size and forecast 2025-2030 ($ million)
Data Table on North America - Market size and forecast 2025-2030 ($ million)
Chart on North America - Year-over-year growth 2025-2030 (%)
Data Table on North America - Year-over-year growth 2025-2030 (%)
Chart on Regional Comparison - North America
Data Table on Regional Comparison - North America

12.5.1 US - Market size and forecast 2025-2030

Chart on US - Market size and forecast 2025-2030 ($ million)
Data Table on US - Market size and forecast 2025-2030 ($ million)
Chart on US - Year-over-year growth 2025-2030 (%)
Data Table on US - Year-over-year growth 2025-2030 (%)

12.5.2 Mexico - Market size and forecast 2025-2030

Chart on Mexico - Market size and forecast 2025-2030 ($ million)
Data Table on Mexico - Market size and forecast 2025-2030 ($ million)
Chart on Mexico - Year-over-year growth 2025-2030 (%)
Data Table on Mexico - Year-over-year growth 2025-2030 (%)

12.5.3 Canada - Market size and forecast 2025-2030

Chart on Canada - Market size and forecast 2025-2030 ($ million)
Data Table on Canada - Market size and forecast 2025-2030 ($ million)
Chart on Canada - Year-over-year growth 2025-2030 (%)
Data Table on Canada - Year-over-year growth 2025-2030 (%)

12.6 South America - Market size and forecast 2025-2030

Chart on South America - Market size and forecast 2025-2030 ($ million)
Data Table on South America - Market size and forecast 2025-2030 ($ million)
Chart on South America - Year-over-year growth 2025-2030 (%)
Data Table on South America - Year-over-year growth 2025-2030 (%)
Chart on Regional Comparison - South America
Data Table on Regional Comparison - South America

12.6.1 Brazil - Market size and forecast 2025-2030

Chart on Brazil - Market size and forecast 2025-2030 ($ million)
Data Table on Brazil - Market size and forecast 2025-2030 ($ million)
Chart on Brazil - Year-over-year growth 2025-2030 (%)
Data Table on Brazil - Year-over-year growth 2025-2030 (%)

12.6.2 Argentina - Market size and forecast 2025-2030

Chart on Argentina - Market size and forecast 2025-2030 ($ million)
Data Table on Argentina - Market size and forecast 2025-2030 ($ million)
Chart on Argentina - Year-over-year growth 2025-2030 (%)
Data Table on Argentina - Year-over-year growth 2025-2030 (%)

12.6.3 Colombia - Market size and forecast 2025-2030

Chart on Colombia - Market size and forecast 2025-2030 ($ million)
Data Table on Colombia - Market size and forecast 2025-2030 ($ million)
Chart on Colombia - Year-over-year growth 2025-2030 (%)
Data Table on Colombia - Year-over-year growth 2025-2030 (%)

12.7 Middle East and Africa - Market size and forecast 2025-2030

Chart on Middle East and Africa - Market size and forecast 2025-2030 ($ million)
Data Table on Middle East and Africa - Market size and forecast 2025-2030 ($ million)
Chart on Middle East and Africa - Year-over-year growth 2025-2030 (%)
Data Table on Middle East and Africa - Year-over-year growth 2025-2030 (%)
Chart on Regional Comparison - Middle East and Africa
Data Table on Regional Comparison - Middle East and Africa

12.7.1 Saudi Arabia - Market size and forecast 2025-2030

Chart on Saudi Arabia - Market size and forecast 2025-2030 ($ million)
Data Table on Saudi Arabia - Market size and forecast 2025-2030 ($ million)
Chart on Saudi Arabia - Year-over-year growth 2025-2030 (%)
Data Table on Saudi Arabia - Year-over-year growth 2025-2030 (%)

12.7.2 South Africa - Market size and forecast 2025-2030

Chart on South Africa - Market size and forecast 2025-2030 ($ million)
Data Table on South Africa - Market size and forecast 2025-2030 ($ million)
Chart on South Africa - Year-over-year growth 2025-2030 (%)
Data Table on South Africa - Year-over-year growth 2025-2030 (%)

12.7.3 Israel - Market size and forecast 2025-2030

Chart on Israel - Market size and forecast 2025-2030 ($ million)
Data Table on Israel - Market size and forecast 2025-2030 ($ million)
Chart on Israel - Year-over-year growth 2025-2030 (%)
Data Table on Israel - Year-over-year growth 2025-2030 (%)

12.7.4 Turkey - Market size and forecast 2025-2030

Chart on Turkey - Market size and forecast 2025-2030 ($ million)
Data Table on Turkey - Market size and forecast 2025-2030 ($ million)
Chart on Turkey - Year-over-year growth 2025-2030 (%)
Data Table on Turkey - Year-over-year growth 2025-2030 (%)

12.7.5 UAE - Market size and forecast 2025-2030

Chart on UAE - Market size and forecast 2025-2030 ($ million)
Data Table on UAE - Market size and forecast 2025-2030 ($ million)
Chart on UAE - Year-over-year growth 2025-2030 (%)
Data Table on UAE - Year-over-year growth 2025-2030 (%)

12.8 Market opportunity by geography

Market opportunity by geography ($ million)
Data Tables on Market opportunity by geography ($ million)

13. Drivers, Challenges, and Opportunity

13.1 Market drivers

Accelerating adoption of EVs and high voltage powertrain electrification
Proliferation of ADAS and autonomous driving functionalities
Transition toward zonal electrical architectures and decentralized power distribution

13.2 Market challenges

Thermal management constraints and extreme operational temperature environments
Complex qualification standards and protracted product development cycles
Supply chain volatility and high capital costs of advanced semiconductor fabrication

13.3 Impact of drivers and challenges

Impact of drivers and challenges in 2025 and 2030

13.4 Market opportunities

Rapid expansion of smart cockpit and digital in-vehicle infotainment systems
Rising adoption of vehicle-to-everything communication and telematics units
Increasing integration of functional safety compliant PMICs

14. Competitive Landscape

14.1 Overview

14.2

Overview on criticality of inputs and factors of differentiation

14.3 Landscape disruption

Overview on factors of disruption

14.4 Industry risks

Impact of key risks on business

15. Competitive Analysis

15.1 Companies profiled

Companies covered

15.2 Company ranking index

15.3 Market positioning of companies

Matrix on companies position and classification

15.4 ams OSRAM AG

ams OSRAM AG - Overview
ams OSRAM AG - Business segments
ams OSRAM AG - Key news
ams OSRAM AG - Key offerings
ams OSRAM AG - Segment focus
SWOT

15.5 Analog Devices Inc.

Analog Devices Inc. - Overview
Analog Devices Inc. - Business segments
Analog Devices Inc. - Key offerings
Analog Devices Inc. - Segment focus
SWOT

15.6 Infineon Technologies AG

Infineon Technologies AG - Overview
Infineon Technologies AG - Business segments
Infineon Technologies AG - Key news
Infineon Technologies AG - Key offerings
Infineon Technologies AG - Segment focus
SWOT

15.7 Littelfuse Inc.

Littelfuse Inc. - Overview
Littelfuse Inc. - Business segments
Littelfuse Inc. - Key news
Littelfuse Inc. - Key offerings
Littelfuse Inc. - Segment focus
SWOT

15.8 Microchip Technology Inc.

Microchip Technology Inc. - Overview
Microchip Technology Inc. - Business segments
Microchip Technology Inc. - Key offerings
Microchip Technology Inc. - Segment focus
SWOT

15.9 Monolithic Power Systems Inc.

Monolithic Power Systems Inc. - Overview
Monolithic Power Systems Inc. - Product / Service
Monolithic Power Systems Inc. - Key news
Monolithic Power Systems Inc. - Key offerings
SWOT

15.10 NXP Semiconductors NV

NXP Semiconductors NV - Overview
NXP Semiconductors NV - Business segments
NXP Semiconductors NV - Key news
NXP Semiconductors NV - Key offerings
NXP Semiconductors NV - Segment focus
SWOT

15.11 ON Semiconductor Corp.

ON Semiconductor Corp. - Overview
ON Semiconductor Corp. - Business segments
ON Semiconductor Corp. - Key news
ON Semiconductor Corp. - Key offerings
ON Semiconductor Corp. - Segment focus
SWOT

15.12 Renesas Electronics Corp.

Renesas Electronics Corp. - Overview
Renesas Electronics Corp. - Business segments
Renesas Electronics Corp. - Key news
Renesas Electronics Corp. - Key offerings
Renesas Electronics Corp. - Segment focus
SWOT

15.13 ROHM Co. Ltd.

ROHM Co. Ltd. - Overview
ROHM Co. Ltd. - Business segments
ROHM Co. Ltd. - Key news
ROHM Co. Ltd. - Key offerings
ROHM Co. Ltd. - Segment focus
SWOT

15.14 Samsung Electronics Co. Ltd.

Samsung Electronics Co. Ltd. - Overview
Samsung Electronics Co. Ltd. - Business segments
Samsung Electronics Co. Ltd. - Key news
Samsung Electronics Co. Ltd. - Key offerings
Samsung Electronics Co. Ltd. - Segment focus
SWOT

15.15 Skyworks Solutions Inc.

Skyworks Solutions Inc. - Overview
Skyworks Solutions Inc. - Product / Service
Skyworks Solutions Inc. - Key news
Skyworks Solutions Inc. - Key offerings
SWOT

15.16 STMicroelectronics NV

STMicroelectronics NV - Overview
STMicroelectronics NV - Business segments
STMicroelectronics NV - Key news
STMicroelectronics NV - Key offerings
STMicroelectronics NV - Segment focus
SWOT

15.17 Toshiba Corp.

Toshiba Corp. - Overview
Toshiba Corp. - Business segments
Toshiba Corp. - Key offerings
Toshiba Corp. - Segment focus
SWOT

15.18 Vishay Intertechnology Inc.

Vishay Intertechnology Inc. - Overview
Vishay Intertechnology Inc. - Business segments
Vishay Intertechnology Inc. - Key news
Vishay Intertechnology Inc. - Key offerings
Vishay Intertechnology Inc. - Segment focus
SWOT

16. Appendix

16.1 Scope of the report

Market definition
Objectives
Notes and caveats

16.2 Inclusions and exclusions checklist

Inclusions checklist
Exclusions checklist

16.3 Currency conversion rates for US$

16.4 Research methodology

16.5 Data procurement

Information sources

16.6 Data validation

16.7 Validation techniques employed for market sizing

16.8 Data synthesis

16.9 360 degree market analysis

16.10 List of abbreviations

Research Methodology

Technavio presents a detailed picture of the market by way of study, synthesis, and summation of data from multiple sources. The analysts have presented the various facets of the market with a particular focus on identifying the key industry influencers. The data thus presented is comprehensive, reliable, and the result of extensive research, both primary and secondary.

INFORMATION SOURCES

Primary sources

  • Manufacturers and suppliers
  • Channel partners
  • Industry experts
  • Strategic decision makers

Secondary sources

  • Industry journals and periodicals
  • Government data
  • Financial reports of key industry players
  • Historical data
  • Press releases

DATA ANALYSIS

Data Synthesis

  • Collation of data
  • Estimation of key figures
  • Analysis of derived insights

Data Validation

  • Triangulation with data models
  • Reference against proprietary databases
  • Corroboration with industry experts

REPORT WRITING

Qualitative

  • Market drivers
  • Market challenges
  • Market trends
  • Five forces analysis

Quantitative

  • Market size and forecast
  • Market segmentation
  • Geographical insights
  • Competitive landscape

Interested in this report?

Get your sample now to see our research methodology and insights!

Download Now

Frequently Asked Questions

Automotive Power Management Ic market growth will increase by USD 5038.5 million during 2026-2030.

The Automotive Power Management Ic market is expected to grow at a CAGR of 12.4% during 2026-2030.

Automotive Power Management Ic market is segmented by Product type (Voltage regulators, Integrated PMICs, Power switches and load switches, Battery management ICs) Application (EV battery and lighting, Powertrain systems, ADAS and safety systems, Body electronics, Infotainment systems) Vehicle type (Passenger cars, Commercial vehicles)

ABLIC Inc., Alpha and Omega Semiconductor, ams OSRAM AG, Analog Devices Inc., Diodes Inc., Infineon Technologies AG, Littelfuse Inc., Microchip Technology Inc., Monolithic Power Systems Inc., Nisshinbo Micro Devices Inc., NXP Semiconductors NV, ON Semiconductor Corp., Power Integrations Inc., Renesas Electronics Corp., ROHM Co. Ltd., Samsung Electronics Co. Ltd., Skyworks Solutions Inc., STMicroelectronics NV, Toshiba Corp., Vishay Intertechnology Inc. are a few of the key vendors in the Automotive Power Management Ic market.

APAC will register the highest growth rate of 57% among the other regions. Therefore, the Automotive Power Management Ic market in APAC is expected to garner significant business opportunities for the vendors during the forecast period.

China, Japan, India, South Korea, Indonesia, Australia, UK, Germany, France, Spain, Italy, The Netherlands, US, Mexico, Canada, Brazil, Argentina, Colombia, Saudi Arabia, South Africa, Israel, Turkey, UAE

  • Accelerating adoption of EVs and high voltage powertrain electrification is the driving factor this market.

The Automotive Power Management Ic market vendors should focus on grabbing business opportunities from the Product type segment as it accounted for the largest market share in the base year.
RIA - Research AI Assistant
Ask RIA
