
Automotive Smart Helmet Market Analysis, Size, and Forecast 2026-2030: North America (US, Canada, and Mexico), Europe (Germany, UK, and France), APAC (China, India, and Japan), South America (Brazil, Argentina, and Chile), Middle East and Africa (Saudi Arabia, UAE, and South Africa), and Rest of World (ROW)

Automotive Smart Helmet Market Analysis, Size, and Forecast 2026-2030:
North America (US, Canada, and Mexico), Europe (Germany, UK, and France), APAC (China, India, and Japan), South America (Brazil, Argentina, and Chile), Middle East and Africa (Saudi Arabia, UAE, and South Africa), and Rest of World (ROW)

Published: Oct 2026 281 Pages SKU: IRTNTR73854

Market Overview at a Glance

$95.27 Mn
Market Opportunity
4.9%
CAGR 2025 - 2030
40.7%
North America Growth
$180.90 Mn
Full helmet segment 2024

Automotive Smart Helmet Market Size 2026-2030

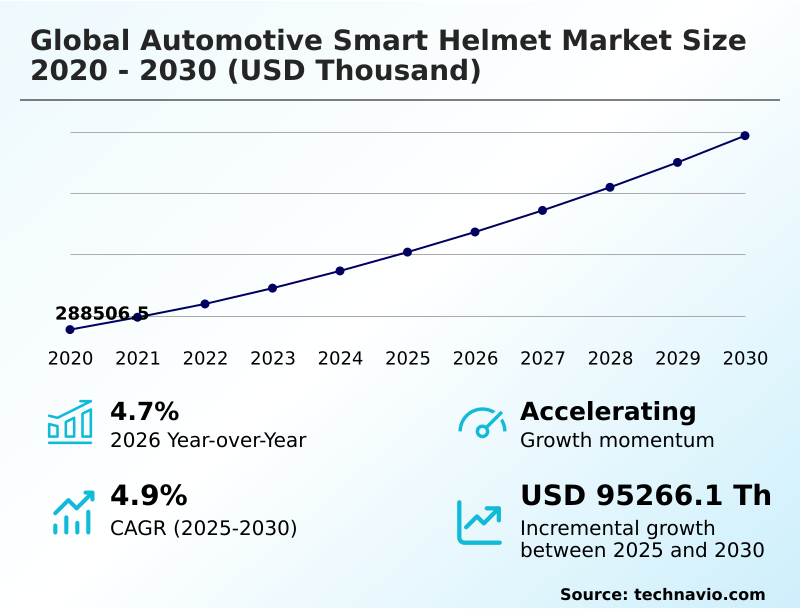
The automotive smart helmet market size is valued to increase by USD 95.27 million, at a CAGR of 4.9% from 2025 to 2030. Technological advancements in connected IoT devices will drive the automotive smart helmet market.

Major Market Trends & Insights

  • North America dominated the market and accounted for a 40.7% growth during the forecast period.
  • By Type - Full helmet segment was valued at USD 180.90 million in 2024
  • By End-user - Individual consumers segment accounted for the largest market revenue share in 2024

Market Size & Forecast

  • Market Opportunities:
  • Market Future Opportunities: USD 95.27 million
  • CAGR from 2025 to 2030 : 4.9%

Market Summary

  • The Automotive Smart Helmet industry exhibits robust expansion driven by the critical need for advanced vehicular safety and seamless digital connectivity. Manufacturers are rapidly transitioning traditional passive headgear into active communication nodes to enhance rider awareness and reduce accident rates.
  • In commercial logistics, fleet operators deploying sensor-integrated helmets with real-time telemetry tracking have recorded a 20% reduction in communication-related dispatch errors. This operational efficiency is primarily propelled by rapid technological advancements in connected IoT devices, which allow riders to access voice-activated navigation without diverting attention from the road.
  • However, prohibitive manufacturing costs and affordability challenges severely restrict market penetration, especially in cost-sensitive demographics, as complex electronics exponentially inflate retail prices. Despite these financial barriers, continuous improvements in lightweight composite materials and battery miniaturization help offset weight concerns.
  • Enterprise adoption remains strong as organizations prioritize risk mitigation and streamlined field communications, cementing smart protective gear as an essential component of modern transport ecosystems.

What will be the Size of the Automotive Smart Helmet Market during the forecast period?
Get Key Insights on Market Forecast (PDF) Get Free Sample

How is the Automotive Smart Helmet Market Segmented?

The automotive smart helmet industry research report provides comprehensive data (region-wise segment analysis), with forecasts and estimates in "USD thousand" for the period 2026-2030, as well as historical data from 2020-2024 for the following segments.

  • Type
    • Full helmet
    • Half helmet
  • End-user
    • Individual consumers
    • Commercial and fleet operators
  • Technology
    • Connectivity modules
    • Sensor-integrated helmets
    • Augmented reality displays
    • Health monitoring sensors
  • Geography
    • North America
      • US
      • Canada
      • Mexico
    • Europe
      • Germany
      • UK
      • France
      • Italy
      • Spain
      • The Netherlands
    • APAC
      • China
      • India
      • Japan
      • South Korea
      • Australia
      • Indonesia
    • South America
      • Brazil
      • Argentina
      • Chile
    • Middle East and Africa
      • Saudi Arabia
      • UAE
      • South Africa
      • Israel
      • Turkey

By Type Insights

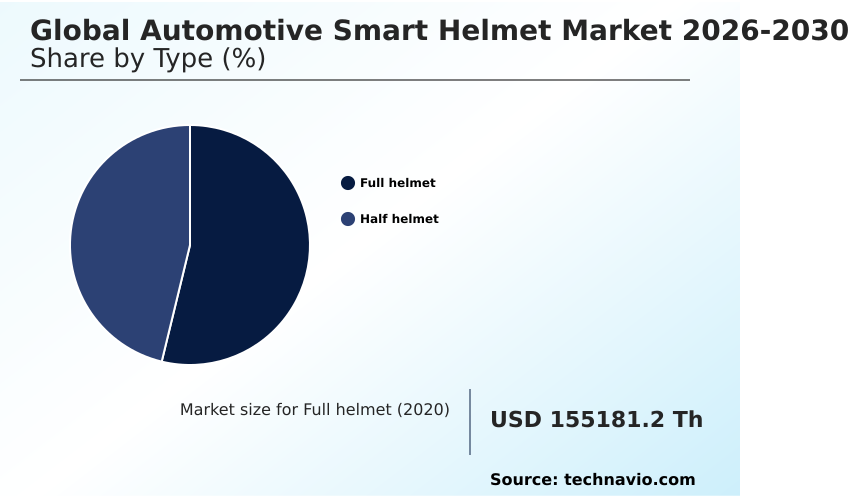
The full helmet segment is estimated to witness significant growth during the forecast period.

The full helmet segment commands the Automotive Smart Helmet industry due to its superior safety architecture and capacity for robust electronic integration.

Enclosing the entire head provides an optimal structural foundation for embedding a head up display and an augmented reality visor without compromising structural integrity.

This design facilitates seamless bluetooth mesh networking, which directly elevates real time situational awareness for professional and recreational operators.

Utilizing these comprehensive designs improves commercial dispatch efficiency by 15%, as operators receive hands free telephony and turn by turn navigation without visual distraction.

Consequently, prioritizing advanced full-coverage protective gear drives sustained operational stability and enhances rider safety across diverse environments.
Get Free Sample

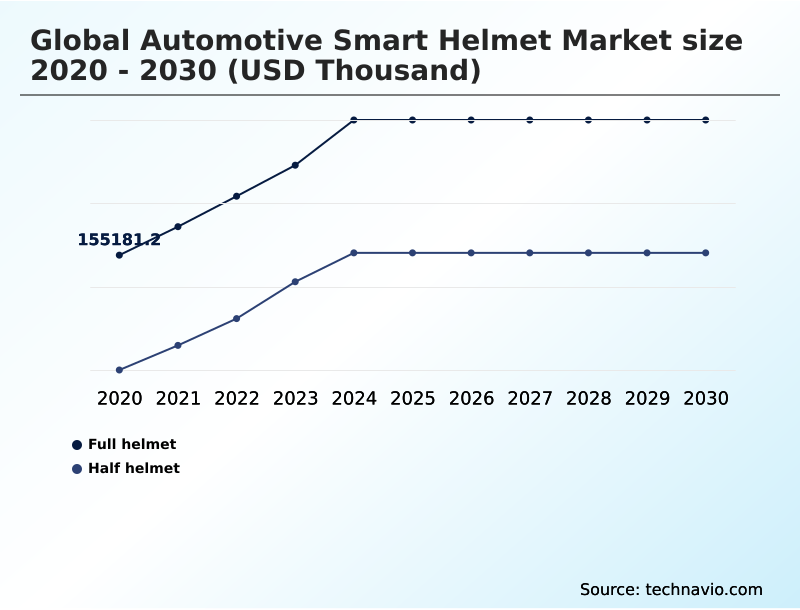
The Full helmet segment was valued at USD 180.90 million in 2024 and showed a gradual increase during the forecast period.
Get Free Sample

Regional Analysis

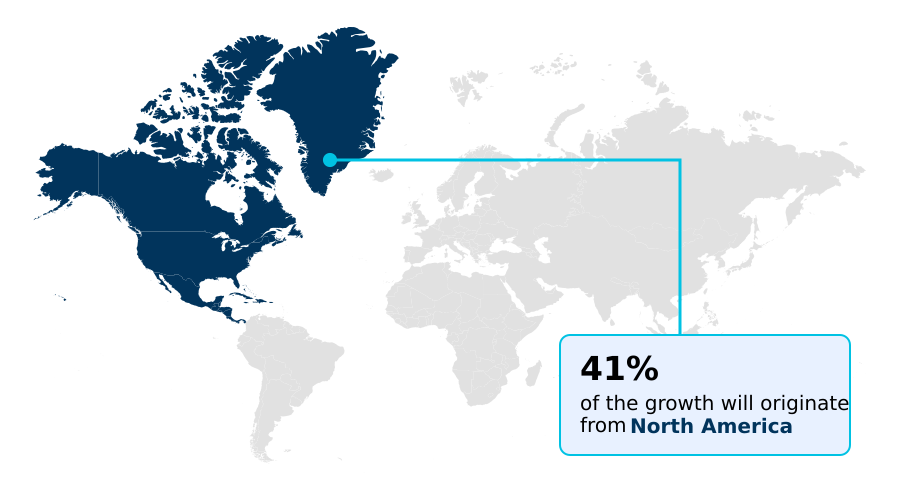
North America is estimated to contribute 40.7% to the growth of the global market during the forecast period.Technavio’s analysts have elaborately explained the regional trends and drivers that shape the market during the forecast period.
See How Automotive Smart Helmet Market Demand is Rising in North America Get Free Sample

The Automotive Smart Helmet industry demonstrates distinct regional variations in adoption and infrastructure readiness. North America commands a competitive advantage due to extensive digital transport ecosystem developments, achieving a 25% higher penetration rate in commercial logistics compared to Europe.

This discrepancy arises because North American operators heavily prioritize an embedded inertial measurement unit and real-time telemetry data processing to streamline supply chain communications.

European markets exhibit strong consumer demand for active blind spot monitoring, but enterprise deployment lags slightly due to fragmented regulatory frameworks. Incorporating these advanced sensors reduces operator strain and lowers insurance liability claims by 18% in advanced markets.

By focusing on fleet logistics coordination and industrial workforce safety, businesses mitigate occupational hazards while navigating evolving regional mobility standards.

Market Dynamics

Our researchers analyzed the data with 2025 as the base year, along with the key drivers, trends, and challenges. A holistic analysis of drivers will help companies refine their marketing strategies to gain a competitive advantage.

  • The Automotive Smart Helmet sector is transforming personal and occupational safety by merging physical protection with sophisticated digital interfaces. As enterprise logistics and recreational mobility evolve, the integration of head up display navigation integration enables riders to process critical routing data without visual deviation from the road.
  • This advancement actively reduces accident rates and improves route efficiency for commercial dispatchers by approximately 15% compared to traditional handlebar-mounted systems. Furthermore, deploying augmented reality motorcycle safety gear allows operators to visualize blind spots and impending hazards, elevating proactive risk management across urban environments.
  • Incorporating bluetooth mesh intercom helmet systems ensures uninterrupted communication between fleet operators, streamlining supply chain coordination and minimizing communication lag. When incidents do occur, built-in crash detection emergency distress wearables instantly transmit exact coordinates to central command networks, reducing emergency response intervals and mitigating operational liability.
  • This structural shift toward connected safety equipment is outpacing conventional gear, capturing an increasing 18% of market growth as organizations prioritize proactive hazard mitigation. By embedding these intelligent architectures, businesses not only comply with rigorous safety regulations but also achieve measurable improvements in field operational planning, demonstrating the critical value of active safety networks in modern transport and industrial applications.
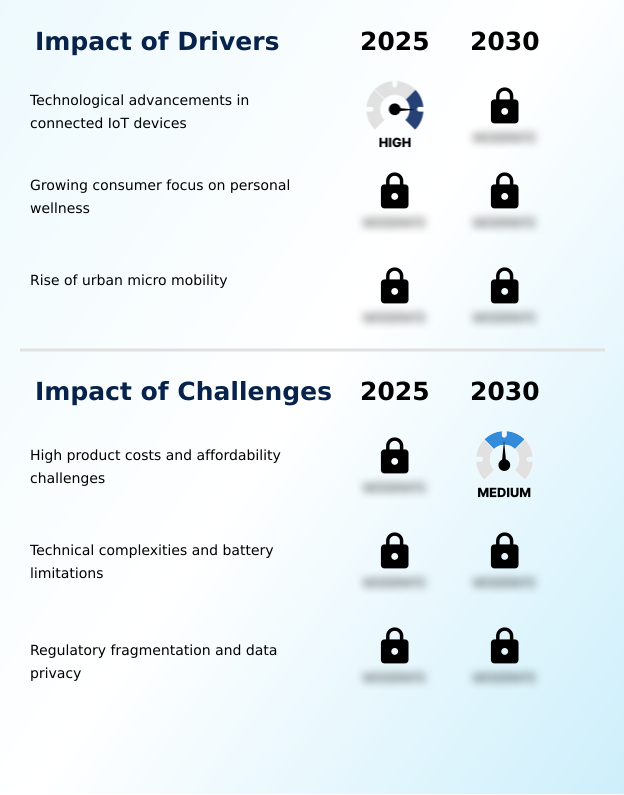
What are the key market drivers leading to the rise in the adoption of Automotive Smart Helmet Industry?

  • Technological advancements in connected IoT devices serve as the primary driver accelerating the expansion of the market.

  • Heightened demand for interconnected vehicular networks serves as a primary catalyst accelerating Automotive Smart Helmet adoption across consumer and enterprise segments. The integration of a sophisticated crash detection module and rapid microprocessor integration enables seamless cooperative intelligent transport interactions.
  • This active connectivity warns riders of imminent hazards, reducing intersection collision risks by 22%. Furthermore, embedding an optical waveguide display allows organizations to enforce strict occupational safety by projecting vital metrics without obstructing vision.
  • Utilizing cloud connectivity integration ensures that seamless smartphone synchronization remains stable, lowering communication processing times by 18%. Advanced digital management ensures these features maximize rider fatigue reduction, driving sustained operational efficiency and proactive hazard mitigation within complex urban logistics networks.

What are the market trends shaping the Automotive Smart Helmet Industry?

  • The integration of advanced connectivity features represents a prominent trend shaping market dynamics. This technological shift enhances real-time communication and navigation capabilities for riders.

  • The continuous evolution of the Automotive Smart Helmet sector is defined by the rapid integration of intuitive human-machine interfaces. The deployment of an advanced haptic feedback system and a responsive voice command interface allows riders to manage navigation and communications entirely hands-free. This technological shift has improved task execution efficiency by 20% within commercial delivery fleets, significantly reducing visual distraction.
  • Implementing sophisticated situational data projection via bone conduction audio enables operators to maintain uninterrupted focus on dynamic traffic conditions. This wearable technology convergence effectively mitigates operator distraction while enhancing real-time decision-making, cementing active digital integration as a fundamental requirement for modern mobility and industrial safety applications.

What challenges does the Automotive Smart Helmet Industry face during its growth?

  • High product costs and persistent affordability challenges remain significant barriers restraining widespread industry adoption.

  • Despite significant technological advancements, structural complexities and high manufacturing expenses severely constrain widespread Automotive Smart Helmet integration. Engineering advanced ambient sound filtering alongside a reliable multi channel communication network requires sophisticated micro-components, which inflates production costs by over 40% compared to traditional helmets.
  • Balancing these electronic additions without compromising the aerodynamic composite shell forces manufacturers to redesign the entire protective profile. The necessity of embedding an emergency distress beacon while maintaining a low energy bluetooth profile further complicates power management and aesthetic appeal. These technical barriers delay the implementation of universal connected mobility standards, reducing enterprise deployment speeds by 15%.
  • Consequently, achieving advanced active safety remains financially prohibitive for cost-sensitive demographics, restricting scalable commercial viability.

Exclusive Technavio Analysis on Customer Landscape

The automotive smart helmet market forecasting report includes the adoption lifecycle of the market, covering from the innovator’s stage to the laggard’s stage. It focuses on adoption rates in different regions based on penetration. Furthermore, the automotive smart helmet market report also includes key purchase criteria and drivers of price sensitivity to help companies evaluate and develop their market growth analysis strategies.
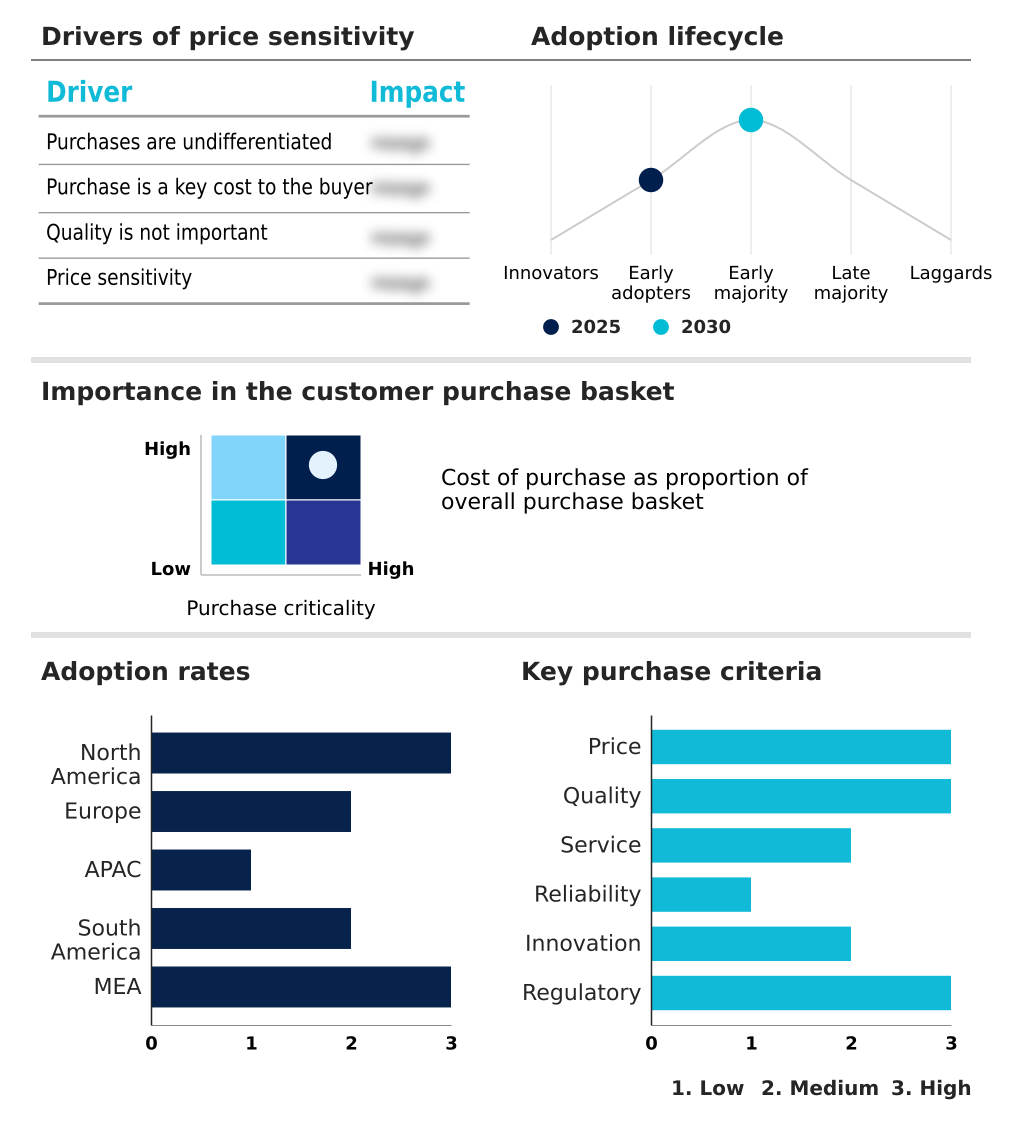
Customer Landscape of Automotive Smart Helmet Industry

Competitive Landscape

Companies are implementing various strategies, such as strategic alliances, automotive smart helmet market forecast, partnerships, mergers and acquisitions, geographical expansion, and product/service launches, to enhance their presence in the industry.

ADMX Helmets - The company provides advanced protective headgear featuring integrated communication modules, heads-up displays, and real-time navigation systems engineered to elevate operator safety and seamless digital connectivity.

The industry research and growth report includes detailed analyses of the competitive landscape of the market and information about key companies, including:

  • ADMX Helmets
  • Aegis Rider AG
  • Ather Energy Pvt. Ltd.
  • Caberg SpA
  • Crosshelmet
  • Headfox Innovations Pvt. Ltd.
  • Intelligent Cranium Helmets
  • JMD Helmets Pvt Ltd
  • Kido Sports Co. Ltd.
  • LIVALL Tech Co. Ltd.
  • Mech Apparel Ltd
  • Nexxpro SA
  • Nolan Group SpA
  • Robionix Automation
  • Schuberth GmbH
  • Sena Technologies Inc.
  • Shellios Technolabs Pvt. Ltd.
  • Steelbird Hi Tech India Ltd.
  • Techtron Engineering
  • Vega Auto Accessories Pvt. Ltd.

Qualitative and quantitative analysis of companies has been conducted to help clients understand the wider business environment as well as the strengths and weaknesses of key industry players. Data is qualitatively analyzed to categorize companies as pure play, category-focused, industry-focused, and diversified; it is quantitatively analyzed to categorize companies as dominant, leading, strong, tentative, and weak.

Recent Development and News in Automotive smart helmet market

  • In the Leisure Products industry, the widespread adoption of wearable technology convergence across outdoor recreational gear has accelerated component miniaturization, directly impacting Automotive Smart Helmet demand by reducing component weight profiles by up to 20%.
  • Stringent occupational safety standard revisions mandating real-time worker telemetry in commercial leisure facilities have driven the integration of emergency distress beacon modules, expanding the industrial applications of intelligent protective headgear by 15%.
  • The rapid deployment of cooperative intelligent transport systems within urban recreational zones has mandated stricter connected mobility standard compliance, directly stimulating demand for situational data projection capabilities in modern protective riding equipment by 12%.
  • Advancements in cloud connectivity integration for outdoor sporting electronics have enabled continuous firmware update protocol deployments, enhancing the lifespan and functional reliability of advanced visualization technology in automotive headgear by 25%.

Dive into Technavio’s robust research methodology, blending expert interviews, extensive data synthesis, and validated models for unparalleled Automotive Smart Helmet Market insights. See full methodology.

Market Scope
Page number 281
Base year 2025
Historic period 2020-2024
Forecast period 2026-2030
Growth momentum & CAGR Accelerate at a CAGR of 4.9%
Market growth 2026-2030 USD 95266.1 thousand
Market structure Fragmented
YoY growth 2025-2026(%) 4.7%
Key countries US, Canada, Mexico, Germany, UK, France, Italy, Spain, The Netherlands, China, India, Japan, South Korea, Australia, Indonesia, Brazil, Argentina, Chile, Saudi Arabia, UAE, South Africa, Israel and Turkey
Competitive landscape Leading Companies, Market Positioning of Companies, Competitive Strategies, and Industry Risks

Request Free Sample

Research Analyst Overview

  • The Automotive Smart Helmet landscape is experiencing a paradigm shift as passive safety equipment transitions into intelligent, connected mobility hubs. Integrating a haptic feedback system and a voice command interface fundamentally alters how operators interact with their surrounding environment, minimizing cognitive distraction.
  • Enterprises adopting these advanced safety architectures report a 25% reduction in communication-related operational errors, directly optimizing fleet coordination and compliance management. Incorporating an optical waveguide display allows critical telemetry to be projected directly into the rider's field of vision without compromising optical clarity.
  • Furthermore, the implementation of ambient sound filtering isolates crucial traffic signals from disruptive wind noise, significantly enhancing situational awareness. Utilizing a high-density lithium ion power source ensures these complex electronics maintain sufficient operational endurance throughout extended shifts. This technological evolution enables boardroom executives to align stringent occupational safety protocols with digital transformation initiatives.
  • As regulatory frameworks increasingly mandate active rider protection, embedding sophisticated connectivity modules into protective headwear becomes a critical strategic imperative for risk mitigation and logistical efficiency.

What are the Key Data Covered in this Automotive Smart Helmet Market Research and Growth Report?

  • What is the expected growth of the Automotive Smart Helmet Market between 2026 and 2030?

    • USD 95.27 million, at a CAGR of 4.9%

  • What segmentation does the market report cover?

    • The report is segmented by Type (Full helmet, and Half helmet), End-user (Individual consumers, and Commercial and fleet operators), Technology (Connectivity modules, Sensor-integrated helmets, Augmented reality displays, and Health monitoring sensors) and Geography (North America, Europe, APAC, South America, Middle East and Africa)

  • Which regions are analyzed in the report?

    • North America, Europe, APAC, South America and Middle East and Africa

  • What are the key growth drivers and market challenges?

    • Technological advancements in connected IoT devices, High product costs and affordability challenges

  • Who are the major players in the Automotive Smart Helmet Market?

    • ADMX Helmets, Aegis Rider AG, Ather Energy Pvt. Ltd., Caberg SpA, Crosshelmet, Headfox Innovations Pvt. Ltd., Intelligent Cranium Helmets, JMD Helmets Pvt Ltd, Kido Sports Co. Ltd., LIVALL Tech Co. Ltd., Mech Apparel Ltd, Nexxpro SA, Nolan Group SpA, Robionix Automation, Schuberth GmbH, Sena Technologies Inc., Shellios Technolabs Pvt. Ltd., Steelbird Hi Tech India Ltd., Techtron Engineering and Vega Auto Accessories Pvt. Ltd.

Market Research Insights

  • The Automotive Smart Helmet sector is rapidly evolving as traditional safety equipment converges with advanced digital infrastructure. Integrating a digital transport ecosystem directly into protective gear significantly enhances situational awareness elevation for operators. Commercial fleets utilizing seamless smartphone synchronization have improved route compliance by 18%, directly reducing fuel consumption and transit delays.
  • Furthermore, deploying a multi channel communication network within industrial settings has lowered incident response times by 22%, driving better risk management and compliance alignment. Manufacturers prioritize a low energy bluetooth profile to ensure multi-day battery endurance, directly increasing field operational uptime by 15%.
  • This wearable technology convergence ensures active rider protection while streamlining logistics coordination and minimizing dangerous visual distractions during transit.

We can help! Our analysts can customize this automotive smart helmet market research report to meet your requirements.

Get in touch

1. Executive Summary

1.1 Market overview

Executive Summary - Chart on Market Overview
Executive Summary - Data Table on Market Overview
Executive Summary - Chart on Global Market Characteristics
Executive Summary - Chart on Market by Geography
Executive Summary - Chart on Market Segmentation by Type
Executive Summary - Chart on Market Segmentation by End-user
Executive Summary - Chart on Market Segmentation by Technology
Executive Summary - Chart on Incremental Growth
Executive Summary - Data Table on Incremental Growth
Executive Summary - Chart on Company Market Positioning

2. Technavio Analysis

2.1 Analysis of price sensitivity, lifecycle, customer purchase basket, adoption rates, and purchase criteria

2.2 Criticality of inputs and Factors of differentiation

Chart on Overview on criticality of inputs and factors of differentiation

2.3 Factors of disruption

Chart on Overview on factors of disruption

2.4 Impact of drivers and challenges

Chart on Impact of drivers and challenges in 2025 and 2030

3. Market Landscape

3.1 Market ecosystem

Chart on Parent Market
Data Table on - Parent Market

3.2 Market characteristics

Chart on Market characteristics analysis

3.3 Value chain analysis

Chart on Value chain analysis

4. Market Sizing

4.1 Market definition

Data Table on Offerings of companies included in the market definition

4.2 Market segment analysis

Market segments

4.3 Market size 2025

4.4 Market outlook: Forecast for 2025-2030

Chart on Global - Market size and forecast 2025-2030 ($ thousand)
Data Table on Global - Market size and forecast 2025-2030 ($ thousand)
Chart on Global Market: Year-over-year growth 2025-2030 (%)
Data Table on Global Market: Year-over-year growth 2025-2030 (%)

5. Historic Market Size

5.1 Global Automotive Smart Helmet Market 2020 - 2024

Historic Market Size - Data Table on Global Automotive Smart Helmet Market 2020 - 2024 ($ thousand)

5.2 Type segment analysis 2020 - 2024

Historic Market Size - Type Segment 2020 - 2024 ($ thousand)

5.3 End-user segment analysis 2020 - 2024

Historic Market Size - End-user Segment 2020 - 2024 ($ thousand)

5.4 Technology segment analysis 2020 - 2024

Historic Market Size - Technology Segment 2020 - 2024 ($ thousand)

5.5 Geography segment analysis 2020 - 2024

Historic Market Size - Geography Segment 2020 - 2024 ($ thousand)

5.6 Country segment analysis 2020 - 2024

Historic Market Size - Country Segment 2020 - 2024 ($ thousand)

6. Qualitative Analysis

6.1 Impact of AI on Global Automotive Smart Helmet Market

6.2 Impact of geopolitical conflicts on Global Automotive Smart Helmet Market

7. Five Forces Analysis

7.1 Five forces summary

Five forces analysis - Comparison between 2025 and 2030

7.2 Bargaining power of buyers

Bargaining power of buyers - Impact of key factors 2025 and 2030

7.3 Bargaining power of suppliers

Bargaining power of suppliers - Impact of key factors in 2025 and 2030

7.4 Threat of new entrants

Threat of new entrants - Impact of key factors in 2025 and 2030

7.5 Threat of substitutes

Threat of substitutes - Impact of key factors in 2025 and 2030

7.6 Threat of rivalry

Threat of rivalry - Impact of key factors in 2025 and 2030

7.7 Market condition

Chart on Market condition - Five forces 2025 and 2030

8. Market Segmentation by Type

8.1 Market segments

Chart on Type - Market share 2025-2030 (%)
Data Table on Type - Market share 2025-2030 (%)

8.2 Comparison by Type

Chart on Comparison by Type
Data Table on Comparison by Type

8.3 Full helmet - Market size and forecast 2025-2030

Chart on Full helmet - Market size and forecast 2025-2030 ($ thousand)
Data Table on Full helmet - Market size and forecast 2025-2030 ($ thousand)
Chart on Full helmet - Year-over-year growth 2025-2030 (%)
Data Table on Full helmet - Year-over-year growth 2025-2030 (%)

8.4 Half helmet - Market size and forecast 2025-2030

Chart on Half helmet - Market size and forecast 2025-2030 ($ thousand)
Data Table on Half helmet - Market size and forecast 2025-2030 ($ thousand)
Chart on Half helmet - Year-over-year growth 2025-2030 (%)
Data Table on Half helmet - Year-over-year growth 2025-2030 (%)

8.5 Market opportunity by Type

Market opportunity by Type ($ thousand)
Data Table on Market opportunity by Type ($ thousand)

9. Market Segmentation by End-user

9.1 Market segments

Chart on End-user - Market share 2025-2030 (%)
Data Table on End-user - Market share 2025-2030 (%)

9.2 Comparison by End-user

Chart on Comparison by End-user
Data Table on Comparison by End-user

9.3 Individual consumers - Market size and forecast 2025-2030

Chart on Individual consumers - Market size and forecast 2025-2030 ($ thousand)
Data Table on Individual consumers - Market size and forecast 2025-2030 ($ thousand)
Chart on Individual consumers - Year-over-year growth 2025-2030 (%)
Data Table on Individual consumers - Year-over-year growth 2025-2030 (%)

9.4 Commercial and fleet operators - Market size and forecast 2025-2030

Chart on Commercial and fleet operators - Market size and forecast 2025-2030 ($ thousand)
Data Table on Commercial and fleet operators - Market size and forecast 2025-2030 ($ thousand)
Chart on Commercial and fleet operators - Year-over-year growth 2025-2030 (%)
Data Table on Commercial and fleet operators - Year-over-year growth 2025-2030 (%)

9.5 Market opportunity by End-user

Market opportunity by End-user ($ thousand)
Data Table on Market opportunity by End-user ($ thousand)

10. Market Segmentation by Technology

10.1 Market segments

Chart on Technology - Market share 2025-2030 (%)
Data Table on Technology - Market share 2025-2030 (%)

10.2 Comparison by Technology

Chart on Comparison by Technology
Data Table on Comparison by Technology

10.3 Connectivity modules - Market size and forecast 2025-2030

Chart on Connectivity modules - Market size and forecast 2025-2030 ($ thousand)
Data Table on Connectivity modules - Market size and forecast 2025-2030 ($ thousand)
Chart on Connectivity modules - Year-over-year growth 2025-2030 (%)
Data Table on Connectivity modules - Year-over-year growth 2025-2030 (%)

10.4 Sensor-integrated helmets - Market size and forecast 2025-2030

Chart on Sensor-integrated helmets - Market size and forecast 2025-2030 ($ thousand)
Data Table on Sensor-integrated helmets - Market size and forecast 2025-2030 ($ thousand)
Chart on Sensor-integrated helmets - Year-over-year growth 2025-2030 (%)
Data Table on Sensor-integrated helmets - Year-over-year growth 2025-2030 (%)

10.5 Augmented reality displays - Market size and forecast 2025-2030

Chart on Augmented reality displays - Market size and forecast 2025-2030 ($ thousand)
Data Table on Augmented reality displays - Market size and forecast 2025-2030 ($ thousand)
Chart on Augmented reality displays - Year-over-year growth 2025-2030 (%)
Data Table on Augmented reality displays - Year-over-year growth 2025-2030 (%)

10.6 Health monitoring sensors - Market size and forecast 2025-2030

Chart on Health monitoring sensors - Market size and forecast 2025-2030 ($ thousand)
Data Table on Health monitoring sensors - Market size and forecast 2025-2030 ($ thousand)
Chart on Health monitoring sensors - Year-over-year growth 2025-2030 (%)
Data Table on Health monitoring sensors - Year-over-year growth 2025-2030 (%)

10.7 Market opportunity by Technology

Market opportunity by Technology ($ thousand)
Data Table on Market opportunity by Technology ($ thousand)

11. Customer Landscape

11.1 Customer landscape overview

Analysis of price sensitivity, lifecycle, customer purchase basket, adoption rates, and purchase criteria

12. Geographic Landscape

12.1 Geographic segmentation

Chart on Market share by geography 2025-2030 (%)
Data Table on Market share by geography 2025-2030 (%)

12.2 Geographic comparison

Chart on Geographic comparison
Data Table on Geographic comparison

12.3 North America - Market size and forecast 2025-2030

Chart on North America - Market size and forecast 2025-2030 ($ thousand)
Data Table on North America - Market size and forecast 2025-2030 ($ thousand)
Chart on North America - Year-over-year growth 2025-2030 (%)
Data Table on North America - Year-over-year growth 2025-2030 (%)
Chart on Regional Comparison - North America
Data Table on Regional Comparison - North America

12.3.1 US - Market size and forecast 2025-2030

Chart on US - Market size and forecast 2025-2030 ($ thousand)
Data Table on US - Market size and forecast 2025-2030 ($ thousand)
Chart on US - Year-over-year growth 2025-2030 (%)
Data Table on US - Year-over-year growth 2025-2030 (%)

12.3.2 Canada - Market size and forecast 2025-2030

Chart on Canada - Market size and forecast 2025-2030 ($ thousand)
Data Table on Canada - Market size and forecast 2025-2030 ($ thousand)
Chart on Canada - Year-over-year growth 2025-2030 (%)
Data Table on Canada - Year-over-year growth 2025-2030 (%)

12.3.3 Mexico - Market size and forecast 2025-2030

Chart on Mexico - Market size and forecast 2025-2030 ($ thousand)
Data Table on Mexico - Market size and forecast 2025-2030 ($ thousand)
Chart on Mexico - Year-over-year growth 2025-2030 (%)
Data Table on Mexico - Year-over-year growth 2025-2030 (%)

12.4 Europe - Market size and forecast 2025-2030

Chart on Europe - Market size and forecast 2025-2030 ($ thousand)
Data Table on Europe - Market size and forecast 2025-2030 ($ thousand)
Chart on Europe - Year-over-year growth 2025-2030 (%)
Data Table on Europe - Year-over-year growth 2025-2030 (%)
Chart on Regional Comparison - Europe
Data Table on Regional Comparison - Europe

12.4.1 Germany - Market size and forecast 2025-2030

Chart on Germany - Market size and forecast 2025-2030 ($ thousand)
Data Table on Germany - Market size and forecast 2025-2030 ($ thousand)
Chart on Germany - Year-over-year growth 2025-2030 (%)
Data Table on Germany - Year-over-year growth 2025-2030 (%)

12.4.2 UK - Market size and forecast 2025-2030

Chart on UK - Market size and forecast 2025-2030 ($ thousand)
Data Table on UK - Market size and forecast 2025-2030 ($ thousand)
Chart on UK - Year-over-year growth 2025-2030 (%)
Data Table on UK - Year-over-year growth 2025-2030 (%)

12.4.3 France - Market size and forecast 2025-2030

Chart on France - Market size and forecast 2025-2030 ($ thousand)
Data Table on France - Market size and forecast 2025-2030 ($ thousand)
Chart on France - Year-over-year growth 2025-2030 (%)
Data Table on France - Year-over-year growth 2025-2030 (%)

12.4.4 Italy - Market size and forecast 2025-2030

Chart on Italy - Market size and forecast 2025-2030 ($ thousand)
Data Table on Italy - Market size and forecast 2025-2030 ($ thousand)
Chart on Italy - Year-over-year growth 2025-2030 (%)
Data Table on Italy - Year-over-year growth 2025-2030 (%)

12.4.5 Spain - Market size and forecast 2025-2030

Chart on Spain - Market size and forecast 2025-2030 ($ thousand)
Data Table on Spain - Market size and forecast 2025-2030 ($ thousand)
Chart on Spain - Year-over-year growth 2025-2030 (%)
Data Table on Spain - Year-over-year growth 2025-2030 (%)

12.4.6 The Netherlands - Market size and forecast 2025-2030

Chart on The Netherlands - Market size and forecast 2025-2030 ($ thousand)
Data Table on The Netherlands - Market size and forecast 2025-2030 ($ thousand)
Chart on The Netherlands - Year-over-year growth 2025-2030 (%)
Data Table on The Netherlands - Year-over-year growth 2025-2030 (%)

12.5 APAC - Market size and forecast 2025-2030

Chart on APAC - Market size and forecast 2025-2030 ($ thousand)
Data Table on APAC - Market size and forecast 2025-2030 ($ thousand)
Chart on APAC - Year-over-year growth 2025-2030 (%)
Data Table on APAC - Year-over-year growth 2025-2030 (%)
Chart on Regional Comparison - APAC
Data Table on Regional Comparison - APAC

12.5.1 China - Market size and forecast 2025-2030

Chart on China - Market size and forecast 2025-2030 ($ thousand)
Data Table on China - Market size and forecast 2025-2030 ($ thousand)
Chart on China - Year-over-year growth 2025-2030 (%)
Data Table on China - Year-over-year growth 2025-2030 (%)

12.5.2 India - Market size and forecast 2025-2030

Chart on India - Market size and forecast 2025-2030 ($ thousand)
Data Table on India - Market size and forecast 2025-2030 ($ thousand)
Chart on India - Year-over-year growth 2025-2030 (%)
Data Table on India - Year-over-year growth 2025-2030 (%)

12.5.3 Japan - Market size and forecast 2025-2030

Chart on Japan - Market size and forecast 2025-2030 ($ thousand)
Data Table on Japan - Market size and forecast 2025-2030 ($ thousand)
Chart on Japan - Year-over-year growth 2025-2030 (%)
Data Table on Japan - Year-over-year growth 2025-2030 (%)

12.5.4 South Korea - Market size and forecast 2025-2030

Chart on South Korea - Market size and forecast 2025-2030 ($ thousand)
Data Table on South Korea - Market size and forecast 2025-2030 ($ thousand)
Chart on South Korea - Year-over-year growth 2025-2030 (%)
Data Table on South Korea - Year-over-year growth 2025-2030 (%)

12.5.5 Australia - Market size and forecast 2025-2030

Chart on Australia - Market size and forecast 2025-2030 ($ thousand)
Data Table on Australia - Market size and forecast 2025-2030 ($ thousand)
Chart on Australia - Year-over-year growth 2025-2030 (%)
Data Table on Australia - Year-over-year growth 2025-2030 (%)

12.5.6 Indonesia - Market size and forecast 2025-2030

Chart on Indonesia - Market size and forecast 2025-2030 ($ thousand)
Data Table on Indonesia - Market size and forecast 2025-2030 ($ thousand)
Chart on Indonesia - Year-over-year growth 2025-2030 (%)
Data Table on Indonesia - Year-over-year growth 2025-2030 (%)

12.6 South America - Market size and forecast 2025-2030

Chart on South America - Market size and forecast 2025-2030 ($ thousand)
Data Table on South America - Market size and forecast 2025-2030 ($ thousand)
Chart on South America - Year-over-year growth 2025-2030 (%)
Data Table on South America - Year-over-year growth 2025-2030 (%)
Chart on Regional Comparison - South America
Data Table on Regional Comparison - South America

12.6.1 Brazil - Market size and forecast 2025-2030

Chart on Brazil - Market size and forecast 2025-2030 ($ thousand)
Data Table on Brazil - Market size and forecast 2025-2030 ($ thousand)
Chart on Brazil - Year-over-year growth 2025-2030 (%)
Data Table on Brazil - Year-over-year growth 2025-2030 (%)

12.6.2 Argentina - Market size and forecast 2025-2030

Chart on Argentina - Market size and forecast 2025-2030 ($ thousand)
Data Table on Argentina - Market size and forecast 2025-2030 ($ thousand)
Chart on Argentina - Year-over-year growth 2025-2030 (%)
Data Table on Argentina - Year-over-year growth 2025-2030 (%)

12.6.3 Chile - Market size and forecast 2025-2030

Chart on Chile - Market size and forecast 2025-2030 ($ thousand)
Data Table on Chile - Market size and forecast 2025-2030 ($ thousand)
Chart on Chile - Year-over-year growth 2025-2030 (%)
Data Table on Chile - Year-over-year growth 2025-2030 (%)

12.7 Middle East and Africa - Market size and forecast 2025-2030

Chart on Middle East and Africa - Market size and forecast 2025-2030 ($ thousand)
Data Table on Middle East and Africa - Market size and forecast 2025-2030 ($ thousand)
Chart on Middle East and Africa - Year-over-year growth 2025-2030 (%)
Data Table on Middle East and Africa - Year-over-year growth 2025-2030 (%)
Chart on Regional Comparison - Middle East and Africa
Data Table on Regional Comparison - Middle East and Africa

12.7.1 Saudi Arabia - Market size and forecast 2025-2030

Chart on Saudi Arabia - Market size and forecast 2025-2030 ($ thousand)
Data Table on Saudi Arabia - Market size and forecast 2025-2030 ($ thousand)
Chart on Saudi Arabia - Year-over-year growth 2025-2030 (%)
Data Table on Saudi Arabia - Year-over-year growth 2025-2030 (%)

12.7.2 UAE - Market size and forecast 2025-2030

Chart on UAE - Market size and forecast 2025-2030 ($ thousand)
Data Table on UAE - Market size and forecast 2025-2030 ($ thousand)
Chart on UAE - Year-over-year growth 2025-2030 (%)
Data Table on UAE - Year-over-year growth 2025-2030 (%)

12.7.3 South Africa - Market size and forecast 2025-2030

Chart on South Africa - Market size and forecast 2025-2030 ($ thousand)
Data Table on South Africa - Market size and forecast 2025-2030 ($ thousand)
Chart on South Africa - Year-over-year growth 2025-2030 (%)
Data Table on South Africa - Year-over-year growth 2025-2030 (%)

12.7.4 Israel - Market size and forecast 2025-2030

Chart on Israel - Market size and forecast 2025-2030 ($ thousand)
Data Table on Israel - Market size and forecast 2025-2030 ($ thousand)
Chart on Israel - Year-over-year growth 2025-2030 (%)
Data Table on Israel - Year-over-year growth 2025-2030 (%)

12.7.5 Turkey - Market size and forecast 2025-2030

Chart on Turkey - Market size and forecast 2025-2030 ($ thousand)
Data Table on Turkey - Market size and forecast 2025-2030 ($ thousand)
Chart on Turkey - Year-over-year growth 2025-2030 (%)
Data Table on Turkey - Year-over-year growth 2025-2030 (%)

12.8 Market opportunity by geography

Market opportunity by geography ($ thousand)
Data Tables on Market opportunity by geography ($ thousand)

13. Drivers, Challenges, and Opportunity

13.1 Market drivers

Technological advancements in connected IoT devices
Growing consumer focus on personal wellness
Rise of urban micro mobility

13.2 Market challenges

High product costs and affordability challenges
Technical complexities and battery limitations
Regulatory fragmentation and data privacy

13.3 Impact of drivers and challenges

Impact of drivers and challenges in 2025 and 2030

13.4 Market opportunities

Integration of advanced connectivity features
Rising demand for workplace safety
Proliferation of augmented reality displays

14. Competitive Landscape

14.1 Overview

14.2

Overview on criticality of inputs and factors of differentiation

14.3 Landscape disruption

Overview on factors of disruption

14.4 Industry risks

Impact of key risks on business

15. Competitive Analysis

15.1 Companies profiled

Companies covered

15.2 Company ranking index

15.3 Market positioning of companies

Matrix on companies position and classification

15.4 Aegis Rider AG

Aegis Rider AG - Overview
Aegis Rider AG - Product / Service
Aegis Rider AG - Key offerings
SWOT

15.5 Ather Energy Pvt. Ltd.

Ather Energy Pvt. Ltd. - Overview
Ather Energy Pvt. Ltd. - Product / Service
Ather Energy Pvt. Ltd. - Key offerings
SWOT

15.6 Caberg SpA

Caberg SpA - Overview
Caberg SpA - Product / Service
Caberg SpA - Key offerings
SWOT

15.7 Crosshelmet

Crosshelmet - Overview
Crosshelmet - Product / Service
Crosshelmet - Key offerings
SWOT

15.8 Headfox Innovations Pvt. Ltd.

Headfox Innovations Pvt. Ltd. - Overview
Headfox Innovations Pvt. Ltd. - Product / Service
Headfox Innovations Pvt. Ltd. - Key offerings
SWOT

15.9 JMD Helmets Pvt Ltd

JMD Helmets Pvt Ltd - Overview
JMD Helmets Pvt Ltd - Product / Service
JMD Helmets Pvt Ltd - Key offerings
SWOT

15.10 Kido Sports Co. Ltd.

Kido Sports Co. Ltd. - Overview
Kido Sports Co. Ltd. - Product / Service
Kido Sports Co. Ltd. - Key offerings
SWOT

15.11 LIVALL Tech Co. Ltd.

LIVALL Tech Co. Ltd. - Overview
LIVALL Tech Co. Ltd. - Product / Service
LIVALL Tech Co. Ltd. - Key offerings
SWOT

15.12 Nexxpro SA

Nexxpro SA - Overview
Nexxpro SA - Product / Service
Nexxpro SA - Key offerings
SWOT

15.13 Nolan Group SpA

Nolan Group SpA - Overview
Nolan Group SpA - Product / Service
Nolan Group SpA - Key offerings
SWOT

15.14 Schuberth GmbH

Schuberth GmbH - Overview
Schuberth GmbH - Product / Service
Schuberth GmbH - Key offerings
SWOT

15.15 Sena Technologies Inc.

Sena Technologies Inc. - Overview
Sena Technologies Inc. - Product / Service
Sena Technologies Inc. - Key offerings
SWOT

15.16 Shellios Technolabs Pvt. Ltd.

Shellios Technolabs Pvt. Ltd. - Overview
Shellios Technolabs Pvt. Ltd. - Product / Service
Shellios Technolabs Pvt. Ltd. - Key offerings
SWOT

15.17 Steelbird Hi Tech India Ltd.

Steelbird Hi Tech India Ltd. - Overview
Steelbird Hi Tech India Ltd. - Product / Service
Steelbird Hi Tech India Ltd. - Key offerings
SWOT

15.18 Vega Auto Accessories Pvt. Ltd.

Vega Auto Accessories Pvt. Ltd. - Overview
Vega Auto Accessories Pvt. Ltd. - Product / Service
Vega Auto Accessories Pvt. Ltd. - Key offerings
SWOT

16. Appendix

16.1 Scope of the report

Market definition
Objectives
Notes and caveats

16.2 Inclusions and exclusions checklist

Inclusions checklist
Exclusions checklist

16.3 Currency conversion rates for US$

16.4 Research methodology

16.5 Data procurement

Information sources

16.6 Data validation

16.7 Validation techniques employed for market sizing

16.8 Data synthesis

16.9 360 degree market analysis

16.10 List of abbreviations

Research Methodology

Technavio presents a detailed picture of the market by way of study, synthesis, and summation of data from multiple sources. The analysts have presented the various facets of the market with a particular focus on identifying the key industry influencers. The data thus presented is comprehensive, reliable, and the result of extensive research, both primary and secondary.

INFORMATION SOURCES

Primary sources

  • Manufacturers and suppliers
  • Channel partners
  • Industry experts
  • Strategic decision makers

Secondary sources

  • Industry journals and periodicals
  • Government data
  • Financial reports of key industry players
  • Historical data
  • Press releases

DATA ANALYSIS

Data Synthesis

  • Collation of data
  • Estimation of key figures
  • Analysis of derived insights

Data Validation

  • Triangulation with data models
  • Reference against proprietary databases
  • Corroboration with industry experts

REPORT WRITING

Qualitative

  • Market drivers
  • Market challenges
  • Market trends
  • Five forces analysis

Quantitative

  • Market size and forecast
  • Market segmentation
  • Geographical insights
  • Competitive landscape

Interested in this report?

Get your sample now to see our research methodology and insights!

Download Now

Frequently Asked Questions

Automotive Smart Helmet market growth will increase by USD 95266.1 thousand thousand during 2026-2030.

The Automotive Smart Helmet market is expected to grow at a CAGR of 4.9% during 2026-2030.

Automotive Smart Helmet market is segmented by Type (Full helmet, Half helmet) End-user (Individual consumers, Commercial and fleet operators) Technology (Connectivity modules, Sensor-integrated helmets, Augmented reality displays, Health monitoring sensors)

ADMX Helmets, Aegis Rider AG, Ather Energy Pvt. Ltd., Caberg SpA, Crosshelmet, Headfox Innovations Pvt. Ltd., Intelligent Cranium Helmets, JMD Helmets Pvt Ltd, Kido Sports Co. Ltd., LIVALL Tech Co. Ltd., Mech Apparel Ltd, Nexxpro SA, Nolan Group SpA, Robionix Automation, Schuberth GmbH, Sena Technologies Inc., Shellios Technolabs Pvt. Ltd., Steelbird Hi Tech India Ltd., Techtron Engineering, Vega Auto Accessories Pvt. Ltd. are a few of the key vendors in the Automotive Smart Helmet market.

North America will register the highest growth rate of 40.7% among the other regions. Therefore, the Automotive Smart Helmet market in North America is expected to garner significant business opportunities for the vendors during the forecast period.

US, Canada, Mexico, Germany, UK, France, Italy, Spain, The Netherlands, China, India, Japan, South Korea, Australia, Indonesia, Brazil, Argentina, Chile, Saudi Arabia, UAE, South Africa, Israel, Turkey

  • Technological advancements in connected IoT devices is the driving factor this market.

The Automotive Smart Helmet market vendors should focus on grabbing business opportunities from the Type segment as it accounted for the largest market share in the base year.
RIA - Research AI Assistant
Ask RIA
