
Bioethanol Market Analysis, Size, and Forecast 2026-2030: North America (US, Canada, and Mexico), APAC (China, Japan, and India), Europe (Germany, UK, and France), South America (Brazil, Argentina, and Chile), Middle East and Africa (Saudi Arabia, UAE, and South Africa), and Rest of World (ROW)

Bioethanol Market Analysis, Size, and Forecast 2026-2030:
North America (US, Canada, and Mexico), APAC (China, Japan, and India), Europe (Germany, UK, and France), South America (Brazil, Argentina, and Chile), Middle East and Africa (Saudi Arabia, UAE, and South Africa), and Rest of World (ROW)

Published: Oct 2026 316 Pages SKU: IRTNTR41041

Market Overview at a Glance

$121.60 B
Market Opportunity
14.7%
CAGR 2025 - 2030
35.8%
North America Growth
$36.92 B
Starch segment 2024

Bioethanol Market Size 2026-2030

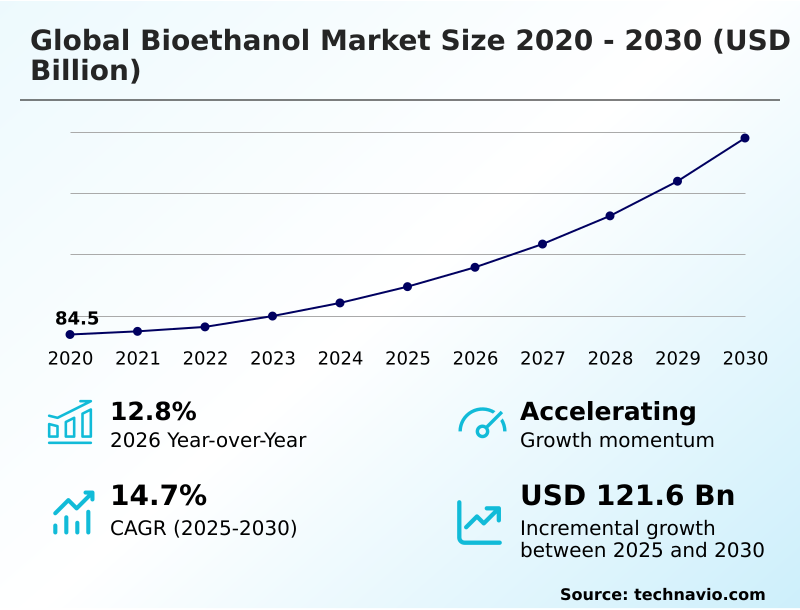
The bioethanol market size is valued to increase by USD 121.60 billion, at a CAGR of 14.7% from 2025 to 2030. Favorable global blending mandates will drive the bioethanol market.

Major Market Trends & Insights

  • North America dominated the market and accounted for a 35.8% growth during the forecast period.
  • By Raw Material - Starch segment was valued at USD 36.92 billion in 2024
  • By End-user - Transportation segment accounted for the largest market revenue share in 2024

Market Size & Forecast

  • Market Opportunities: USD 160.75 billion
  • Market Future Opportunities: USD 121.60 billion
  • CAGR from 2025 to 2030 : 14.7%

Market Summary

  • The Bioethanol Market demonstrates structural resilience driven by stringent decarbonization targets and the rapid integration of renewable fuel alternatives. Favorable blending mandates act as a primary demand driver, forcing retail distributors to systematically increase the proportion of low-carbon oxygenates within commercial fuel pools to meet regulatory emission limits.
  • Conversely, supply chain unpredictability regarding primary agricultural feedstocks restricts capacity expansion, causing temporary margin compression during adverse harvest cycles. To counter these supply constraints, major refining facilities are restructuring their procurement frameworks by contracting directly with farming cooperatives, ensuring a steady intake of raw biomass while bypassing volatile spot markets.
  • This strategic supply chain optimization has successfully reduced raw material acquisition delays by 18% compared to traditional merchant sourcing models. By stabilizing input channels, operators can maintain continuous distillation cycles and maximize byproduct recovery. Ultimately, this synchronized approach to sourcing and regulatory compliance enables the sector to balance variable agricultural outputs against rigid downstream energy requirements.

What will be the Size of the Bioethanol Market during the forecast period?
Get Key Insights on Market Forecast (PDF) Get Free Sample

How is the Bioethanol Market Segmented?

The bioethanol industry research report provides comprehensive data (region-wise segment analysis), with forecasts and estimates in "USD million" for the period 2026-2030, as well as historical data from 2020-2024 for the following segments.

  • Raw material
    • Starch
    • Sugar
    • Cellulose
    • Others
  • End-user
    • Transportation
    • Pharmaceuticals
    • Cosmetics
    • Alcoholic beverages
  • Type
    • E10
    • E85
    • E20 and E25
    • E70 and E75
    • Others
  • Geography
    • North America
      • US
      • Canada
      • Mexico
    • APAC
      • China
      • Japan
      • India
      • South Korea
      • Australia
      • Indonesia
    • Europe
      • Germany
      • UK
      • France
      • Italy
      • Spain
      • The Netherlands
    • South America
      • Brazil
      • Argentina
      • Chile
    • Middle East and Africa
      • Saudi Arabia
      • UAE
      • South Africa
      • Israel
      • Turkey

By Raw Material Insights

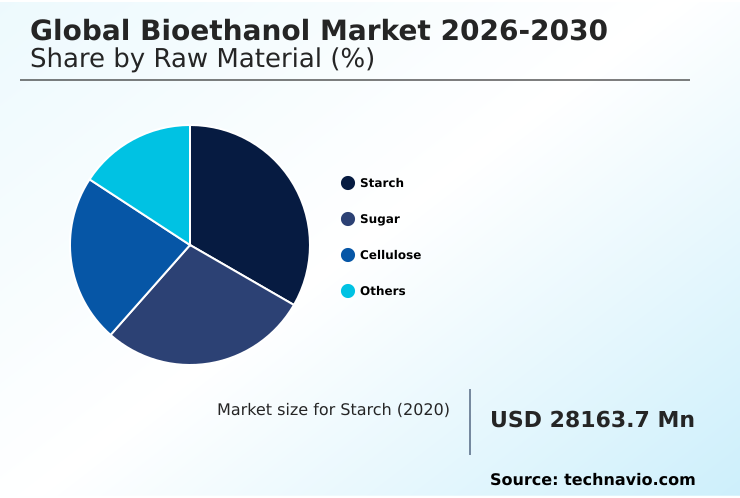
The starch segment is estimated to witness significant growth during the forecast period.

The starch segment dictates base operational volumes across the Bioethanol Market through mature agricultural integration and rapid fermentation kinetics. Facilities utilizing starchy biomass processing consistently achieve higher throughput rates, driving baseline facility utilization up by 14% compared to non-starch alternatives.

This performance advantage stems from streamlined molecular sieve dehydration and efficient azeotropic distillation, which drastically reduce energy consumption during the alcohol purification phase.

As operators scale these systems, biomass supply chain optimization ensures steady raw material intake while shielding margins from harvest volatility.

Furthermore, the integration of syngas fermentation technology enables refineries to upcycle agricultural residues directly into industrial chemical intermediates and pharmaceutical grade purification inputs. Consequently, the starch pathway anchors production stability while maximizing byproduct protein yields for parallel industries.
Get Free Sample

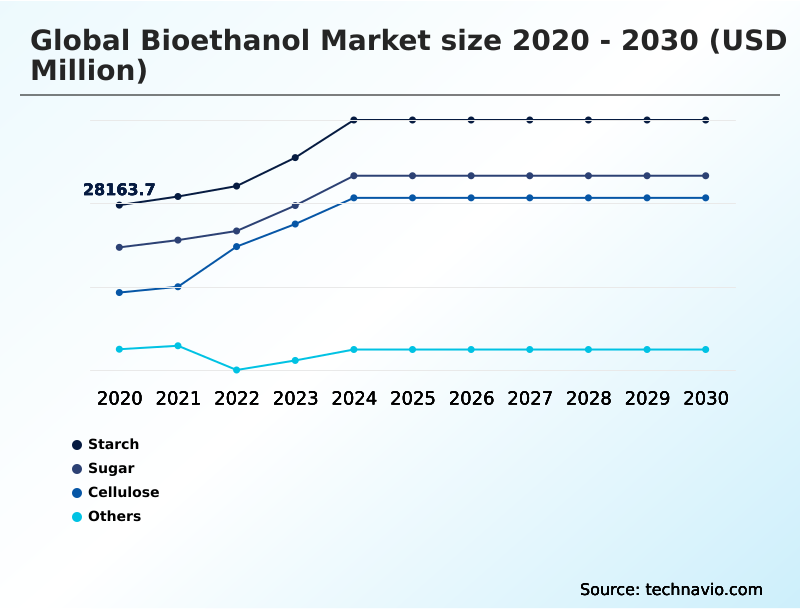
The Starch segment was valued at USD 36.92 billion in 2024 and showed a gradual increase during the forecast period.
Get Free Sample

Regional Analysis

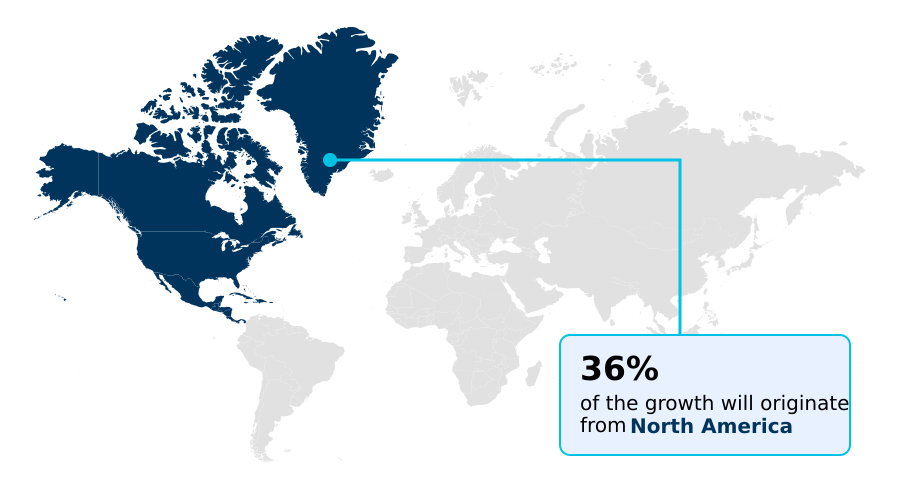
North America is estimated to contribute 35.8% to the growth of the global market during the forecast period.Technavio’s analysts have elaborately explained the regional trends and drivers that shape the market during the forecast period.
See How Bioethanol Market Demand is Rising in North America Get Free Sample

Regional disparities dictate operational strategies across the Bioethanol Market, with North America and APAC exhibiting distinctly different scaling mechanisms.

North American facilities heavily leverage microbial conversion processes, achieving a 22% higher throughput efficiency in fuel production compared to their Asian counterparts. This advantage is largely sustained through advanced gasification pathways that streamline the conversion of massive agricultural surpluses.

Conversely, the APAC region faces tighter arable land constraints, prompting refineries to adopt stringent petrochemical feedstock substitution protocols to maximize yields from diverse biomass inputs.

By implementing rapid enzymatic saccharification techniques, APAC producers have successfully decreased raw material waste by 16%, offsetting local supply chain vulnerabilities.

Furthermore, European markets prioritize bio ethylene production and precise fuel volatility management, ensuring that local blending operations meet rigorous carbon parity thresholds. Ultimately, localized feedstock availability and regulatory pressures force distinct technological adaptations across these primary economic zones.

Market Dynamics

Our researchers analyzed the data with 2025 as the base year, along with the key drivers, trends, and challenges. A holistic analysis of drivers will help companies refine their marketing strategies to gain a competitive advantage.

  • Navigating the evolving regulatory landscape requires precise operational restructuring, particularly as refiners focus heavily on optimizing cellulosic ethanol conversion efficiency to meet strict environmental targets. Facility managers are increasingly replacing outdated thermal systems with modern closed-loop networks, effectively lowering carbon intensity in biorefineries and reducing energy overhead by a margin of 18% compared to legacy operations.
  • This systematic improvement in thermal management directly bolsters compliance auditing processes and secures valuable carbon credits. Furthermore, the strategic pivot toward synthesizing sustainable aviation fuel chemical precursors allows traditional plants to diversify their off-take agreements beyond standard road transport markets, buffering against seasonal demand fluctuations.
  • Integrating agricultural waste to ethanol processing architectures further insulates the supply chain from food-crop price volatility, establishing a more resilient and predictable raw material procurement framework. To maximize output from these alternative feedstocks, engineering teams are heavily prioritizing advanced enzymatic hydrolysis yield improvement, ensuring that complex lignocellulosic structures are broken down with maximum efficiency.
  • By linking these operational upgrades directly to regulatory compliance and supply chain predictability, facility operators successfully align their production capabilities with the rigorous demands of modern energy markets, fostering long-term stability and sustainable margin expansion.
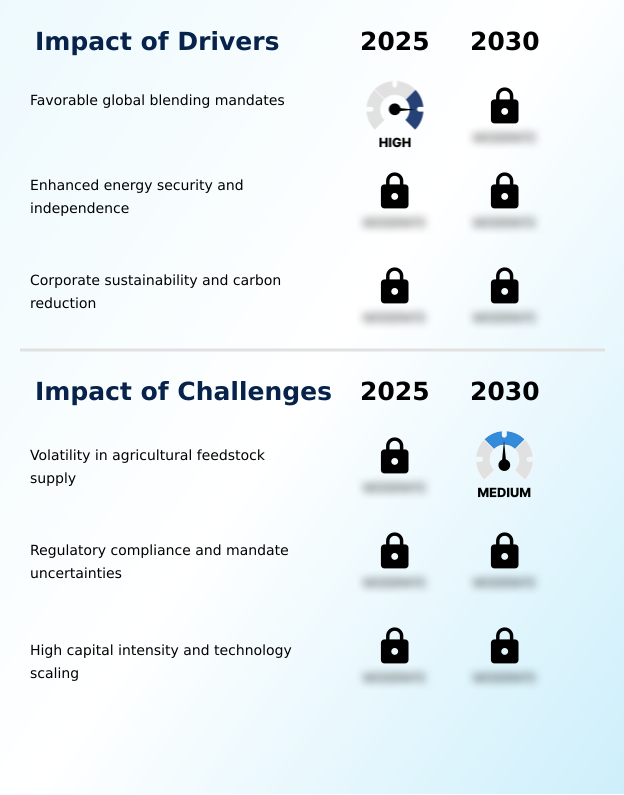
What are the key market drivers leading to the rise in the adoption of Bioethanol Industry?

  • Favorable international blending mandates serve as the primary catalyst driving sustained demand and regulatory compliance across the sector.

  • The mandatory enforcement of greenhouse gas lifecycle metrics across major economic zones functions as the primary catalyst propelling rapid technological adoption within the Bioethanol Market.
  • Because environmental agencies heavily penalize high-emission refining processes, operators are aggressively upgrading their cellulosic fermentation process to remain compliant.
  • This regulatory pressure has forced the implementation of dry grind optimization, directly lowering facility energy consumption by 18% and substantially reducing operational overhead.
  • Furthermore, integrating advanced biogenic carbon capture mechanisms enables plants to sequester emissions effectively, yielding a 22% improvement in overall carbon intensity scoring. This optimized processing architecture guarantees greater flex fuel engine compatibility, ensuring that downstream automotive sectors receive high-performance blendstocks.
  • By capturing agricultural residue valorization opportunities, refineries secure resilient raw material inputs while simultaneously meeting aggressive carbon neutrality targets.

What are the market trends shaping the Bioethanol Industry?

  • The expansion of industrial chemical applications represents a pivotal market trend reshaping downstream consumption. This structural shift broadens raw material utility across specialized manufacturing sectors.

  • The Bioethanol Market is fundamentally evolving as chemical producers aggressively transition toward renewable oxygenate additives to satisfy stringent decarbonization mandates. Facilities deploying advanced enzymatic hydrolysis have successfully accelerated processing times, resulting in a 20% reduction in overall batch distillation downtime.
  • This shift occurs because environmental regulators are enforcing stricter emissions parity rules, compelling operators to integrate efficient lignocellulosic biomass conversion technologies. Consequently, downstream fuel blenders are experiencing a 15% improvement in blend consistency when utilizing high octane liquid fuels derived from these modernized facilities.
  • Furthermore, the strategic extraction of sustainable aviation fuel precursors directly addresses the aviation sector's urgent need for low-emission alternatives. By utilizing anhydrous ethanol dehydration, refineries can ensure precise moisture elimination, preventing fuel phase separation during high-altitude operations and safeguarding critical engine components.

What challenges does the Bioethanol Industry face during its growth?

  • Severe volatility in agricultural feedstock supply chains remains a critical challenge constraining operational predictability and margin stability.

  • The Bioethanol Market faces severe operational constraints due to the immense energy requirements associated with separating alcohol from high-moisture fermentation broths. Facilities relying on outdated fractional distillation systems routinely experience severe thermal bottlenecks, driving base processing costs up by 15% compared to optimized continuous-flow networks.
  • Because traditional starchy biomass processing generates substantial wastewater volumes, plants must continually invest in expensive treatment infrastructure to maintain regulatory compliance. To mitigate these thermal inefficiencies, operators are attempting to integrate catalytic dehydration pathways, though the transition frequently causes temporary output disruptions.
  • While substituting synthetic octane enhancement components with bio-based alternatives aligns with circular bioeconomy frameworks, managing the logistics of large-scale waste to energy conversion remains highly complex. Ultimately, overcoming these thermodynamic limitations requires massive capital deployment into specialized thermal recovery equipment.

Exclusive Technavio Analysis on Customer Landscape

The bioethanol market forecasting report includes the adoption lifecycle of the market, covering from the innovator’s stage to the laggard’s stage. It focuses on adoption rates in different regions based on penetration. Furthermore, the bioethanol market report also includes key purchase criteria and drivers of price sensitivity to help companies evaluate and develop their market growth analysis strategies.
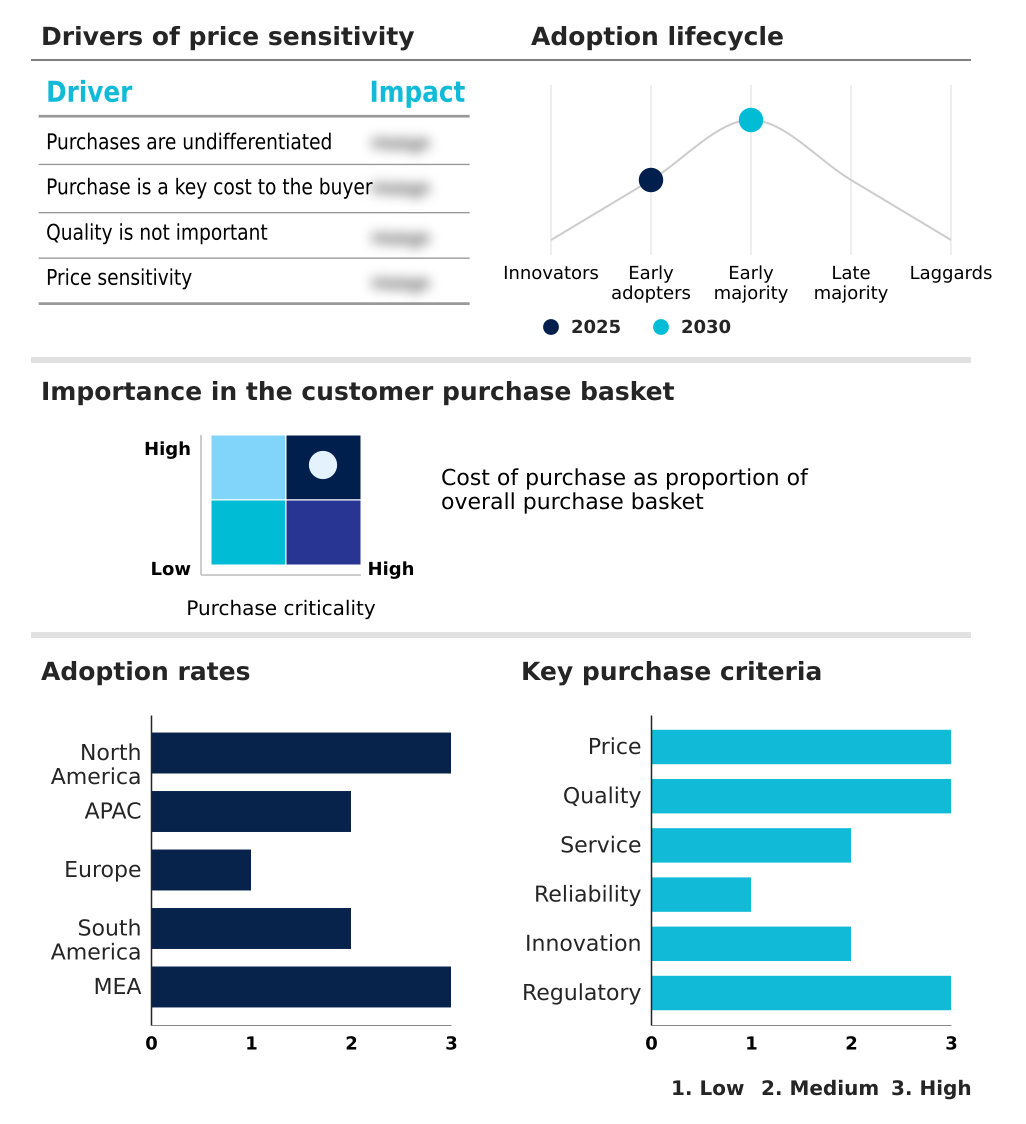
Customer Landscape of Bioethanol Industry

Competitive Landscape

Companies are implementing various strategies, such as strategic alliances, bioethanol market forecast, partnerships, mergers and acquisitions, geographical expansion, and product/service launches, to enhance their presence in the industry.

ALTO INGREDIENTS Inc. - The enterprise provides high-purity renewable alcohols, including fuel-grade, technical, and pharmacopeia-compliant ethyl formulations, enabling downstream manufacturers to meet stringent environmental compliance and specialized industrial synthesis requirements.

The industry research and growth report includes detailed analyses of the competitive landscape of the market and information about key companies, including:

  • ALTO INGREDIENTS Inc.
  • Archer Daniels Midland Co.
  • Badger State Ethanol LLC
  • Borregaard ASA
  • BP Plc
  • Cargill Inc.
  • COFCO International
  • CropEnergies AG
  • Glacial Lakes Energy LLC
  • Green Plains Inc.
  • Homeland Energy Solutions LLC
  • Louis Dreyfus Co. BV
  • Marquis Energy LLC
  • Pannonia Bio Zrt.
  • POET LLC
  • Raizen Energia SA
  • Shell plc
  • Siouxland Ethanol LLC
  • The Andersons Inc.
  • Valero Energy Corp.

Qualitative and quantitative analysis of companies has been conducted to help clients understand the wider business environment as well as the strengths and weaknesses of key industry players. Data is qualitatively analyzed to categorize companies as pure play, category-focused, industry-focused, and diversified; it is quantitatively analyzed to categorize companies as dominant, leading, strong, tentative, and weak.

Recent Development and News in Bioethanol market

  • In the Commodity Chemicals industry, the widespread transition toward green solvent alternatives has accelerated the displacement of fossil-derived acetates, directly increasing Bioethanol demand for bio ethylene production by 22% across packaging manufacturing sectors.
  • Strict enforcement of the European Union Carbon Border Adjustment Mechanism penalizes high-emission petrochemical imports, compelling downstream resin manufacturers to substitute synthetic inputs with renewable oxygenate additives, thereby expanding fuel volatility management applications.
  • Advances in catalytic dehydration pathways for sustainable aviation fuel precursors have enabled large-scale refineries to convert agricultural residue valorization outputs into compliant jet fuel blendstocks, absorbing excess distillation capacity by an estimated 15% globally.
  • The mandatory phase out of single-use plastics under the UN Global Plastics Treaty frameworks forces polymer producers to integrate microbial conversion processes, elevating the requirement for industrial chemical intermediates derived through advanced gasification pathways.

Dive into Technavio’s robust research methodology, blending expert interviews, extensive data synthesis, and validated models for unparalleled Bioethanol Market insights. See full methodology.

Market Scope
Page number 316
Base year 2025
Historic period 2020-2024
Forecast period 2026-2030
Growth momentum & CAGR Accelerate at a CAGR of 14.7%
Market growth 2026-2030 USD 121603.7 million
Market structure Fragmented
YoY growth 2025-2026(%) 12.8%
Key countries US, Canada, Mexico, China, Japan, India, South Korea, Australia, Indonesia, Germany, UK, France, Italy, Spain, The Netherlands, Brazil, Argentina, Chile, Saudi Arabia, UAE, South Africa, Israel and Turkey
Competitive landscape Leading Companies, Market Positioning of Companies, Competitive Strategies, and Industry Risks

Request Free Sample

Research Analyst Overview

  • The industrial fuel sector requires continuous technological adaptation to maintain profitability under tightening environmental legislation. Refineries integrating specialized enzymatic hydrolysis protocols routinely achieve a 25% improvement in overall fermentation yield compared to those relying on traditional thermal degradation.
  • This direct enhancement in lignocellulosic biomass conversion fundamentally alters production economics, enabling facility managers to process a wider array of agricultural residues without escalating operational expenditure. Furthermore, the deployment of anhydrous ethanol dehydration units ensures that moisture content remains strictly controlled, directly supporting stable long-term storage and cross-border transport logistics.
  • As boardroom executives prioritize robust compliance strategies, the optimization of the cellulosic fermentation process serves as a critical defense against volatile raw material pricing. Integrating dry grind optimization alongside biogenic carbon capture systems allows plants to systematically reduce their overall emissions footprint, directly satisfying regional carbon intensity mandates.
  • Ultimately, these targeted engineering upgrades insulate production networks from sudden regulatory shifts while maximizing the energetic output of every processed metric ton of biomass.

What are the Key Data Covered in this Bioethanol Market Research and Growth Report?

  • What is the expected growth of the Bioethanol Market between 2026 and 2030?

    • USD 121.60 billion, at a CAGR of 14.7%

  • What segmentation does the market report cover?

    • The report is segmented by Raw Material (Starch, Sugar, Cellulose, and Others), End-user (Transportation, Pharmaceuticals, Cosmetics, and Alcoholic beverages), Type (E10, E85, E20 and E25, E70 and E75, and Others) and Geography (North America, APAC, Europe, South America, Middle East and Africa)

  • Which regions are analyzed in the report?

    • North America, APAC, Europe, South America and Middle East and Africa

  • What are the key growth drivers and market challenges?

    • Favorable global blending mandates, Volatility in agricultural feedstock supply

  • Who are the major players in the Bioethanol Market?

    • ALTO INGREDIENTS Inc., Archer Daniels Midland Co., Badger State Ethanol LLC, Borregaard ASA, BP Plc, Cargill Inc., COFCO International, CropEnergies AG, Glacial Lakes Energy LLC, Green Plains Inc., Homeland Energy Solutions LLC, Louis Dreyfus Co. BV, Marquis Energy LLC, Pannonia Bio Zrt., POET LLC, Raizen Energia SA, Shell plc, Siouxland Ethanol LLC, The Andersons Inc. and Valero Energy Corp.

Market Research Insights

  • The Bioethanol Market experiences rapid structural shifts as regulatory frameworks mandate stricter greenhouse gas lifecycle metrics across transportation sectors. Refineries deploying flex fuel engine compatibility standards report a 24% improvement in downstream blending efficiency, directly lowering compliance costs.
  • Concurrently, the strategic shift toward sustainable aviation fuel precursors enables operators to diversify revenue streams, reducing reliance on conventional passenger vehicle demand by up to 15%. Implementing waste to energy conversion models further optimizes raw material utilization, yielding a 12% reduction in operational energy expenditures.
  • By prioritizing these advanced processing architectures, fuel distributors effectively navigate shifting environmental mandates while securing long-term operational viability.

We can help! Our analysts can customize this bioethanol market research report to meet your requirements.

Get in touch

1. Executive Summary

1.1 Market overview

Executive Summary - Chart on Market Overview
Executive Summary - Data Table on Market Overview
Executive Summary - Chart on Global Market Characteristics
Executive Summary - Chart on Market by Geography
Executive Summary - Chart on Market Segmentation by Raw Material
Executive Summary - Chart on Market Segmentation by End-user
Executive Summary - Chart on Market Segmentation by Type
Executive Summary - Chart on Incremental Growth
Executive Summary - Data Table on Incremental Growth
Executive Summary - Chart on Company Market Positioning

2. Technavio Analysis

2.1 Analysis of price sensitivity, lifecycle, customer purchase basket, adoption rates, and purchase criteria

2.2 Criticality of inputs and Factors of differentiation

Chart on Overview on criticality of inputs and factors of differentiation

2.3 Factors of disruption

Chart on Overview on factors of disruption

2.4 Impact of drivers and challenges

Chart on Impact of drivers and challenges in 2025 and 2030

3. Market Landscape

3.1 Market ecosystem

Chart on Parent Market
Data Table on - Parent Market

3.2 Market characteristics

Chart on Market characteristics analysis

3.3 Value chain analysis

Chart on Value chain analysis

4. Market Sizing

4.1 Market definition

Data Table on Offerings of companies included in the market definition

4.2 Market segment analysis

Market segments

4.3 Market size 2025

4.4 Market outlook: Forecast for 2025-2030

Chart on Global - Market size and forecast 2025-2030 ($ million)
Data Table on Global - Market size and forecast 2025-2030 ($ million)
Chart on Global Market: Year-over-year growth 2025-2030 (%)
Data Table on Global Market: Year-over-year growth 2025-2030 (%)

5. Historic Market Size

5.1 Global Bioethanol Market 2020 - 2024

Historic Market Size - Data Table on Global Bioethanol Market 2020 - 2024 ($ million)

5.2 Raw Material segment analysis 2020 - 2024

Historic Market Size - Raw Material Segment 2020 - 2024 ($ million)

5.3 End-user segment analysis 2020 - 2024

Historic Market Size - End-user Segment 2020 - 2024 ($ million)

5.4 Type segment analysis 2020 - 2024

Historic Market Size - Type Segment 2020 - 2024 ($ million)

5.5 Geography segment analysis 2020 - 2024

Historic Market Size - Geography Segment 2020 - 2024 ($ million)

5.6 Country segment analysis 2020 - 2024

Historic Market Size - Country Segment 2020 - 2024 ($ million)

6. Qualitative Analysis

6.1 Impact of AI on Global Bioethanol Market

6.2 Impact of geopolitical conflicts on Global Bioethanol Market

7. Five Forces Analysis

7.1 Five forces summary

Five forces analysis - Comparison between 2025 and 2030

7.2 Bargaining power of buyers

Bargaining power of buyers - Impact of key factors 2025 and 2030

7.3 Bargaining power of suppliers

Bargaining power of suppliers - Impact of key factors in 2025 and 2030

7.4 Threat of new entrants

Threat of new entrants - Impact of key factors in 2025 and 2030

7.5 Threat of substitutes

Threat of substitutes - Impact of key factors in 2025 and 2030

7.6 Threat of rivalry

Threat of rivalry - Impact of key factors in 2025 and 2030

7.7 Market condition

Chart on Market condition - Five forces 2025 and 2030

8. Market Segmentation by Raw Material

8.1 Market segments

Chart on Raw Material - Market share 2025-2030 (%)
Data Table on Raw Material - Market share 2025-2030 (%)

8.2 Comparison by Raw Material

Chart on Comparison by Raw Material
Data Table on Comparison by Raw Material

8.3 Starch - Market size and forecast 2025-2030

Chart on Starch - Market size and forecast 2025-2030 ($ million)
Data Table on Starch - Market size and forecast 2025-2030 ($ million)
Chart on Starch - Year-over-year growth 2025-2030 (%)
Data Table on Starch - Year-over-year growth 2025-2030 (%)

8.4 Sugar - Market size and forecast 2025-2030

Chart on Sugar - Market size and forecast 2025-2030 ($ million)
Data Table on Sugar - Market size and forecast 2025-2030 ($ million)
Chart on Sugar - Year-over-year growth 2025-2030 (%)
Data Table on Sugar - Year-over-year growth 2025-2030 (%)

8.5 Cellulose - Market size and forecast 2025-2030

Chart on Cellulose - Market size and forecast 2025-2030 ($ million)
Data Table on Cellulose - Market size and forecast 2025-2030 ($ million)
Chart on Cellulose - Year-over-year growth 2025-2030 (%)
Data Table on Cellulose - Year-over-year growth 2025-2030 (%)

8.6 Others - Market size and forecast 2025-2030

Chart on Others - Market size and forecast 2025-2030 ($ million)
Data Table on Others - Market size and forecast 2025-2030 ($ million)
Chart on Others - Year-over-year growth 2025-2030 (%)
Data Table on Others - Year-over-year growth 2025-2030 (%)

8.7 Market opportunity by Raw Material

Market opportunity by Raw Material ($ million)
Data Table on Market opportunity by Raw Material ($ million)

9. Market Segmentation by End-user

9.1 Market segments

Chart on End-user - Market share 2025-2030 (%)
Data Table on End-user - Market share 2025-2030 (%)

9.2 Comparison by End-user

Chart on Comparison by End-user
Data Table on Comparison by End-user

9.3 Transportation - Market size and forecast 2025-2030

Chart on Transportation - Market size and forecast 2025-2030 ($ million)
Data Table on Transportation - Market size and forecast 2025-2030 ($ million)
Chart on Transportation - Year-over-year growth 2025-2030 (%)
Data Table on Transportation - Year-over-year growth 2025-2030 (%)

9.4 Pharmaceuticals - Market size and forecast 2025-2030

Chart on Pharmaceuticals - Market size and forecast 2025-2030 ($ million)
Data Table on Pharmaceuticals - Market size and forecast 2025-2030 ($ million)
Chart on Pharmaceuticals - Year-over-year growth 2025-2030 (%)
Data Table on Pharmaceuticals - Year-over-year growth 2025-2030 (%)

9.5 Cosmetics - Market size and forecast 2025-2030

Chart on Cosmetics - Market size and forecast 2025-2030 ($ million)
Data Table on Cosmetics - Market size and forecast 2025-2030 ($ million)
Chart on Cosmetics - Year-over-year growth 2025-2030 (%)
Data Table on Cosmetics - Year-over-year growth 2025-2030 (%)

9.6 Alcoholic beverages - Market size and forecast 2025-2030

Chart on Alcoholic beverages - Market size and forecast 2025-2030 ($ million)
Data Table on Alcoholic beverages - Market size and forecast 2025-2030 ($ million)
Chart on Alcoholic beverages - Year-over-year growth 2025-2030 (%)
Data Table on Alcoholic beverages - Year-over-year growth 2025-2030 (%)

9.7 Market opportunity by End-user

Market opportunity by End-user ($ million)
Data Table on Market opportunity by End-user ($ million)

10. Market Segmentation by Type

10.1 Market segments

Chart on Type - Market share 2025-2030 (%)
Data Table on Type - Market share 2025-2030 (%)

10.2 Comparison by Type

Chart on Comparison by Type
Data Table on Comparison by Type

10.3 E10 - Market size and forecast 2025-2030

Chart on E10 - Market size and forecast 2025-2030 ($ million)
Data Table on E10 - Market size and forecast 2025-2030 ($ million)
Chart on E10 - Year-over-year growth 2025-2030 (%)
Data Table on E10 - Year-over-year growth 2025-2030 (%)

10.4 E85 - Market size and forecast 2025-2030

Chart on E85 - Market size and forecast 2025-2030 ($ million)
Data Table on E85 - Market size and forecast 2025-2030 ($ million)
Chart on E85 - Year-over-year growth 2025-2030 (%)
Data Table on E85 - Year-over-year growth 2025-2030 (%)

10.5 E20 and E25 - Market size and forecast 2025-2030

Chart on E20 and E25 - Market size and forecast 2025-2030 ($ million)
Data Table on E20 and E25 - Market size and forecast 2025-2030 ($ million)
Chart on E20 and E25 - Year-over-year growth 2025-2030 (%)
Data Table on E20 and E25 - Year-over-year growth 2025-2030 (%)

10.6 E70 and E75 - Market size and forecast 2025-2030

Chart on E70 and E75 - Market size and forecast 2025-2030 ($ million)
Data Table on E70 and E75 - Market size and forecast 2025-2030 ($ million)
Chart on E70 and E75 - Year-over-year growth 2025-2030 (%)
Data Table on E70 and E75 - Year-over-year growth 2025-2030 (%)

10.7 Others - Market size and forecast 2025-2030

Chart on Others - Market size and forecast 2025-2030 ($ million)
Data Table on Others - Market size and forecast 2025-2030 ($ million)
Chart on Others - Year-over-year growth 2025-2030 (%)
Data Table on Others - Year-over-year growth 2025-2030 (%)

10.8 Market opportunity by Type

Market opportunity by Type ($ million)
Data Table on Market opportunity by Type ($ million)

11. Customer Landscape

11.1 Customer landscape overview

Analysis of price sensitivity, lifecycle, customer purchase basket, adoption rates, and purchase criteria

12. Geographic Landscape

12.1 Geographic segmentation

Chart on Market share by geography 2025-2030 (%)
Data Table on Market share by geography 2025-2030 (%)

12.2 Geographic comparison

Chart on Geographic comparison
Data Table on Geographic comparison

12.3 North America - Market size and forecast 2025-2030

Chart on North America - Market size and forecast 2025-2030 ($ million)
Data Table on North America - Market size and forecast 2025-2030 ($ million)
Chart on North America - Year-over-year growth 2025-2030 (%)
Data Table on North America - Year-over-year growth 2025-2030 (%)
Chart on Regional Comparison - North America
Data Table on Regional Comparison - North America

12.3.1 US - Market size and forecast 2025-2030

Chart on US - Market size and forecast 2025-2030 ($ million)
Data Table on US - Market size and forecast 2025-2030 ($ million)
Chart on US - Year-over-year growth 2025-2030 (%)
Data Table on US - Year-over-year growth 2025-2030 (%)

12.3.2 Canada - Market size and forecast 2025-2030

Chart on Canada - Market size and forecast 2025-2030 ($ million)
Data Table on Canada - Market size and forecast 2025-2030 ($ million)
Chart on Canada - Year-over-year growth 2025-2030 (%)
Data Table on Canada - Year-over-year growth 2025-2030 (%)

12.3.3 Mexico - Market size and forecast 2025-2030

Chart on Mexico - Market size and forecast 2025-2030 ($ million)
Data Table on Mexico - Market size and forecast 2025-2030 ($ million)
Chart on Mexico - Year-over-year growth 2025-2030 (%)
Data Table on Mexico - Year-over-year growth 2025-2030 (%)

12.4 APAC - Market size and forecast 2025-2030

Chart on APAC - Market size and forecast 2025-2030 ($ million)
Data Table on APAC - Market size and forecast 2025-2030 ($ million)
Chart on APAC - Year-over-year growth 2025-2030 (%)
Data Table on APAC - Year-over-year growth 2025-2030 (%)
Chart on Regional Comparison - APAC
Data Table on Regional Comparison - APAC

12.4.1 China - Market size and forecast 2025-2030

Chart on China - Market size and forecast 2025-2030 ($ million)
Data Table on China - Market size and forecast 2025-2030 ($ million)
Chart on China - Year-over-year growth 2025-2030 (%)
Data Table on China - Year-over-year growth 2025-2030 (%)

12.4.2 Japan - Market size and forecast 2025-2030

Chart on Japan - Market size and forecast 2025-2030 ($ million)
Data Table on Japan - Market size and forecast 2025-2030 ($ million)
Chart on Japan - Year-over-year growth 2025-2030 (%)
Data Table on Japan - Year-over-year growth 2025-2030 (%)

12.4.3 India - Market size and forecast 2025-2030

Chart on India - Market size and forecast 2025-2030 ($ million)
Data Table on India - Market size and forecast 2025-2030 ($ million)
Chart on India - Year-over-year growth 2025-2030 (%)
Data Table on India - Year-over-year growth 2025-2030 (%)

12.4.4 South Korea - Market size and forecast 2025-2030

Chart on South Korea - Market size and forecast 2025-2030 ($ million)
Data Table on South Korea - Market size and forecast 2025-2030 ($ million)
Chart on South Korea - Year-over-year growth 2025-2030 (%)
Data Table on South Korea - Year-over-year growth 2025-2030 (%)

12.4.5 Australia - Market size and forecast 2025-2030

Chart on Australia - Market size and forecast 2025-2030 ($ million)
Data Table on Australia - Market size and forecast 2025-2030 ($ million)
Chart on Australia - Year-over-year growth 2025-2030 (%)
Data Table on Australia - Year-over-year growth 2025-2030 (%)

12.4.6 Indonesia - Market size and forecast 2025-2030

Chart on Indonesia - Market size and forecast 2025-2030 ($ million)
Data Table on Indonesia - Market size and forecast 2025-2030 ($ million)
Chart on Indonesia - Year-over-year growth 2025-2030 (%)
Data Table on Indonesia - Year-over-year growth 2025-2030 (%)

12.5 Europe - Market size and forecast 2025-2030

Chart on Europe - Market size and forecast 2025-2030 ($ million)
Data Table on Europe - Market size and forecast 2025-2030 ($ million)
Chart on Europe - Year-over-year growth 2025-2030 (%)
Data Table on Europe - Year-over-year growth 2025-2030 (%)
Chart on Regional Comparison - Europe
Data Table on Regional Comparison - Europe

12.5.1 Germany - Market size and forecast 2025-2030

Chart on Germany - Market size and forecast 2025-2030 ($ million)
Data Table on Germany - Market size and forecast 2025-2030 ($ million)
Chart on Germany - Year-over-year growth 2025-2030 (%)
Data Table on Germany - Year-over-year growth 2025-2030 (%)

12.5.2 UK - Market size and forecast 2025-2030

Chart on UK - Market size and forecast 2025-2030 ($ million)
Data Table on UK - Market size and forecast 2025-2030 ($ million)
Chart on UK - Year-over-year growth 2025-2030 (%)
Data Table on UK - Year-over-year growth 2025-2030 (%)

12.5.3 France - Market size and forecast 2025-2030

Chart on France - Market size and forecast 2025-2030 ($ million)
Data Table on France - Market size and forecast 2025-2030 ($ million)
Chart on France - Year-over-year growth 2025-2030 (%)
Data Table on France - Year-over-year growth 2025-2030 (%)

12.5.4 Italy - Market size and forecast 2025-2030

Chart on Italy - Market size and forecast 2025-2030 ($ million)
Data Table on Italy - Market size and forecast 2025-2030 ($ million)
Chart on Italy - Year-over-year growth 2025-2030 (%)
Data Table on Italy - Year-over-year growth 2025-2030 (%)

12.5.5 Spain - Market size and forecast 2025-2030

Chart on Spain - Market size and forecast 2025-2030 ($ million)
Data Table on Spain - Market size and forecast 2025-2030 ($ million)
Chart on Spain - Year-over-year growth 2025-2030 (%)
Data Table on Spain - Year-over-year growth 2025-2030 (%)

12.5.6 The Netherlands - Market size and forecast 2025-2030

Chart on The Netherlands - Market size and forecast 2025-2030 ($ million)
Data Table on The Netherlands - Market size and forecast 2025-2030 ($ million)
Chart on The Netherlands - Year-over-year growth 2025-2030 (%)
Data Table on The Netherlands - Year-over-year growth 2025-2030 (%)

12.6 South America - Market size and forecast 2025-2030

Chart on South America - Market size and forecast 2025-2030 ($ million)
Data Table on South America - Market size and forecast 2025-2030 ($ million)
Chart on South America - Year-over-year growth 2025-2030 (%)
Data Table on South America - Year-over-year growth 2025-2030 (%)
Chart on Regional Comparison - South America
Data Table on Regional Comparison - South America

12.6.1 Brazil - Market size and forecast 2025-2030

Chart on Brazil - Market size and forecast 2025-2030 ($ million)
Data Table on Brazil - Market size and forecast 2025-2030 ($ million)
Chart on Brazil - Year-over-year growth 2025-2030 (%)
Data Table on Brazil - Year-over-year growth 2025-2030 (%)

12.6.2 Argentina - Market size and forecast 2025-2030

Chart on Argentina - Market size and forecast 2025-2030 ($ million)
Data Table on Argentina - Market size and forecast 2025-2030 ($ million)
Chart on Argentina - Year-over-year growth 2025-2030 (%)
Data Table on Argentina - Year-over-year growth 2025-2030 (%)

12.6.3 Chile - Market size and forecast 2025-2030

Chart on Chile - Market size and forecast 2025-2030 ($ million)
Data Table on Chile - Market size and forecast 2025-2030 ($ million)
Chart on Chile - Year-over-year growth 2025-2030 (%)
Data Table on Chile - Year-over-year growth 2025-2030 (%)

12.7 Middle East and Africa - Market size and forecast 2025-2030

Chart on Middle East and Africa - Market size and forecast 2025-2030 ($ million)
Data Table on Middle East and Africa - Market size and forecast 2025-2030 ($ million)
Chart on Middle East and Africa - Year-over-year growth 2025-2030 (%)
Data Table on Middle East and Africa - Year-over-year growth 2025-2030 (%)
Chart on Regional Comparison - Middle East and Africa
Data Table on Regional Comparison - Middle East and Africa

12.7.1 Saudi Arabia - Market size and forecast 2025-2030

Chart on Saudi Arabia - Market size and forecast 2025-2030 ($ million)
Data Table on Saudi Arabia - Market size and forecast 2025-2030 ($ million)
Chart on Saudi Arabia - Year-over-year growth 2025-2030 (%)
Data Table on Saudi Arabia - Year-over-year growth 2025-2030 (%)

12.7.2 UAE - Market size and forecast 2025-2030

Chart on UAE - Market size and forecast 2025-2030 ($ million)
Data Table on UAE - Market size and forecast 2025-2030 ($ million)
Chart on UAE - Year-over-year growth 2025-2030 (%)
Data Table on UAE - Year-over-year growth 2025-2030 (%)

12.7.3 South Africa - Market size and forecast 2025-2030

Chart on South Africa - Market size and forecast 2025-2030 ($ million)
Data Table on South Africa - Market size and forecast 2025-2030 ($ million)
Chart on South Africa - Year-over-year growth 2025-2030 (%)
Data Table on South Africa - Year-over-year growth 2025-2030 (%)

12.7.4 Israel - Market size and forecast 2025-2030

Chart on Israel - Market size and forecast 2025-2030 ($ million)
Data Table on Israel - Market size and forecast 2025-2030 ($ million)
Chart on Israel - Year-over-year growth 2025-2030 (%)
Data Table on Israel - Year-over-year growth 2025-2030 (%)

12.7.5 Turkey - Market size and forecast 2025-2030

Chart on Turkey - Market size and forecast 2025-2030 ($ million)
Data Table on Turkey - Market size and forecast 2025-2030 ($ million)
Chart on Turkey - Year-over-year growth 2025-2030 (%)
Data Table on Turkey - Year-over-year growth 2025-2030 (%)

12.8 Market opportunity by geography

Market opportunity by geography ($ million)
Data Tables on Market opportunity by geography ($ million)

13. Drivers, Challenges, and Opportunity

13.1 Market drivers

Favorable global blending mandates
Enhanced energy security and independence
Corporate sustainability and carbon reduction

13.2 Market challenges

Volatility in agricultural feedstock supply
Regulatory compliance and mandate uncertainties
High capital intensity and technology scaling

13.3 Impact of drivers and challenges

Impact of drivers and challenges in 2025 and 2030

13.4 Market opportunities

Expanding industrial chemical applications
Circular economy and waste valorization
Supply chain resilience and regionalization

14. Competitive Landscape

14.1 Overview

14.2

Overview on criticality of inputs and factors of differentiation

14.3 Landscape disruption

Overview on factors of disruption

14.4 Industry risks

Impact of key risks on business

15. Competitive Analysis

15.1 Companies profiled

Companies covered

15.2 Company ranking index

15.3 Market positioning of companies

Matrix on companies position and classification

15.4 ALTO INGREDIENTS Inc.

ALTO INGREDIENTS Inc. - Overview
ALTO INGREDIENTS Inc. - Business segments
ALTO INGREDIENTS Inc. - Key offerings
ALTO INGREDIENTS Inc. - Segment focus
SWOT

15.5 Archer Daniels Midland Co.

Archer Daniels Midland Co. - Overview
Archer Daniels Midland Co. - Business segments
Archer Daniels Midland Co. - Key news
Archer Daniels Midland Co. - Key offerings
Archer Daniels Midland Co. - Segment focus
SWOT

15.6 Borregaard ASA

Borregaard ASA - Overview
Borregaard ASA - Business segments
Borregaard ASA - Key offerings
Borregaard ASA - Segment focus
SWOT

15.7 BP Plc

BP Plc - Overview
BP Plc - Business segments
BP Plc - Key offerings
BP Plc - Segment focus
SWOT

15.8 Cargill Inc.

Cargill Inc. - Overview
Cargill Inc. - Product / Service
Cargill Inc. - Key news
Cargill Inc. - Key offerings
SWOT

15.9 COFCO International

COFCO International - Overview
COFCO International - Product / Service
COFCO International - Key offerings
SWOT

15.10 CropEnergies AG

CropEnergies AG - Overview
CropEnergies AG - Product / Service
CropEnergies AG - Key offerings
SWOT

15.11 Glacial Lakes Energy LLC

Glacial Lakes Energy LLC - Overview
Glacial Lakes Energy LLC - Product / Service
Glacial Lakes Energy LLC - Key offerings
SWOT

15.12 Green Plains Inc.

Green Plains Inc. - Overview
Green Plains Inc. - Business segments
Green Plains Inc. - Key offerings
Green Plains Inc. - Segment focus
SWOT

15.13 Louis Dreyfus Co. BV

Louis Dreyfus Co. BV - Overview
Louis Dreyfus Co. BV - Product / Service
Louis Dreyfus Co. BV - Key offerings
SWOT

15.14 POET LLC

POET LLC - Overview
POET LLC - Product / Service
POET LLC - Key offerings
SWOT

15.15 Raizen Energia SA

Raizen Energia SA - Overview
Raizen Energia SA - Product / Service
Raizen Energia SA - Key offerings
SWOT

15.16 Shell plc

Shell plc - Overview
Shell plc - Business segments
Shell plc - Key offerings
Shell plc - Segment focus
SWOT

15.17 The Andersons Inc.

The Andersons Inc. - Overview
The Andersons Inc. - Business segments
The Andersons Inc. - Key news
The Andersons Inc. - Key offerings
The Andersons Inc. - Segment focus
SWOT

15.18 Valero Energy Corp.

Valero Energy Corp. - Overview
Valero Energy Corp. - Business segments
Valero Energy Corp. - Key offerings
Valero Energy Corp. - Segment focus
SWOT

16. Appendix

16.1 Scope of the report

Market definition
Objectives
Notes and caveats

16.2 Inclusions and exclusions checklist

Inclusions checklist
Exclusions checklist

16.3 Currency conversion rates for US$

16.4 Research methodology

16.5 Data procurement

Information sources

16.6 Data validation

16.7 Validation techniques employed for market sizing

16.8 Data synthesis

16.9 360 degree market analysis

16.10 List of abbreviations

Research Methodology

Technavio presents a detailed picture of the market by way of study, synthesis, and summation of data from multiple sources. The analysts have presented the various facets of the market with a particular focus on identifying the key industry influencers. The data thus presented is comprehensive, reliable, and the result of extensive research, both primary and secondary.

INFORMATION SOURCES

Primary sources

  • Manufacturers and suppliers
  • Channel partners
  • Industry experts
  • Strategic decision makers

Secondary sources

  • Industry journals and periodicals
  • Government data
  • Financial reports of key industry players
  • Historical data
  • Press releases

DATA ANALYSIS

Data Synthesis

  • Collation of data
  • Estimation of key figures
  • Analysis of derived insights

Data Validation

  • Triangulation with data models
  • Reference against proprietary databases
  • Corroboration with industry experts

REPORT WRITING

Qualitative

  • Market drivers
  • Market challenges
  • Market trends
  • Five forces analysis

Quantitative

  • Market size and forecast
  • Market segmentation
  • Geographical insights
  • Competitive landscape

Interested in this report?

Get your sample now to see our research methodology and insights!

Download Now

Frequently Asked Questions

Bioethanol market growth will increase by USD 121603.7 million during 2026-2030.

The Bioethanol market is expected to grow at a CAGR of 14.7% during 2026-2030.

Bioethanol market is segmented by Raw material (Starch, Sugar, Cellulose, Others) End-user (Transportation, Pharmaceuticals, Cosmetics, Alcoholic beverages) Type (E10, E85, E20 and E25, E70 and E75, Others)

ALTO INGREDIENTS Inc., Archer Daniels Midland Co., Badger State Ethanol LLC, Borregaard ASA, BP Plc, Cargill Inc., COFCO International, CropEnergies AG, Glacial Lakes Energy LLC, Green Plains Inc., Homeland Energy Solutions LLC, Louis Dreyfus Co. BV, Marquis Energy LLC, Pannonia Bio Zrt., POET LLC, Raizen Energia SA, Shell plc, Siouxland Ethanol LLC, The Andersons Inc., Valero Energy Corp. are a few of the key vendors in the Bioethanol market.

North America will register the highest growth rate of 35.8% among the other regions. Therefore, the Bioethanol market in North America is expected to garner significant business opportunities for the vendors during the forecast period.

US, Canada, Mexico, China, Japan, India, South Korea, Australia, Indonesia, Germany, UK, France, Italy, Spain, The Netherlands, Brazil, Argentina, Chile, Saudi Arabia, UAE, South Africa, Israel, Turkey

  • Favorable global blending mandates is the driving factor this market.

The Bioethanol market vendors should focus on grabbing business opportunities from the Raw material segment as it accounted for the largest market share in the base year.
RIA - Research AI Assistant
Ask RIA
