
Biofuel From Sugar Crops Market Analysis, Size, and Forecast 2026-2030: South America (Brazil, Argentina, and Colombia), APAC (India, China, and Thailand), North America (US, Mexico, and Canada), Europe (France, Germany, and Poland), Middle East and Africa (Egypt, South Africa, and Kenya), and Rest of World (ROW)

Biofuel From Sugar Crops Market Analysis, Size, and Forecast 2026-2030:
South America (Brazil, Argentina, and Colombia), APAC (India, China, and Thailand), North America (US, Mexico, and Canada), Europe (France, Germany, and Poland), Middle East and Africa (Egypt, South Africa, and Kenya), and Rest of World (ROW)

Published: Oct 2026 291 Pages SKU: IRTNTR74237

Market Overview at a Glance

$548.6 Mn
Market Opportunity
3.2%
CAGR 2025 - 2030
43%
South America Growth
$1.05 B
Aviation segment 2024

Biofuel From Sugar Crops Market Size 2026-2030

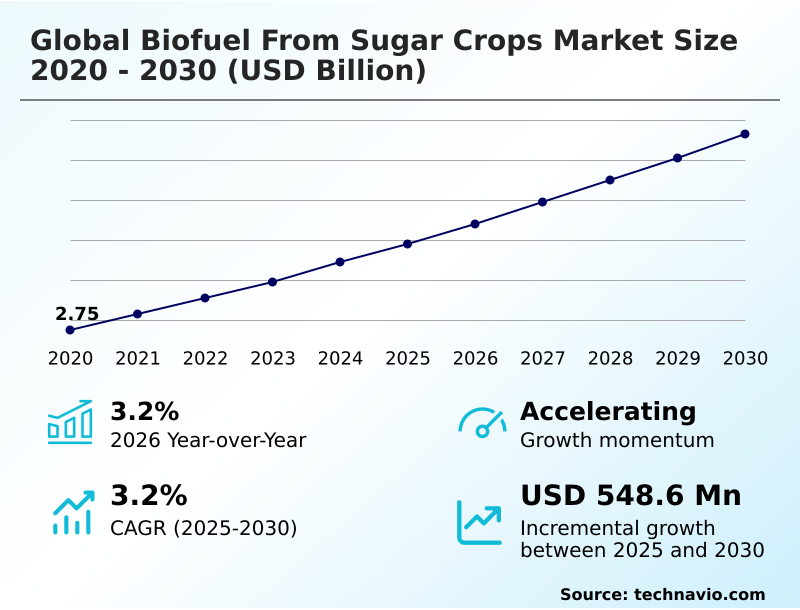
The biofuel from sugar crops market size is valued to increase by USD 548.6 million, at a CAGR of 3.2% from 2025 to 2030. Renewable fuel blending mandates and energy security objectives will drive the biofuel from sugar crops market.

Major Market Trends & Insights

  • South America dominated the market and accounted for a 43% growth during the forecast period.
  • By Application - Aviation segment was valued at USD 1.05 billion in 2024
  • By Type - Ethanol segment accounted for the largest market revenue share in 2024

Market Size & Forecast

  • Market Opportunities: USD 979.7 million
  • Market Future Opportunities: USD 548.6 million
  • CAGR from 2025 to 2030 : 3.2%

Market Summary

  • The Biofuel From Sugar Crops Market represents a critical component of the renewable energy transition, driven by the need to decarbonize transportation and industrial sectors. Policy-driven renewable fuel blending mandates act as a primary growth catalyst, forcing fuel distributors to integrate higher volumes of bioethanol to meet stringent energy security objectives.
  • For example, optimizing supply chain logistics for sugarcane processing allows biorefineries to increase feedstock conversion efficiency by up to 18%, significantly lowering operational overhead. However, the market faces persistent structural hurdles due to feedstock availability and land-use constraints. Competition for fertile agricultural land creates supply volatility, causing processing facilities to experience inconsistent raw material availability during adverse climatic events.
  • To mitigate these risks, operators are deploying precision agriculture and advanced inventory management systems to stabilize production cycles. This continuous pressure to balance agricultural output with fuel generation capacity requires stakeholders to invest in advanced biochemical fermentation pathways and co-product valorization strategies, ensuring long-term commercial viability while navigating complex regulatory and environmental compliance frameworks.

What will be the Size of the Biofuel From Sugar Crops Market during the forecast period?
Get Key Insights on Market Forecast (PDF) Get Free Sample

How is the Biofuel From Sugar Crops Market Segmented?

The biofuel from sugar crops industry research report provides comprehensive data (region-wise segment analysis), with forecasts and estimates in "USD million" for the period 2026-2030, as well as historical data from 2020-2024 for the following segments.

  • Application
    • Aviation
    • Automotive
    • Marine
    • Power
  • Type
    • Ethanol
    • Biogas
    • Others
  • Source
    • Sugarcane
    • Sugar beet
    • Others
  • Geography
    • South America
      • Brazil
      • Argentina
      • Colombia
    • APAC
      • India
      • China
      • Thailand
      • Indonesia
      • Australia
    • North America
      • US
      • Mexico
      • Canada
    • Europe
      • France
      • Germany
      • Poland
      • The Netherlands
    • Middle East and Africa
      • Egypt
      • South Africa
      • Kenya
      • Morocco

By Application Insights

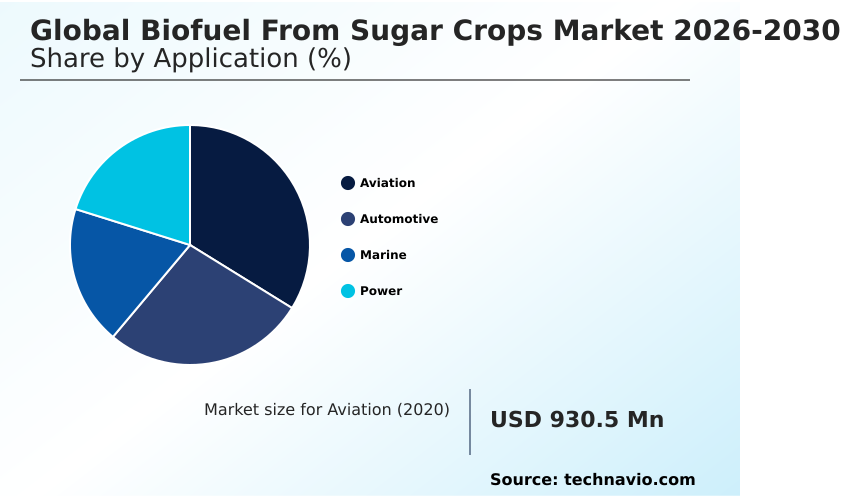
The aviation segment is estimated to witness significant growth during the forecast period.

The aviation application within the biofuel from sugar crops landscape is accelerating as operators integrate sustainable aviation fuel feedstock to meet aggressive decarbonization strategy objectives.

Ethanol derived from agricultural resources serves as a critical intermediary for alcohol to jet conversion, linking renewable energy infrastructure with commercial flight operations.

Advanced biochemical fermentation pathways and biomass gasification are being optimized to yield aviation-compatible outputs, allowing airlines to achieve measurable compliance targets.

For instance, operators utilizing optimized renewable fuel distillation configurations have documented lifecycle carbon emissions reduced by 40% compared to conventional jet fuel.

This shift requires rigorous sustainability certification across the agricultural supply chain to ensure feedstock traceability, driving deeper collaboration between operators and aerospace stakeholders to scale sustainable production.
Get Free Sample

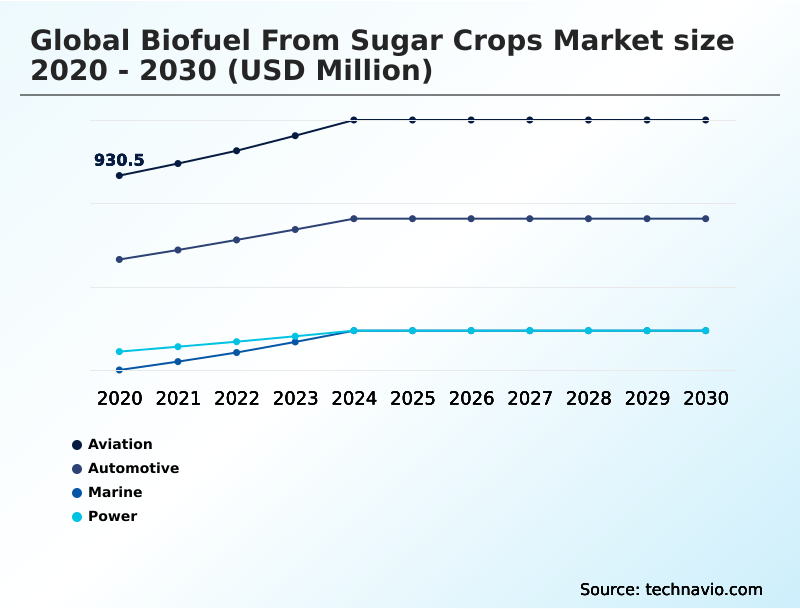
The Aviation segment was valued at USD 1.05 billion in 2024 and showed a gradual increase during the forecast period.
Get Free Sample

Regional Analysis

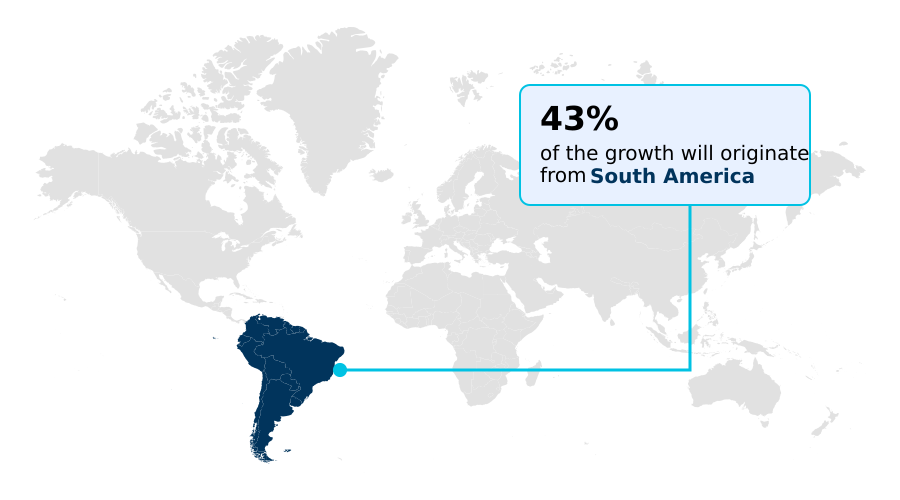
South America is estimated to contribute 43% to the growth of the global market during the forecast period.Technavio’s analysts have elaborately explained the regional trends and drivers that shape the market during the forecast period.
See How Biofuel From Sugar Crops Market Demand is Rising in South America Get Free Sample

The geographic landscape for the Biofuel From Sugar Crops demonstrates stark operational contrasts between South America and Europe.

South America maintains a distinct advantage in sugar crop fermentation, allowing regional producers to achieve a 25% higher feedstock conversion efficiency compared to European counterparts.

Europe's strict environmental performance standards compel biorefineries to invest heavily in cellulosic ethanol conversion, increasing initial compliance costs by 15% but yielding highly prized greenhouse gas reduction premiums.

South American facilities frequently utilize bagasse cogeneration to reduce grid reliance, cutting internal power costs by 30%. Meanwhile, European operators prioritize advanced biomethane extraction to align with circular economy principles and broader energy transition framework mandates.

This divergence dictates that South American businesses scale hydrous ethanol refining volumes, whereas European strategies emphasize premium outputs to satisfy rigorous continental fuel quality standards.

Market Dynamics

Our researchers analyzed the data with 2025 as the base year, along with the key drivers, trends, and challenges. A holistic analysis of drivers will help companies refine their marketing strategies to gain a competitive advantage.

  • The strategic pivot toward advanced renewable fuels is reshaping procurement and processing frameworks across the Biofuel From Sugar Crops landscape. Facility operators are increasingly investing in a sugarcane bagasse cogeneration system to insulate processing plants from grid volatility, effectively lowering baseline energy expenditures by 20% compared to legacy operations.
  • Simultaneously, manufacturers in temperate agricultural zones are optimizing sugar beet bioethanol production to ensure consistent output during seasonal fluctuations, improving overall capacity utilization. As regulatory pressures intensify around emissions, distributors are prioritizing anhydrous ethanol fuel blending to meet elevated octane requirements without requiring massive infrastructure overhauls.
  • Furthermore, the commercialization of cellulosic ethanol conversion technology allows operators to monetize agricultural residues, effectively extracting 15% more usable energy from existing acreage while minimizing direct competition with food supply chains. This focus on resource efficiency is particularly crucial for the aviation sector, where the alcohol to jet conversion pathway is rapidly maturing from pilot programs to scalable commercial operations.
  • By vertically integrating these advanced processing techniques, biorefineries are fundamentally improving their operational resilience and compliance postures. This structural evolution enables energy stakeholders to mitigate raw material supply risks while capturing premium margins in heavily regulated transportation markets demanding verifiable, low-carbon alternatives.
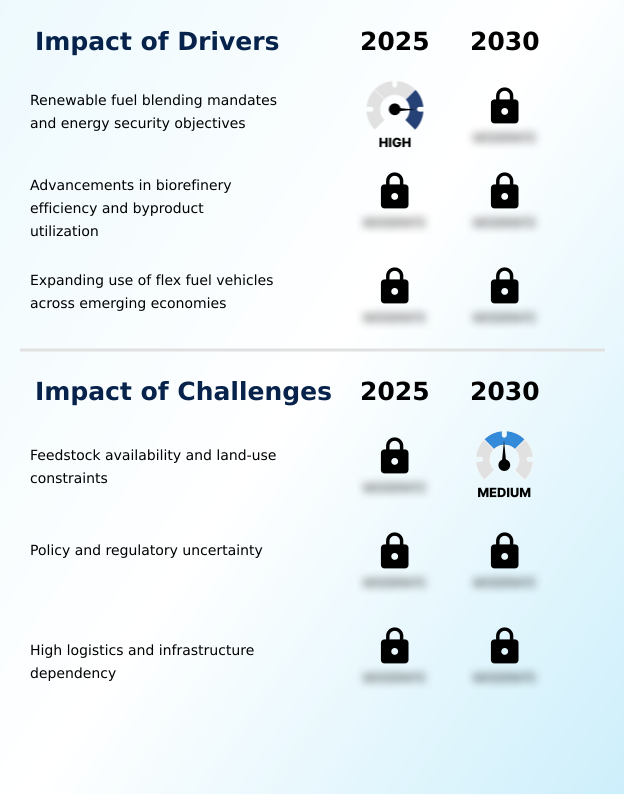
What are the key market drivers leading to the rise in the adoption of Biofuel From Sugar Crops Industry?

  • The implementation of renewable fuel blending mandates and energy security objectives serves as a primary driver propelling market expansion.

  • Stringent regulatory mandates for transportation fuel diversification are accelerating the adoption of anhydrous ethanol processing technologies across the Biofuel From Sugar Crops sector.
  • Governments are aggressively enforcing carbon intensity scoring penalties on fossil fuels, compelling distributors to increase their ethanol blending ratio to remain compliant with strict energy security policy objectives.
  • As a result, fleet operators upgrading to vehicles with advanced flex fuel compatibility have realized a 15% reduction in overall emissions, driving immediate fossil fuel displacement.
  • This policy-driven demand pushes agricultural processors to enhance feedstock pretreatment efficiency, which has subsequently lowered energy consumption during milling by 12%. These operational adjustments directly protect profit margins, enabling biorefineries to leverage bioenergy cogeneration to guarantee domestic energy availability.

What are the market trends shaping the Biofuel From Sugar Crops Industry?

  • The development of biofuel and sustainable aviation fuel integration pathways represents a significant market trend. This evolution reflects an industry-wide shift toward advanced renewable fuel ecosystems to support broader decarbonization objectives.

  • The Biofuel From Sugar Crops is shifting toward multi-feedstock processing models as operators seek to maximize asset utilization and accelerate biofuel commercialization. By implementing advanced enzymatic hydrolysis, modern biorefineries are processing crop residues more efficiently, improving fermentable sugar extraction rates by 18%.
  • This technological shift occurs because traditional extraction faces seasonal constraints, pushing operators to adopt hybrid lignocellulosic biomass processing methods. Consequently, facilities incorporating these resilient architectures have reduced operational downtime by 25%, significantly boosting biorefinery operational efficiency. Furthermore, the integration of advanced bioethanol distillation sensors has improved end-product purity tracking, reducing batch rejection rates by 12%.
  • This structural evolution directly impacts business profitability, allowing producers to leverage precision agriculture application data and alternative fuel infrastructure to drive robust biobased product development and advanced biofuel synthesis.

What challenges does the Biofuel From Sugar Crops Industry face during its growth?

  • Feedstock availability and land-use constraints pose persistent structural challenges that limit operational scalability across the industry.

  • Intermittent raw material availability remains a severe structural bottleneck constraining the Biofuel From Sugar Crops supply chain. Erratic climatic patterns disrupt sugar beet biorefining schedules, causing unpredictable fluctuations in molasses fermentation yields and exposing operators to severe margin volatility.
  • Because consistent thermochemical conversion relies heavily on steady biomass inputs, these climate impact mitigation failures have historically increased emergency procurement costs by up to 20%. To counteract these deficits, operators are forced to overinvest in complex vinasse valorization systems, lowering immediate capital efficiency by 15%.
  • This inherent volatility complicates long-term capacity planning, requiring executives to implement sustainable agriculture practices focused on feedstock yield optimization to ensure continuous renewable electricity generation and maintain compliance with rigid supply contracts.

Exclusive Technavio Analysis on Customer Landscape

The biofuel from sugar crops market forecasting report includes the adoption lifecycle of the market, covering from the innovator’s stage to the laggard’s stage. It focuses on adoption rates in different regions based on penetration. Furthermore, the biofuel from sugar crops market report also includes key purchase criteria and drivers of price sensitivity to help companies evaluate and develop their market growth analysis strategies.
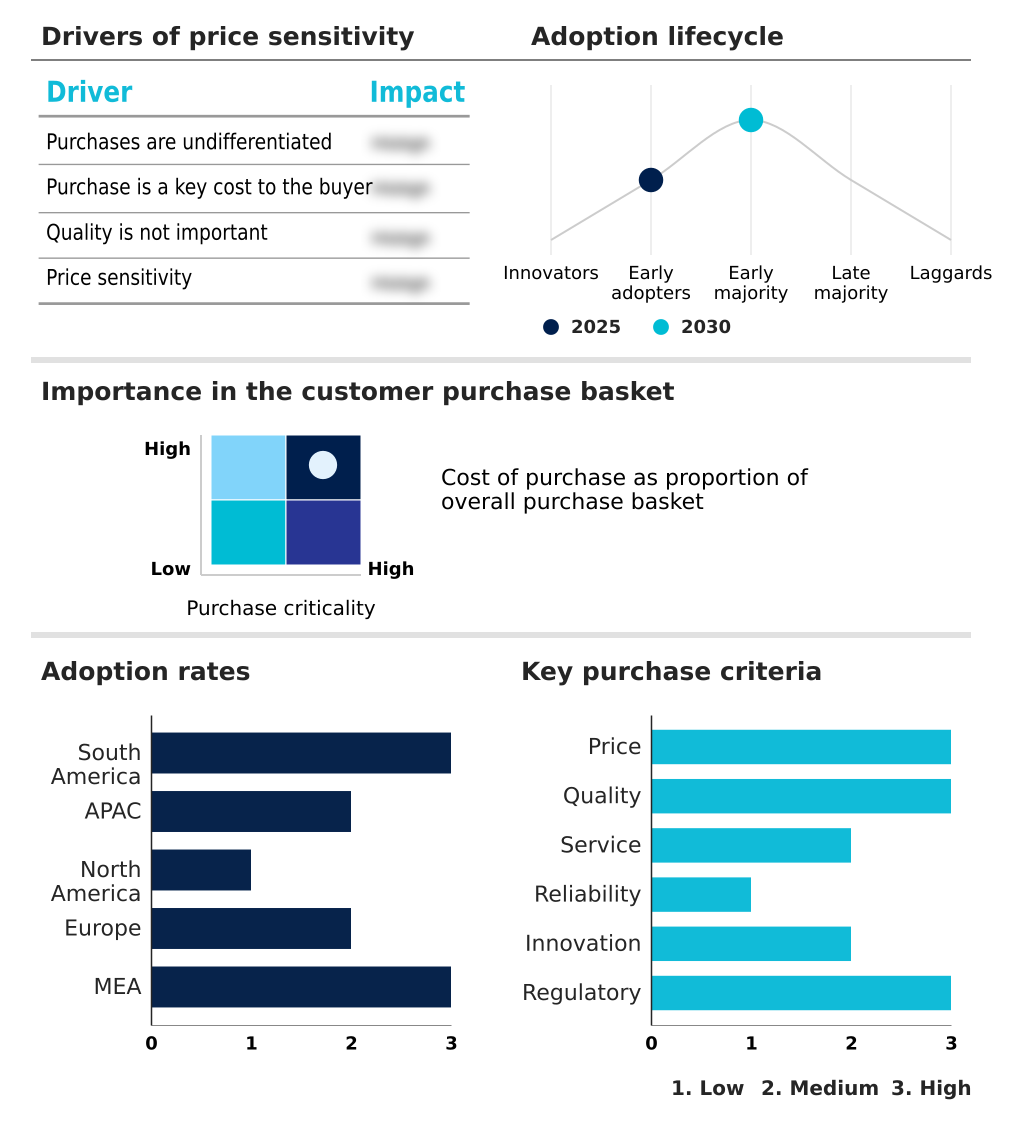
Customer Landscape of Biofuel From Sugar Crops Industry

Competitive Landscape

Companies are implementing various strategies, such as strategic alliances, biofuel from sugar crops market forecast, partnerships, mergers and acquisitions, geographical expansion, and product/service launches, to enhance their presence in the industry.

Adecoagro SA - The provider offers advanced biofuel from sugar crops, including sugarcane-based ethanol and bioenergy derivatives like renewable electricity, to support sustainable transportation and industrial decarbonization initiatives.

The industry research and growth report includes detailed analyses of the competitive landscape of the market and information about key companies, including:

  • Adecoagro SA
  • AGRANA Beteiligungs AG
  • Atvos Agroindustrial S.A.
  • Dalmia Bharat Sugar and Industries
  • Dwarikesh Sugar Industries Ltd
  • EID Parry India Ltd.
  • Mitr Phol Group
  • Nordzucker AG
  • Raizen Energia SA
  • Royal Cosun
  • Shree Renuka Sugars Ltd.
  • Sudzucker AG
  • Tereos SCA
  • Thai Roong Ruang Sugar Group
  • Wilmar International Ltd.

Qualitative and quantitative analysis of companies has been conducted to help clients understand the wider business environment as well as the strengths and weaknesses of key industry players. Data is qualitatively analyzed to categorize companies as pure play, category-focused, industry-focused, and diversified; it is quantitatively analyzed to categorize companies as dominant, leading, strong, tentative, and weak.

Recent Development and News in Biofuel from sugar crops market

  • In the Renewable Electricity industry, the implementation of the EU Carbon Border Adjustment Mechanism has mandated strict carbon intensity tracking for imported energy products, directly impacting Biofuel From Sugar Crops demand by requiring producers to optimize bagasse cogeneration systems to achieve a 15% reduction in facility-level emissions.
  • The expansion of decentralized microgrid infrastructure across agricultural zones has enabled rural processing facilities to monetize surplus power, directly impacting Biofuel From Sugar Crops demand as facilities integrate bioenergy cogeneration to supply up to 25% of local renewable electricity generation.
  • Stringent corporate decarbonization strategy targets across heavy industries have accelerated the transition from fossil-based captive power plants, directly impacting Biofuel From Sugar Crops demand by driving a 30% increase in the utilization of thermochemical conversion processes for industrial biomethane extraction.
  • The standardization of lifecycle carbon emission accounting protocols for alternative fuel infrastructure has penalized high-emission feedstocks, directly impacting Biofuel From Sugar Crops demand by prioritizing sustainable agriculture practices that demonstrably improve feedstock yield optimization by 20% per hectare.

Dive into Technavio’s robust research methodology, blending expert interviews, extensive data synthesis, and validated models for unparalleled Biofuel From Sugar Crops Market insights. See full methodology.

Market Scope
Page number 291
Base year 2025
Historic period 2020-2024
Forecast period 2026-2030
Growth momentum & CAGR Accelerate at a CAGR of 3.2%
Market growth 2026-2030 USD 548.6 million
Market structure Fragmented
YoY growth 2025-2026(%) 3.2%
Key countries Brazil, Argentina, Colombia, India, China, Thailand, Pakistan, Indonesia, Australia, US, Mexico, Canada, France, Germany, Russia, Poland, Ukraine, The Netherlands, Egypt, South Africa, Kenya, Morocco and Algeria
Competitive landscape Leading Companies, Market Positioning of Companies, Competitive Strategies, and Industry Risks

Request Free Sample

Research Analyst Overview

  • The Biofuel From Sugar Crops landscape is undergoing a structural transformation as energy producers optimize sugar crop fermentation capabilities to align with stringent global environmental mandates. Boardroom strategies are increasingly prioritizing the integration of sustainable aviation fuel feedstock into long-term product portfolios to capture premium margins in the decarbonizing aerospace sector.
  • This shift compels executives to recalibrate capital expenditure toward advanced biochemical fermentation pathways and robust lignocellulosic biomass processing infrastructure. Consequently, facilities deploying advanced enzymatic hydrolysis protocols have documented a 20% improvement in fermentable sugar extraction efficiency compared to conventional methodologies, directly enhancing operational margins.
  • Furthermore, the optimization of bioethanol distillation processes and vinasse valorization techniques ensures that biorefineries maximize resource recovery while mitigating waste disposal compliance risks. Decision-makers are aggressively evaluating flex fuel compatibility standards to guarantee that their anhydrous ethanol processing outputs seamlessly integrate with existing distribution networks.
  • By leveraging these sophisticated thermochemical conversion methods, operators establish a resilient, high-yield production ecosystem capable of absorbing raw material volatility and satisfying evolving regulatory demands for low-emission alternative fuels.

What are the Key Data Covered in this Biofuel From Sugar Crops Market Research and Growth Report?

  • What is the expected growth of the Biofuel From Sugar Crops Market between 2026 and 2030?

    • USD 548.6 million, at a CAGR of 3.2%

  • What segmentation does the market report cover?

    • The report is segmented by Application (Aviation, Automotive, Marine, and Power), Type (Ethanol, Biogas, and Others), Source (Sugarcane, Sugar beet, and Others) and Geography (South America, APAC, North America, Europe, Middle East and Africa)

  • Which regions are analyzed in the report?

    • South America, APAC, North America, Europe and Middle East and Africa

  • What are the key growth drivers and market challenges?

    • Renewable fuel blending mandates and energy security objectives, Feedstock availability and land-use constraints

  • Who are the major players in the Biofuel From Sugar Crops Market?

    • Adecoagro SA, AGRANA Beteiligungs AG, Atvos Agroindustrial S.A., Dalmia Bharat Sugar and Industries, Dwarikesh Sugar Industries Ltd, EID Parry India Ltd., Mitr Phol Group, Nordzucker AG, Raizen Energia SA, Royal Cosun, Shree Renuka Sugars Ltd., Sudzucker AG, Tereos SCA, Thai Roong Ruang Sugar Group and Wilmar International Ltd.

Market Research Insights

  • The Biofuel From Sugar Crops Market is evolving rapidly as operators integrate sustainable agriculture practices to improve feedstock yield optimization and meet aggressive decarbonization strategy goals. By leveraging advanced data analytics in supply chain management, biorefineries have reduced logistics downtime by 15%, ensuring a more stable flow of raw materials.
  • Furthermore, the deployment of upgraded alternative fuel infrastructure has improved fuel distribution efficiency by 22%, directly lowering transportation costs for distributors. These operational enhancements allow energy providers to better align with environmental performance standards while displacing conventional fossil fuels.
  • Consequently, optimized renewable electricity generation from crop residues continues to enhance facility-level profitability, providing a resilient operational model amidst fluctuating global energy policies.

We can help! Our analysts can customize this biofuel from sugar crops market research report to meet your requirements.

Get in touch

1. Executive Summary

1.1 Market overview

Executive Summary - Chart on Market Overview
Executive Summary - Data Table on Market Overview
Executive Summary - Chart on Global Market Characteristics
Executive Summary - Chart on Market by Geography
Executive Summary - Chart on Market Segmentation by Application
Executive Summary - Chart on Market Segmentation by Type
Executive Summary - Chart on Market Segmentation by Source
Executive Summary - Chart on Incremental Growth
Executive Summary - Data Table on Incremental Growth
Executive Summary - Chart on Company Market Positioning

2. Technavio Analysis

2.1 Analysis of price sensitivity, lifecycle, customer purchase basket, adoption rates, and purchase criteria

2.2 Criticality of inputs and Factors of differentiation

Chart on Overview on criticality of inputs and factors of differentiation

2.3 Factors of disruption

Chart on Overview on factors of disruption

2.4 Impact of drivers and challenges

Chart on Impact of drivers and challenges in 2025 and 2030

3. Market Landscape

3.1 Market ecosystem

Chart on Parent Market
Data Table on - Parent Market

3.2 Market characteristics

Chart on Market characteristics analysis

3.3 Value chain analysis

Chart on Value chain analysis

4. Market Sizing

4.1 Market definition

Data Table on Offerings of companies included in the market definition

4.2 Market segment analysis

Market segments

4.3 Market size 2025

4.4 Market outlook: Forecast for 2025-2030

Chart on Global - Market size and forecast 2025-2030 ($ million)
Data Table on Global - Market size and forecast 2025-2030 ($ million)
Chart on Global Market: Year-over-year growth 2025-2030 (%)
Data Table on Global Market: Year-over-year growth 2025-2030 (%)

5. Historic Market Size

5.1 Global Biofuel From Sugar Crops Market 2020 - 2024

Historic Market Size - Data Table on Global Biofuel From Sugar Crops Market 2020 - 2024 ($ million)

5.2 Application segment analysis 2020 - 2024

Historic Market Size - Application Segment 2020 - 2024 ($ million)

5.3 Type segment analysis 2020 - 2024

Historic Market Size - Type Segment 2020 - 2024 ($ million)

5.4 Source segment analysis 2020 - 2024

Historic Market Size - Source Segment 2020 - 2024 ($ million)

5.5 Geography segment analysis 2020 - 2024

Historic Market Size - Geography Segment 2020 - 2024 ($ million)

5.6 Country segment analysis 2020 - 2024

Historic Market Size - Country Segment 2020 - 2024 ($ million)

6. Qualitative Analysis

6.1 Impact of AI on global biofuel from sugar crops market

6.2 Impact of geopolitical conflicts on global biofuel from sugar crops market

7. Five Forces Analysis

7.1 Five forces summary

Five forces analysis - Comparison between 2025 and 2030

7.2 Bargaining power of buyers

Bargaining power of buyers - Impact of key factors 2025 and 2030

7.3 Bargaining power of suppliers

Bargaining power of suppliers - Impact of key factors in 2025 and 2030

7.4 Threat of new entrants

Threat of new entrants - Impact of key factors in 2025 and 2030

7.5 Threat of substitutes

Threat of substitutes - Impact of key factors in 2025 and 2030

7.6 Threat of rivalry

Threat of rivalry - Impact of key factors in 2025 and 2030

7.7 Market condition

Chart on Market condition - Five forces 2025 and 2030

8. Market Segmentation by Application

8.1 Market segments

Chart on Application - Market share 2025-2030 (%)
Data Table on Application - Market share 2025-2030 (%)

8.2 Comparison by Application

Chart on Comparison by Application
Data Table on Comparison by Application

8.3 Aviation - Market size and forecast 2025-2030

Chart on Aviation - Market size and forecast 2025-2030 ($ million)
Data Table on Aviation - Market size and forecast 2025-2030 ($ million)
Chart on Aviation - Year-over-year growth 2025-2030 (%)
Data Table on Aviation - Year-over-year growth 2025-2030 (%)

8.4 Automotive - Market size and forecast 2025-2030

Chart on Automotive - Market size and forecast 2025-2030 ($ million)
Data Table on Automotive - Market size and forecast 2025-2030 ($ million)
Chart on Automotive - Year-over-year growth 2025-2030 (%)
Data Table on Automotive - Year-over-year growth 2025-2030 (%)

8.5 Marine - Market size and forecast 2025-2030

Chart on Marine - Market size and forecast 2025-2030 ($ million)
Data Table on Marine - Market size and forecast 2025-2030 ($ million)
Chart on Marine - Year-over-year growth 2025-2030 (%)
Data Table on Marine - Year-over-year growth 2025-2030 (%)

8.6 Power - Market size and forecast 2025-2030

Chart on Power - Market size and forecast 2025-2030 ($ million)
Data Table on Power - Market size and forecast 2025-2030 ($ million)
Chart on Power - Year-over-year growth 2025-2030 (%)
Data Table on Power - Year-over-year growth 2025-2030 (%)

8.7 Market opportunity by Application

Market opportunity by Application ($ million)
Data Table on Market opportunity by Application ($ million)

9. Market Segmentation by Type

9.1 Market segments

Chart on Type - Market share 2025-2030 (%)
Data Table on Type - Market share 2025-2030 (%)

9.2 Comparison by Type

Chart on Comparison by Type
Data Table on Comparison by Type

9.3 Ethanol - Market size and forecast 2025-2030

Chart on Ethanol - Market size and forecast 2025-2030 ($ million)
Data Table on Ethanol - Market size and forecast 2025-2030 ($ million)
Chart on Ethanol - Year-over-year growth 2025-2030 (%)
Data Table on Ethanol - Year-over-year growth 2025-2030 (%)

9.4 Biogas - Market size and forecast 2025-2030

Chart on Biogas - Market size and forecast 2025-2030 ($ million)
Data Table on Biogas - Market size and forecast 2025-2030 ($ million)
Chart on Biogas - Year-over-year growth 2025-2030 (%)
Data Table on Biogas - Year-over-year growth 2025-2030 (%)

9.5 Others - Market size and forecast 2025-2030

Chart on Others - Market size and forecast 2025-2030 ($ million)
Data Table on Others - Market size and forecast 2025-2030 ($ million)
Chart on Others - Year-over-year growth 2025-2030 (%)
Data Table on Others - Year-over-year growth 2025-2030 (%)

9.6 Market opportunity by Type

Market opportunity by Type ($ million)
Data Table on Market opportunity by Type ($ million)

10. Market Segmentation by Source

10.1 Market segments

Chart on Source - Market share 2025-2030 (%)
Data Table on Source - Market share 2025-2030 (%)

10.2 Comparison by Source

Chart on Comparison by Source
Data Table on Comparison by Source

10.3 Sugarcane - Market size and forecast 2025-2030

Chart on Sugarcane - Market size and forecast 2025-2030 ($ million)
Data Table on Sugarcane - Market size and forecast 2025-2030 ($ million)
Chart on Sugarcane - Year-over-year growth 2025-2030 (%)
Data Table on Sugarcane - Year-over-year growth 2025-2030 (%)

10.4 Sugar beet - Market size and forecast 2025-2030

Chart on Sugar beet - Market size and forecast 2025-2030 ($ million)
Data Table on Sugar beet - Market size and forecast 2025-2030 ($ million)
Chart on Sugar beet - Year-over-year growth 2025-2030 (%)
Data Table on Sugar beet - Year-over-year growth 2025-2030 (%)

10.5 Others - Market size and forecast 2025-2030

Chart on Others - Market size and forecast 2025-2030 ($ million)
Data Table on Others - Market size and forecast 2025-2030 ($ million)
Chart on Others - Year-over-year growth 2025-2030 (%)
Data Table on Others - Year-over-year growth 2025-2030 (%)

10.6 Market opportunity by Source

Market opportunity by Source ($ million)
Data Table on Market opportunity by Source ($ million)

11. Customer Landscape

11.1 Customer landscape overview

Analysis of price sensitivity, lifecycle, customer purchase basket, adoption rates, and purchase criteria

12. Geographic Landscape

12.1 Geographic segmentation

Chart on Market share by geography 2025-2030 (%)
Data Table on Market share by geography 2025-2030 (%)

12.2 Geographic comparison

Chart on Geographic comparison
Data Table on Geographic comparison

12.3 South America - Market size and forecast 2025-2030

Chart on South America - Market size and forecast 2025-2030 ($ million)
Data Table on South America - Market size and forecast 2025-2030 ($ million)
Chart on South America - Year-over-year growth 2025-2030 (%)
Data Table on South America - Year-over-year growth 2025-2030 (%)
Chart on Regional Comparison - South America
Data Table on Regional Comparison - South America

12.3.1 Brazil - Market size and forecast 2025-2030

Chart on Brazil - Market size and forecast 2025-2030 ($ million)
Data Table on Brazil - Market size and forecast 2025-2030 ($ million)
Chart on Brazil - Year-over-year growth 2025-2030 (%)
Data Table on Brazil - Year-over-year growth 2025-2030 (%)

12.3.2 Argentina - Market size and forecast 2025-2030

Chart on Argentina - Market size and forecast 2025-2030 ($ million)
Data Table on Argentina - Market size and forecast 2025-2030 ($ million)
Chart on Argentina - Year-over-year growth 2025-2030 (%)
Data Table on Argentina - Year-over-year growth 2025-2030 (%)

12.3.3 Colombia - Market size and forecast 2025-2030

Chart on Colombia - Market size and forecast 2025-2030 ($ million)
Data Table on Colombia - Market size and forecast 2025-2030 ($ million)
Chart on Colombia - Year-over-year growth 2025-2030 (%)
Data Table on Colombia - Year-over-year growth 2025-2030 (%)

12.4 APAC - Market size and forecast 2025-2030

Chart on APAC - Market size and forecast 2025-2030 ($ million)
Data Table on APAC - Market size and forecast 2025-2030 ($ million)
Chart on APAC - Year-over-year growth 2025-2030 (%)
Data Table on APAC - Year-over-year growth 2025-2030 (%)
Chart on Regional Comparison - APAC
Data Table on Regional Comparison - APAC

12.4.1 India - Market size and forecast 2025-2030

Chart on India - Market size and forecast 2025-2030 ($ million)
Data Table on India - Market size and forecast 2025-2030 ($ million)
Chart on India - Year-over-year growth 2025-2030 (%)
Data Table on India - Year-over-year growth 2025-2030 (%)

12.4.2 China - Market size and forecast 2025-2030

Chart on China - Market size and forecast 2025-2030 ($ million)
Data Table on China - Market size and forecast 2025-2030 ($ million)
Chart on China - Year-over-year growth 2025-2030 (%)
Data Table on China - Year-over-year growth 2025-2030 (%)

12.4.3 Thailand - Market size and forecast 2025-2030

Chart on Thailand - Market size and forecast 2025-2030 ($ million)
Data Table on Thailand - Market size and forecast 2025-2030 ($ million)
Chart on Thailand - Year-over-year growth 2025-2030 (%)
Data Table on Thailand - Year-over-year growth 2025-2030 (%)

12.4.4 Pakistan - Market size and forecast 2025-2030

Chart on Pakistan - Market size and forecast 2025-2030 ($ million)
Data Table on Pakistan - Market size and forecast 2025-2030 ($ million)
Chart on Pakistan - Year-over-year growth 2025-2030 (%)
Data Table on Pakistan - Year-over-year growth 2025-2030 (%)

12.4.5 Indonesia - Market size and forecast 2025-2030

Chart on Indonesia - Market size and forecast 2025-2030 ($ million)
Data Table on Indonesia - Market size and forecast 2025-2030 ($ million)
Chart on Indonesia - Year-over-year growth 2025-2030 (%)
Data Table on Indonesia - Year-over-year growth 2025-2030 (%)

12.4.6 Australia - Market size and forecast 2025-2030

Chart on Australia - Market size and forecast 2025-2030 ($ million)
Data Table on Australia - Market size and forecast 2025-2030 ($ million)
Chart on Australia - Year-over-year growth 2025-2030 (%)
Data Table on Australia - Year-over-year growth 2025-2030 (%)

12.5 North America - Market size and forecast 2025-2030

Chart on North America - Market size and forecast 2025-2030 ($ million)
Data Table on North America - Market size and forecast 2025-2030 ($ million)
Chart on North America - Year-over-year growth 2025-2030 (%)
Data Table on North America - Year-over-year growth 2025-2030 (%)
Chart on Regional Comparison - North America
Data Table on Regional Comparison - North America

12.5.1 US - Market size and forecast 2025-2030

Chart on US - Market size and forecast 2025-2030 ($ million)
Data Table on US - Market size and forecast 2025-2030 ($ million)
Chart on US - Year-over-year growth 2025-2030 (%)
Data Table on US - Year-over-year growth 2025-2030 (%)

12.5.2 Mexico - Market size and forecast 2025-2030

Chart on Mexico - Market size and forecast 2025-2030 ($ million)
Data Table on Mexico - Market size and forecast 2025-2030 ($ million)
Chart on Mexico - Year-over-year growth 2025-2030 (%)
Data Table on Mexico - Year-over-year growth 2025-2030 (%)

12.5.3 Canada - Market size and forecast 2025-2030

Chart on Canada - Market size and forecast 2025-2030 ($ million)
Data Table on Canada - Market size and forecast 2025-2030 ($ million)
Chart on Canada - Year-over-year growth 2025-2030 (%)
Data Table on Canada - Year-over-year growth 2025-2030 (%)

12.6 Europe - Market size and forecast 2025-2030

Chart on Europe - Market size and forecast 2025-2030 ($ million)
Data Table on Europe - Market size and forecast 2025-2030 ($ million)
Chart on Europe - Year-over-year growth 2025-2030 (%)
Data Table on Europe - Year-over-year growth 2025-2030 (%)
Chart on Regional Comparison - Europe
Data Table on Regional Comparison - Europe

12.6.1 France - Market size and forecast 2025-2030

Chart on France - Market size and forecast 2025-2030 ($ million)
Data Table on France - Market size and forecast 2025-2030 ($ million)
Chart on France - Year-over-year growth 2025-2030 (%)
Data Table on France - Year-over-year growth 2025-2030 (%)

12.6.2 Germany - Market size and forecast 2025-2030

Chart on Germany - Market size and forecast 2025-2030 ($ million)
Data Table on Germany - Market size and forecast 2025-2030 ($ million)
Chart on Germany - Year-over-year growth 2025-2030 (%)
Data Table on Germany - Year-over-year growth 2025-2030 (%)

12.6.3 Russia - Market size and forecast 2025-2030

Chart on Russia - Market size and forecast 2025-2030 ($ million)
Data Table on Russia - Market size and forecast 2025-2030 ($ million)
Chart on Russia - Year-over-year growth 2025-2030 (%)
Data Table on Russia - Year-over-year growth 2025-2030 (%)

12.6.4 Poland - Market size and forecast 2025-2030

Chart on Poland - Market size and forecast 2025-2030 ($ million)
Data Table on Poland - Market size and forecast 2025-2030 ($ million)
Chart on Poland - Year-over-year growth 2025-2030 (%)
Data Table on Poland - Year-over-year growth 2025-2030 (%)

12.6.5 Ukraine - Market size and forecast 2025-2030

Chart on Ukraine - Market size and forecast 2025-2030 ($ million)
Data Table on Ukraine - Market size and forecast 2025-2030 ($ million)
Chart on Ukraine - Year-over-year growth 2025-2030 (%)
Data Table on Ukraine - Year-over-year growth 2025-2030 (%)

12.6.6 The Netherlands - Market size and forecast 2025-2030

Chart on The Netherlands - Market size and forecast 2025-2030 ($ million)
Data Table on The Netherlands - Market size and forecast 2025-2030 ($ million)
Chart on The Netherlands - Year-over-year growth 2025-2030 (%)
Data Table on The Netherlands - Year-over-year growth 2025-2030 (%)

12.7 Middle East and Africa - Market size and forecast 2025-2030

Chart on Middle East and Africa - Market size and forecast 2025-2030 ($ million)
Data Table on Middle East and Africa - Market size and forecast 2025-2030 ($ million)
Chart on Middle East and Africa - Year-over-year growth 2025-2030 (%)
Data Table on Middle East and Africa - Year-over-year growth 2025-2030 (%)
Chart on Regional Comparison - Middle East and Africa
Data Table on Regional Comparison - Middle East and Africa

12.7.1 Egypt - Market size and forecast 2025-2030

Chart on Egypt - Market size and forecast 2025-2030 ($ million)
Data Table on Egypt - Market size and forecast 2025-2030 ($ million)
Chart on Egypt - Year-over-year growth 2025-2030 (%)
Data Table on Egypt - Year-over-year growth 2025-2030 (%)

12.7.2 South Africa - Market size and forecast 2025-2030

Chart on South Africa - Market size and forecast 2025-2030 ($ million)
Data Table on South Africa - Market size and forecast 2025-2030 ($ million)
Chart on South Africa - Year-over-year growth 2025-2030 (%)
Data Table on South Africa - Year-over-year growth 2025-2030 (%)

12.7.3 Kenya - Market size and forecast 2025-2030

Chart on Kenya - Market size and forecast 2025-2030 ($ million)
Data Table on Kenya - Market size and forecast 2025-2030 ($ million)
Chart on Kenya - Year-over-year growth 2025-2030 (%)
Data Table on Kenya - Year-over-year growth 2025-2030 (%)

12.7.4 Morocco - Market size and forecast 2025-2030

Chart on Morocco - Market size and forecast 2025-2030 ($ million)
Data Table on Morocco - Market size and forecast 2025-2030 ($ million)
Chart on Morocco - Year-over-year growth 2025-2030 (%)
Data Table on Morocco - Year-over-year growth 2025-2030 (%)

12.7.5 Algeria - Market size and forecast 2025-2030

Chart on Algeria - Market size and forecast 2025-2030 ($ million)
Data Table on Algeria - Market size and forecast 2025-2030 ($ million)
Chart on Algeria - Year-over-year growth 2025-2030 (%)
Data Table on Algeria - Year-over-year growth 2025-2030 (%)

12.8 Market opportunity by geography

Market opportunity by geography ($ million)
Data Tables on Market opportunity by geography ($ million)

13. Drivers, Challenges, and Opportunity

13.1 Market drivers

Renewable fuel blending mandates and energy security objectives
Advancements in biorefinery efficiency and byproduct utilization
Expanding use of flex fuel vehicles across emerging economies

13.2 Market challenges

Feedstock availability and land-use constraints
Policy and regulatory uncertainty
High logistics and infrastructure dependency

13.3 Impact of drivers and challenges

Impact of drivers and challenges in 2025 and 2030

13.4 Market opportunities

Development of biofuel and sustainable aviation fuel integration pathways
Cross industry partnerships between agriculture and energy companies
Rising investments in ethanol production capacity expansion

14. Competitive Landscape

14.1 Overview

14.2

Overview on criticality of inputs and factors of differentiation

14.3 Landscape disruption

Overview on factors of disruption

14.4 Industry risks

Impact of key risks on business

15. Competitive Analysis

15.1 Companies profiled

Companies covered

15.2 Company ranking index

15.3 Market positioning of companies

Matrix on companies position and classification

15.4 Adecoagro SA

Adecoagro SA - Overview
Adecoagro SA - Product / Service
Adecoagro SA - Key offerings
SWOT

15.5 AGRANA Beteiligungs AG

AGRANA Beteiligungs AG - Overview
AGRANA Beteiligungs AG - Business segments
AGRANA Beteiligungs AG - Key offerings
AGRANA Beteiligungs AG - Segment focus
SWOT

15.6 Atvos Agroindustrial S.A.

Atvos Agroindustrial S.A. - Overview
Atvos Agroindustrial S.A. - Product / Service
Atvos Agroindustrial S.A. - Key offerings
SWOT

15.7 Dalmia Bharat Sugar and Industries

Dalmia Bharat Sugar and Industries - Overview
Dalmia Bharat Sugar and Industries - Business segments
Dalmia Bharat Sugar and Industries - Key offerings
Dalmia Bharat Sugar and Industries - Segment focus
SWOT

15.8 Dwarikesh Sugar Industries Ltd

Dwarikesh Sugar Industries Ltd - Overview
Dwarikesh Sugar Industries Ltd - Business segments
Dwarikesh Sugar Industries Ltd - Key offerings
Dwarikesh Sugar Industries Ltd - Segment focus
SWOT

15.9 EID Parry India Ltd.

EID Parry India Ltd. - Overview
EID Parry India Ltd. - Business segments
EID Parry India Ltd. - Key offerings
EID Parry India Ltd. - Segment focus
SWOT

15.10 Mitr Phol Group

Mitr Phol Group - Overview
Mitr Phol Group - Product / Service
Mitr Phol Group - Key offerings
SWOT

15.11 Nordzucker AG

Nordzucker AG - Overview
Nordzucker AG - Product / Service
Nordzucker AG - Key offerings
SWOT

15.12 Raizen Energia SA

Raizen Energia SA - Overview
Raizen Energia SA - Product / Service
Raizen Energia SA - Key offerings
SWOT

15.13 Royal Cosun

Royal Cosun - Overview
Royal Cosun - Product / Service
Royal Cosun - Key offerings
SWOT

15.14 Shree Renuka Sugars Ltd.

Shree Renuka Sugars Ltd. - Overview
Shree Renuka Sugars Ltd. - Product / Service
Shree Renuka Sugars Ltd. - Key offerings
SWOT

15.15 Sudzucker AG

Sudzucker AG - Overview
Sudzucker AG - Product / Service
Sudzucker AG - Key offerings
SWOT

15.16 Tereos SCA

Tereos SCA - Overview
Tereos SCA - Product / Service
Tereos SCA - Key offerings
SWOT

15.17 Thai Roong Ruang Sugar Group

Thai Roong Ruang Sugar Group - Overview
Thai Roong Ruang Sugar Group - Product / Service
Thai Roong Ruang Sugar Group - Key offerings
SWOT

15.18 Wilmar International Ltd.

Wilmar International Ltd. - Overview
Wilmar International Ltd. - Business segments
Wilmar International Ltd. - Key offerings
Wilmar International Ltd. - Segment focus
SWOT

16. Appendix

16.1 Scope of the report

Market definition
Objectives
Notes and caveats

16.2 Inclusions and exclusions checklist

Inclusions checklist
Exclusions checklist

16.3 Currency conversion rates for US$

16.4 Research methodology

16.5 Data procurement

Information sources

16.6 Data validation

16.7 Validation techniques employed for market sizing

16.8 Data synthesis

16.9 360 degree market analysis

16.10 List of abbreviations

Research Methodology

Technavio presents a detailed picture of the market by way of study, synthesis, and summation of data from multiple sources. The analysts have presented the various facets of the market with a particular focus on identifying the key industry influencers. The data thus presented is comprehensive, reliable, and the result of extensive research, both primary and secondary.

INFORMATION SOURCES

Primary sources

  • Manufacturers and suppliers
  • Channel partners
  • Industry experts
  • Strategic decision makers

Secondary sources

  • Industry journals and periodicals
  • Government data
  • Financial reports of key industry players
  • Historical data
  • Press releases

DATA ANALYSIS

Data Synthesis

  • Collation of data
  • Estimation of key figures
  • Analysis of derived insights

Data Validation

  • Triangulation with data models
  • Reference against proprietary databases
  • Corroboration with industry experts

REPORT WRITING

Qualitative

  • Market drivers
  • Market challenges
  • Market trends
  • Five forces analysis

Quantitative

  • Market size and forecast
  • Market segmentation
  • Geographical insights
  • Competitive landscape

Interested in this report?

Get your sample now to see our research methodology and insights!

Download Now

Frequently Asked Questions

Biofuel From Sugar Crops market growth will increase by USD 548.6 million during 2026-2030.

The Biofuel From Sugar Crops market is expected to grow at a CAGR of 3.2% during 2026-2030.

Biofuel From Sugar Crops market is segmented by Application (Aviation, Automotive, Marine, Power) Type (Ethanol, Biogas, Others) Source (Sugarcane, Sugar beet, Others)

Adecoagro SA, AGRANA Beteiligungs AG, Atvos Agroindustrial S.A., Dalmia Bharat Sugar and Industries, Dwarikesh Sugar Industries Ltd, EID Parry India Ltd., Mitr Phol Group, Nordzucker AG, Raizen Energia SA, Royal Cosun, Shree Renuka Sugars Ltd., Sudzucker AG, Tereos SCA, Thai Roong Ruang Sugar Group, Wilmar International Ltd. are a few of the key vendors in the Biofuel From Sugar Crops market.

South America will register the highest growth rate of 43% among the other regions. Therefore, the Biofuel From Sugar Crops market in South America is expected to garner significant business opportunities for the vendors during the forecast period.

Brazil, Argentina, Colombia, India, China, Thailand, Pakistan, Indonesia, Australia, US, Mexico, Canada, France, Germany, Russia, Poland, Ukraine, The Netherlands, Egypt, South Africa, Kenya, Morocco, Algeria

  • Renewable fuel blending mandates and energy security objectives is the driving factor this market.

The Biofuel From Sugar Crops market vendors should focus on grabbing business opportunities from the Application segment as it accounted for the largest market share in the base year.
RIA - Research AI Assistant
Ask RIA
