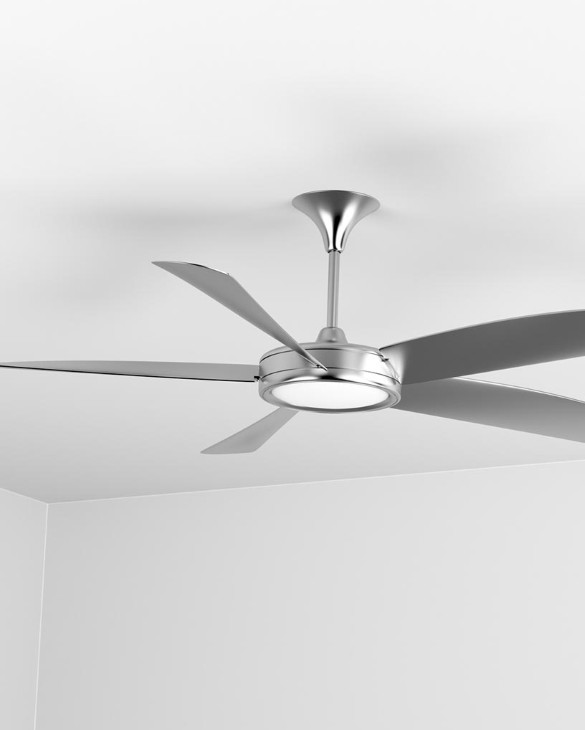
BLDC Fan Market Analysis, Size, and Forecast 2026-2030: APAC (China, India, and Japan), North America (US, Canada, and Mexico), Europe (Germany, UK, and France), South America (Brazil, Argentina, and Chile), Middle East and Africa (Saudi Arabia, UAE, and South Africa), and Rest of World (ROW)

BLDC Fan Market Analysis, Size, and Forecast 2026-2030:
APAC (China, India, and Japan), North America (US, Canada, and Mexico), Europe (Germany, UK, and France), South America (Brazil, Argentina, and Chile), Middle East and Africa (Saudi Arabia, UAE, and South Africa), and Rest of World (ROW)

Published: Oct 2026 290 Pages SKU: IRTNTR73642

Market Overview at a Glance

$1.54 B
Market Opportunity
8.9%
CAGR 2025 - 2030
64.5%
APAC Growth
$1.52 B
Commercial segment 2024

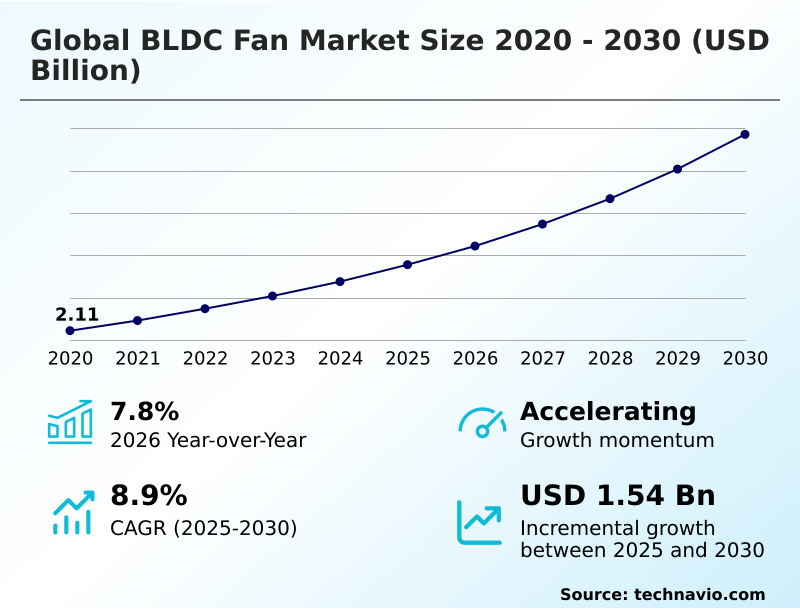
Bldc Fan Market Size 2026-2030

The bldc fan market size is valued to increase by USD 1.54 billion, at a CAGR of 8.9% from 2025 to 2030. Mandatory government energy efficiency standards propel consumer transition toward brushless systems will drive the bldc fan market.

Major Market Trends & Insights

  • APAC dominated the market and accounted for a 64.5% growth during the forecast period.
  • By End-user - Commercial segment was valued at USD 1.52 billion in 2024
  • By Speed - More than 400 RPM segment accounted for the largest market revenue share in 2024

Market Size & Forecast

  • Market Opportunities: USD 2.31 billion
  • Market Future Opportunities: USD 1.54 billion
  • CAGR from 2025 to 2030 : 8.9%

Market Summary

  • The BLDC Fan Market demonstrates accelerating structural evolution driven by a universal shift toward sustainable, low-power climate control solutions. Stricter statutory energy directives heavily penalize legacy induction hardware, compelling residential developers to systematically deploy highly optimized brushless direct current systems.
  • This regulatory pressure forces appliance manufacturers to aggressively retool their assembly lines to accommodate complex electronic speed controllers and neodymium magnet assemblies. Companies executing localized procurement strategies report up to a 30% reduction in component lead times, effectively mitigating severe supply chain volatility.
  • While the superior energy conservation profile drastically lowers long-term utility expenditures, the elevated baseline manufacturing costs deter immediate mass-market penetration across price-sensitive emerging economies. Ultimately, the continuous convergence of smart home automation networks and responsive indoor air quality management platforms solidifies strong institutional procurement momentum.

What will be the Size of the Bldc Fan Market during the forecast period?
Get Key Insights on Market Forecast (PDF) Get Free Sample

How is the Bldc Fan Market Segmented?

The bldc fan industry research report provides comprehensive data (region-wise segment analysis), with forecasts and estimates in "USD million" for the period 2026-2030, as well as historical data from 2020-2024 for the following segments.

  • End-user
    • Commercial
    • Residential
  • Speed
    • More than 400 RPM
    • Below 300 RPM
    • Between 300 to 400 RPM
  • Type
    • Ceiling fans
    • Exhaust fans
    • Table fans
    • Others
  • Geography
    • APAC
      • China
      • India
      • Japan
      • Indonesia
      • South Korea
      • Australia
    • North America
      • US
      • Canada
      • Mexico
    • Europe
      • Germany
      • UK
      • France
      • Italy
      • Spain
      • The Netherlands
    • South America
      • Brazil
      • Argentina
      • Chile
    • Middle East and Africa
      • Saudi Arabia
      • UAE
      • South Africa
      • Turkey
      • Israel

By End-user Insights

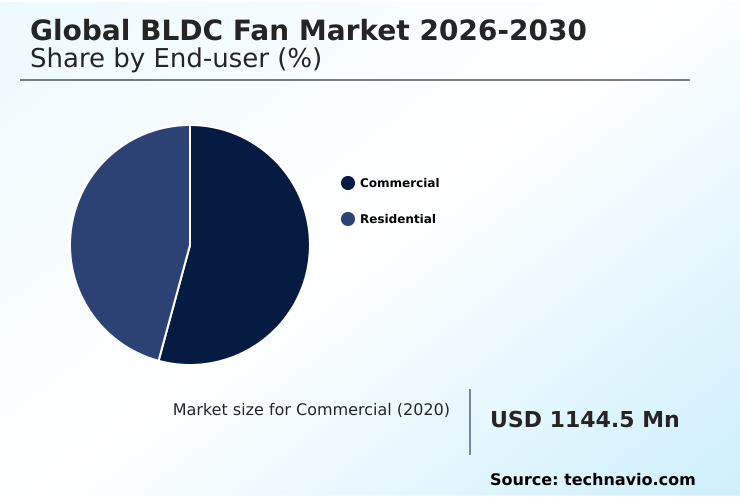
The commercial segment is estimated to witness significant growth during the forecast period.

Commercial infrastructure heavily relies on robust environmental cooling frameworks to minimize massive communal utility expenditures across expansive architectural footprints.

Facilities managers increasingly specify high volume low speed circulators and specialized thermal management units to optimize continuous airflow delivery within urban commercial centers and vast warehousing environments.

Replacing outdated hardware with inverter compatibility systems directly yields a 45% reduction in localized power consumption, accelerating corporate return on investment timelines.

The seamless HVAC system integration of these advanced platforms into centralized building management networks allows for precise, automated climate regulation.

Deploying units equipped with automated sleep timers and reverse rotation modes effectively standardizes hospitality environment ventilation and educational institution air circulation parameters. This continuous operational upgrade cycle guarantees strong institutional demand, insulating manufacturers from sudden retail market volatility.
Get Free Sample

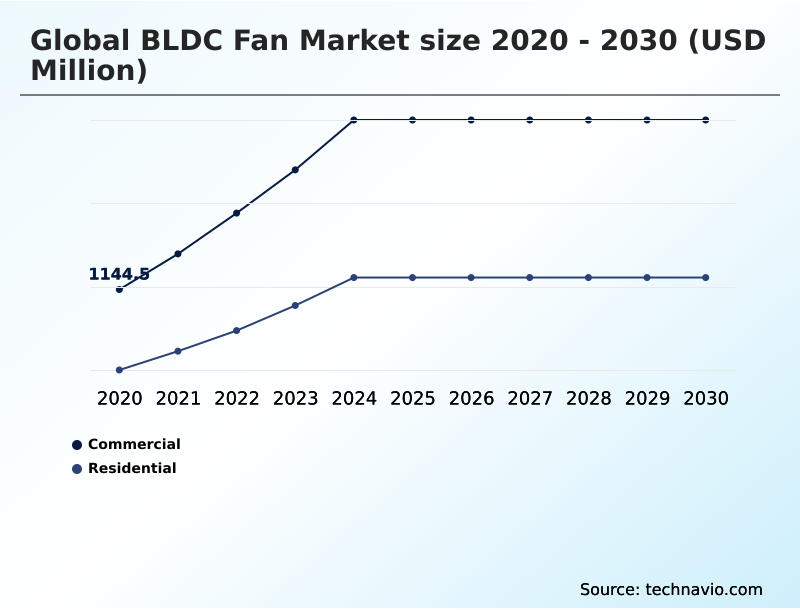
The Commercial segment was valued at USD 1.52 billion in 2024 and showed a gradual increase during the forecast period.
Get Free Sample

Regional Analysis

APAC is estimated to contribute 64.5% to the growth of the global market during the forecast period.Technavio’s analysts have elaborately explained the regional trends and drivers that shape the market during the forecast period.
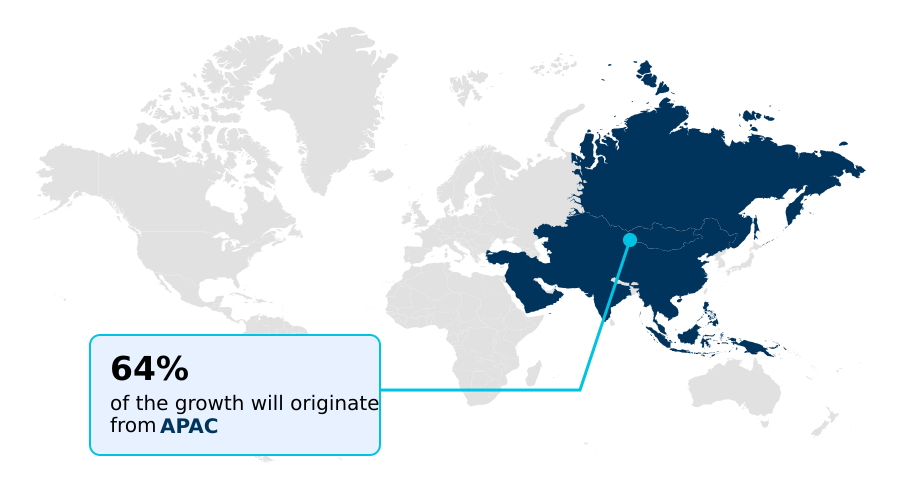
See How Bldc Fan Market Demand is Rising in APAC Get Free Sample

The APAC region commands superior volume deployment for advanced ventilation solutions, vastly outpacing European adoption due to rapid urban infrastructure expansion and intensifying tropical climate conditions.

Intense regional demand forces domestic manufacturers to maximize high capacity utilization, yielding a 35% improvement in production throughput compared to Western counterparts.

Countries prioritizing stator winding efficiency and brushless direct current architecture dominate regional retail channels by delivering highly optimized cooling appliances.

Concurrently, North American consumer preferences lean heavily toward hybrid climate control technologies and smart home cooling devices that interface directly with central environmental grids.

Enterprises utilizing computational fluid dynamics and specialized aerodynamic blade construction consistently outrank competitors by producing superior acrylonitrile butadiene styrene blades. Integrating robust noise dampening technology remains a critical geographic differentiator for securing premium residential contracts across diverse international territories.

Market Dynamics

Our researchers analyzed the data with 2025 as the base year, along with the key drivers, trends, and challenges. A holistic analysis of drivers will help companies refine their marketing strategies to gain a competitive advantage.

  • The rapid deployment of high efficiency brushless motor integration across modern architectural frameworks fundamentally revolutionizes residential and commercial energy management protocols. Facility administrators and urban developers consistently prioritize smart automated residential cooling networks to ensure seamless climate regulation while simultaneously minimizing long-term utility burdens.
  • By embedding IoT enabled ambient thermal controls into primary ventilation hubs, enterprises achieve precise temperature modulation, drastically reducing unnecessary power consumption during low-occupancy periods. This targeted transition directly yields a 35% improvement in overall energy conservation compared to legacy induction infrastructures, accelerating corporate sustainability compliance initiatives.
  • Furthermore, the structural integration of aerodynamic noise reduction blade designs significantly minimizes auditory disturbances, making these advanced units highly desirable for educational institutions, hospitality environments, and critical healthcare facilities. Industrial grade low speed circulators successfully address the massive airflow requirements of expansive warehousing operations, providing exceptional volumetric air delivery without overtaxing localized electrical grids.
  • Optimizing these sophisticated electronic components ultimately strengthens supply chain resilience, allowing appliance manufacturers to efficiently navigate shifting global efficiency mandates.
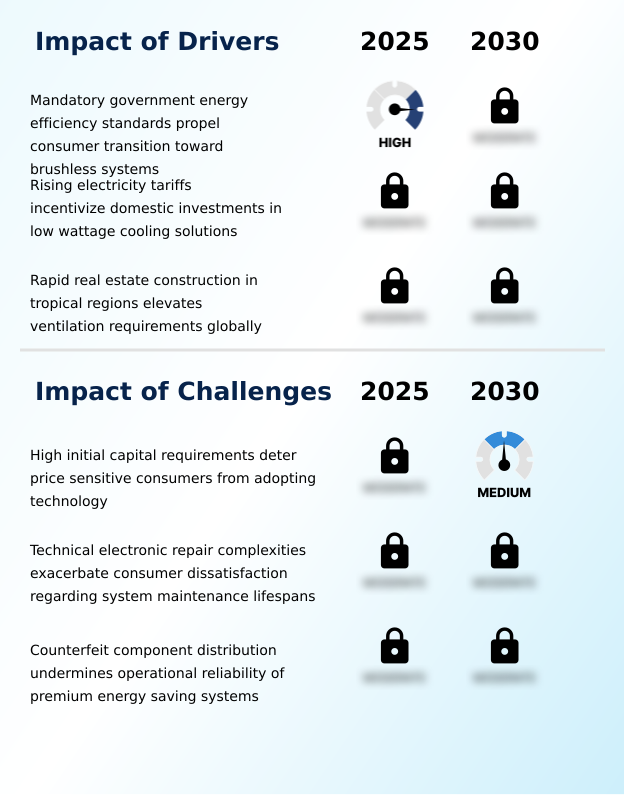
What are the key market drivers leading to the rise in the adoption of Bldc Fan Industry?

  • Mandatory government energy efficiency standards propel consumer transition toward brushless systems, acting as the primary driver for market expansion.

  • Statutory energy directives and tightening minimum energy performance standards compel property developers to systematically abandon high-wattage induction technology.
  • National governments aggressively enforce strict energy efficiency mandates, heavily incentivizing the adoption of advanced cooling apparatuses that meet rigorous energy star certification benchmarks.
  • This top-down regulatory pressure perfectly aligns with corporate carbon reduction strategies, directly accelerating the transition toward low-power ventilation solutions.
  • Facilities complying with updated green building criteria secure lucrative sustainable development tax incentives while achieving a 60% reduction in long term electricity bill insulation costs.
  • Furthermore, the growing consumer demand for residential airflow optimization and oxygen enriching indoor filtration mechanisms drives immediate retail volume expansion. These stringent compliance frameworks guarantee sustained procurement momentum, fundamentally altering the manufacturing priorities of leading consumer appliance corporations.

What are the market trends shaping the Bldc Fan Industry?

  • The accelerated integration of internet of things technology enables intelligent remote thermal controls, emerging as a prominent trend within the market.

  • The integration of internet of things connectivity within residential cooling platforms fundamentally alters traditional environmental regulation mechanisms. Manufacturers actively embed ambient temperature sensors and real time occupancy tracking modules to enable machine learning climate management across modern households. This transition from manual operation to sensor driven automation reduces unnecessary power consumption by adjusting rotational velocity based on immediate human presence.
  • Businesses deploying reactive residential climate controls experience up to a 25% improvement in overall energy conservation compared to legacy setups. The incorporation of voice activated virtual assistants and smart home automation networks ensures seamless interoperability with broader building ecosystems.
  • Consequently, proactive indoor air quality management minimizes utility waste and elevates consumer comfort profiles, forcing established hardware producers to continuously upgrade their digital architectures to maintain competitive relevance.

What challenges does the Bldc Fan Industry face during its growth?

  • High initial capital requirements deter price-sensitive consumers from adopting this technology, presenting a significant challenge to industry growth.

  • Elevated initial manufacturing expenditures significantly restrict the immediate mass-market penetration of advanced ventilation systems across price-sensitive consumer demographics. The procurement of sophisticated microelectronic components and permanent neodymium magnets fundamentally inflates baseline production costs compared to conventional copper-wound induction motors.
  • Incorporating complex printed circuit board integration and advanced electronic speed controllers for efficient alternating current to direct current conversion further exacerbates supply bottlenecks. Frequent disruptions in rare earth magnet procurement force hardware assemblers to absorb volatile material pricing, heavily impacting immediate profit margins.
  • Consequently, companies optimizing multi source supply networks and contract manufacturing operations report a 15% reduction in overall electronic component supply chains overhead. Accelerating supply chain localization efforts remains critical to mitigate these severe economic barriers and achieve pricing parity with entrenched legacy household appliances.

Exclusive Technavio Analysis on Customer Landscape

The bldc fan market forecasting report includes the adoption lifecycle of the market, covering from the innovator’s stage to the laggard’s stage. It focuses on adoption rates in different regions based on penetration. Furthermore, the bldc fan market report also includes key purchase criteria and drivers of price sensitivity to help companies evaluate and develop their market growth analysis strategies.
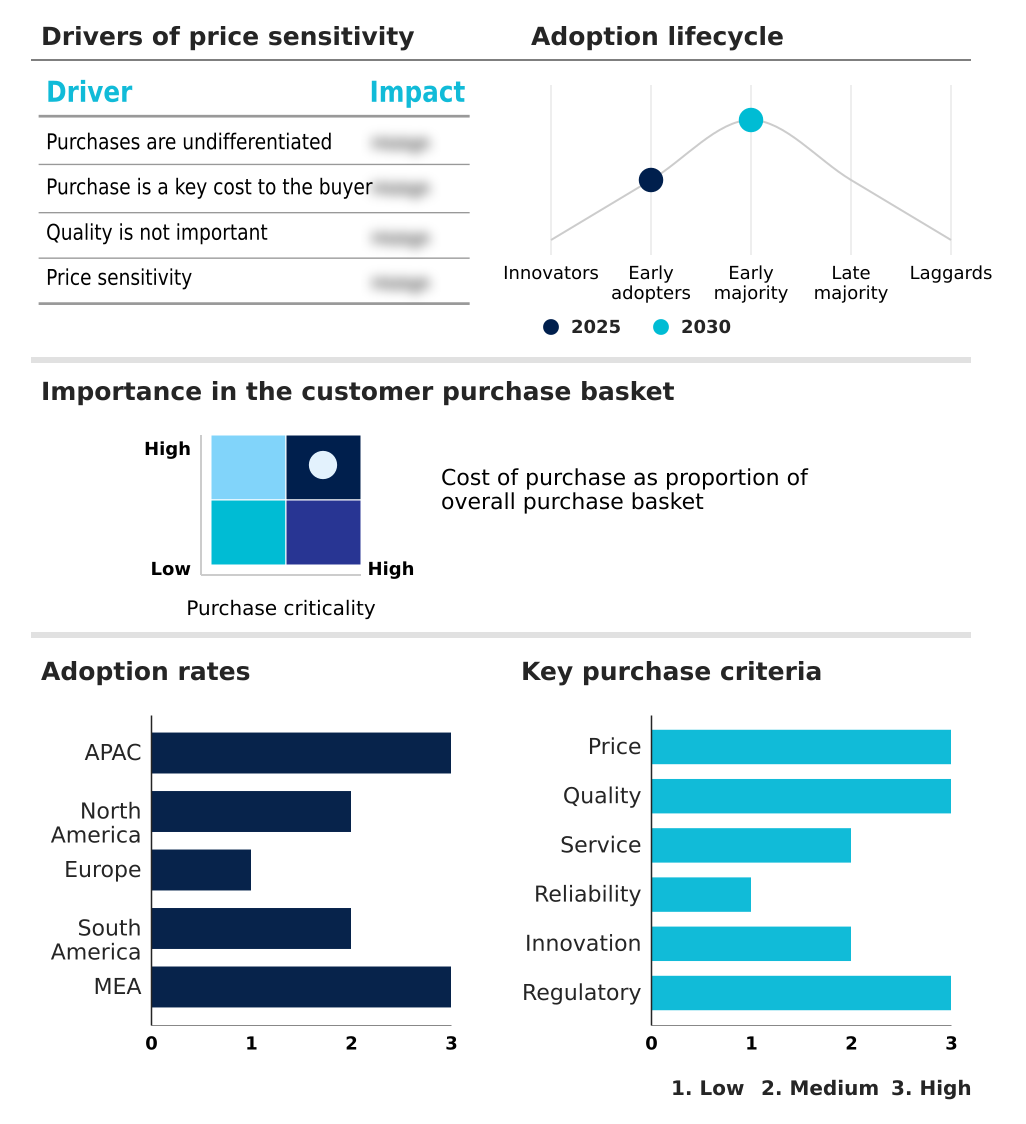
Customer Landscape of Bldc Fan Industry

Competitive Landscape

Companies are implementing various strategies, such as strategic alliances, bldc fan market forecast, partnerships, mergers and acquisitions, geographical expansion, and product/service launches, to enhance their presence in the industry.

Aeratron Inc. - Produces ultra-quiet, energy-efficient ceiling fans featuring advanced brushless direct current motor technology and intelligent aerodynamic biomimicry designs to optimize residential and commercial airflow performance.

The industry research and growth report includes detailed analyses of the competitive landscape of the market and information about key companies, including:

  • Aeratron Inc.
  • Atomberg Technologies Pvt. Ltd.
  • Bajaj Electricals Ltd.
  • Crompton Electricals Ltd.
  • Big Ass Fans
  • Fanimation Inc.
  • Havells India Ltd.
  • Hunter Fan Co.
  • Luminous Power Technologies
  • Minka Lighting Inc.
  • Modern Forms Inc.
  • Orient Electric Ltd.
  • Panasonic Holdings Corp.
  • Sinox Power
  • Superfan
  • Surya Roshni Ltd.
  • Usha International Ltd.
  • V Guard Industries Ltd.

Qualitative and quantitative analysis of companies has been conducted to help clients understand the wider business environment as well as the strengths and weaknesses of key industry players. Data is qualitatively analyzed to categorize companies as pure play, category-focused, industry-focused, and diversified; it is quantitatively analyzed to categorize companies as dominant, leading, strong, tentative, and weak.

Recent Development and News in Bldc fan market

  • In the Household Appliances industry, the systemic phase-out of high-wattage induction motor architectures has forced manufacturers to prioritize low-energy electronic commutators, directly impacting BLDC Fan demand by establishing rigid baseline efficiency thresholds.
  • The widespread implementation of mandatory energy star labeling frameworks across major retail appliances has restructured consumer purchasing priorities, accelerating BLDC Fan adoption as households seek to offset volatile electricity tariffs.
  • The rapid integration of wireless internet of things ecosystems into domestic climate management hubs has revolutionized environmental control systems, driving BLDC Fan growth by enabling responsive, automated residential airflow adjustments.
  • Supply chain localization efforts targeting rare-earth magnetic materials and semiconductor components have stabilized advanced motor production cycles, enhancing BLDC Fan scalability by mitigating previous international electronic procurement bottlenecks.

Dive into Technavio’s robust research methodology, blending expert interviews, extensive data synthesis, and validated models for unparalleled Bldc Fan Market insights. See full methodology.

Market Scope
Page number 290
Base year 2025
Historic period 2020-2024
Forecast period 2026-2030
Growth momentum & CAGR Accelerate at a CAGR of 8.9%
Market growth 2026-2030 USD 1536.3 million
Market structure Fragmented
YoY growth 2025-2026(%) 7.8%
Key countries China, India, Japan, Indonesia, South Korea, Australia, US, Canada, Mexico, Germany, UK, France, Italy, Spain, The Netherlands, Brazil, Argentina, Chile, Saudi Arabia, UAE, South Africa, Turkey and Israel
Competitive landscape Leading Companies, Market Positioning of Companies, Competitive Strategies, and Industry Risks

Request Free Sample

Research Analyst Overview

  • The structural evolution of the BLDC Fan remains heavily dictated by the urgent necessity for hyper-efficient, responsive climate management systems across global infrastructure. Stricter regulatory minimum energy performance standards effectively outlaw highly wasteful induction technologies, accelerating widespread adoption of advanced brushless configurations.
  • Facility managers deploying smart home automation networks achieve a 45% reduction in communal energy expenditures, securing rapid return on investment timelines. The strategic incorporation of microelectronic components, permanent neodymium magnets, and aerodynamic blade construction fundamentally optimizes rotational efficiency while eliminating mechanical friction. However, volatile electronic component supply chains and complex printed circuit board integration frequently disrupt localized manufacturing schedules.
  • Corporations aggressively prioritizing multi source supply networks effectively isolate their production lines from extreme pricing fluctuations. This continuous technological convergence ensures that high volume low speed circulators and reactive residential climate controls will dominate future architectural procurement strategies, firmly establishing advanced brushless technology as an indispensable pillar of modern sustainable building design.

What are the Key Data Covered in this Bldc Fan Market Research and Growth Report?

  • What is the expected growth of the Bldc Fan Market between 2026 and 2030?

    • USD 1.54 billion, at a CAGR of 8.9%

  • What segmentation does the market report cover?

    • The report is segmented by End-user (Commercial, and Residential), Speed (More than 400 RPM, Below 300 RPM, and Between 300 to 400 RPM), Type (Ceiling fans, Exhaust fans, Table fans, and Others) and Geography (APAC, North America, Europe, South America, Middle East and Africa)

  • Which regions are analyzed in the report?

    • APAC, North America, Europe, South America and Middle East and Africa

  • What are the key growth drivers and market challenges?

    • Mandatory government energy efficiency standards propel consumer transition toward brushless systems, High initial capital requirements deter price sensitive consumers from adopting technology

  • Who are the major players in the Bldc Fan Market?

    • Aeratron Inc., Atomberg Technologies Pvt. Ltd., Bajaj Electricals Ltd., Crompton Electricals Ltd., Big Ass Fans, Fanimation Inc., Havells India Ltd., Hunter Fan Co., Luminous Power Technologies, Minka Lighting Inc., Modern Forms Inc., Orient Electric Ltd., Panasonic Holdings Corp., Sinox Power, Superfan, Surya Roshni Ltd., Usha International Ltd. and V Guard Industries Ltd.

Market Research Insights

  • The BLDC Fan undergoes rapid technological restructuring as enterprise and residential consumers prioritize highly optimized climate regulation frameworks. Integrating advanced brushless direct current architecture consistently yields a 60% reduction in localized power consumption compared to traditional induction alternatives.
  • Corporate carbon reduction strategies actively enforce green building criteria, fundamentally shifting procurement pipelines toward smart home cooling devices and intelligent HVAC system integration. While high initial manufacturing expenditures present temporary adoption hurdles, continuous improvements in stator winding efficiency and microelectronic components effectively neutralize operational friction.
  • This robust focus on long term electricity bill insulation guarantees sustained deployment momentum across modern commercial environments.

We can help! Our analysts can customize this bldc fan market research report to meet your requirements.

Get in touch

1. Executive Summary

1.1 Market overview

Executive Summary - Chart on Market Overview
Executive Summary - Data Table on Market Overview
Executive Summary - Chart on Global Market Characteristics
Executive Summary - Chart on Market by Geography
Executive Summary - Chart on Market Segmentation by End-user
Executive Summary - Chart on Market Segmentation by Speed
Executive Summary - Chart on Market Segmentation by Type
Executive Summary - Chart on Incremental Growth
Executive Summary - Data Table on Incremental Growth
Executive Summary - Chart on Company Market Positioning

2. Technavio Analysis

2.1 Analysis of price sensitivity, lifecycle, customer purchase basket, adoption rates, and purchase criteria

2.2 Criticality of inputs and Factors of differentiation

Chart on Overview on criticality of inputs and factors of differentiation

2.3 Factors of disruption

Chart on Overview on factors of disruption

2.4 Impact of drivers and challenges

Chart on Impact of drivers and challenges in 2025 and 2030

3. Market Landscape

3.1 Market ecosystem

Chart on Parent Market
Data Table on - Parent Market

3.2 Market characteristics

Chart on Market characteristics analysis

3.3 Value chain analysis

Chart on Value chain analysis

4. Market Sizing

4.1 Market definition

Data Table on Offerings of companies included in the market definition

4.2 Market segment analysis

Market segments

4.3 Market size 2025

4.4 Market outlook: Forecast for 2025-2030

Chart on Global - Market size and forecast 2025-2030 ($ million)
Data Table on Global - Market size and forecast 2025-2030 ($ million)
Chart on Global Market: Year-over-year growth 2025-2030 (%)
Data Table on Global Market: Year-over-year growth 2025-2030 (%)

5. Historic Market Size

5.1 Global BLDC Fan Market 2020 - 2024

Historic Market Size - Data Table on Global BLDC Fan Market 2020 - 2024 ($ million)

5.2 End-user segment analysis 2020 - 2024

Historic Market Size - End-user Segment 2020 - 2024 ($ million)

5.3 Speed segment analysis 2020 - 2024

Historic Market Size - Speed Segment 2020 - 2024 ($ million)

5.4 Type segment analysis 2020 - 2024

Historic Market Size - Type Segment 2020 - 2024 ($ million)

5.5 Geography segment analysis 2020 - 2024

Historic Market Size - Geography Segment 2020 - 2024 ($ million)

5.6 Country segment analysis 2020 - 2024

Historic Market Size - Country Segment 2020 - 2024 ($ million)

6. Qualitative Analysis

6.1 Impact of AI on global BLDC fan market

6.2 Impact of geopolitical conflicts on global BLDC fan market

7. Five Forces Analysis

7.1 Five forces summary

Five forces analysis - Comparison between 2025 and 2030

7.2 Bargaining power of buyers

Bargaining power of buyers - Impact of key factors 2025 and 2030

7.3 Bargaining power of suppliers

Bargaining power of suppliers - Impact of key factors in 2025 and 2030

7.4 Threat of new entrants

Threat of new entrants - Impact of key factors in 2025 and 2030

7.5 Threat of substitutes

Threat of substitutes - Impact of key factors in 2025 and 2030

7.6 Threat of rivalry

Threat of rivalry - Impact of key factors in 2025 and 2030

7.7 Market condition

Chart on Market condition - Five forces 2025 and 2030

8. Market Segmentation by End-user

8.1 Market segments

Chart on End-user - Market share 2025-2030 (%)
Data Table on End-user - Market share 2025-2030 (%)

8.2 Comparison by End-user

Chart on Comparison by End-user
Data Table on Comparison by End-user

8.3 Commercial - Market size and forecast 2025-2030

Chart on Commercial - Market size and forecast 2025-2030 ($ million)
Data Table on Commercial - Market size and forecast 2025-2030 ($ million)
Chart on Commercial - Year-over-year growth 2025-2030 (%)
Data Table on Commercial - Year-over-year growth 2025-2030 (%)

8.4 Residential - Market size and forecast 2025-2030

Chart on Residential - Market size and forecast 2025-2030 ($ million)
Data Table on Residential - Market size and forecast 2025-2030 ($ million)
Chart on Residential - Year-over-year growth 2025-2030 (%)
Data Table on Residential - Year-over-year growth 2025-2030 (%)

8.5 Market opportunity by End-user

Market opportunity by End-user ($ million)
Data Table on Market opportunity by End-user ($ million)

9. Market Segmentation by Speed

9.1 Market segments

Chart on Speed - Market share 2025-2030 (%)
Data Table on Speed - Market share 2025-2030 (%)

9.2 Comparison by Speed

Chart on Comparison by Speed
Data Table on Comparison by Speed

9.3 More than 400 RPM - Market size and forecast 2025-2030

Chart on More than 400 RPM - Market size and forecast 2025-2030 ($ million)
Data Table on More than 400 RPM - Market size and forecast 2025-2030 ($ million)
Chart on More than 400 RPM - Year-over-year growth 2025-2030 (%)
Data Table on More than 400 RPM - Year-over-year growth 2025-2030 (%)

9.4 Below 300 RPM - Market size and forecast 2025-2030

Chart on Below 300 RPM - Market size and forecast 2025-2030 ($ million)
Data Table on Below 300 RPM - Market size and forecast 2025-2030 ($ million)
Chart on Below 300 RPM - Year-over-year growth 2025-2030 (%)
Data Table on Below 300 RPM - Year-over-year growth 2025-2030 (%)

9.5 Between 300 to 400 RPM - Market size and forecast 2025-2030

Chart on Between 300 to 400 RPM - Market size and forecast 2025-2030 ($ million)
Data Table on Between 300 to 400 RPM - Market size and forecast 2025-2030 ($ million)
Chart on Between 300 to 400 RPM - Year-over-year growth 2025-2030 (%)
Data Table on Between 300 to 400 RPM - Year-over-year growth 2025-2030 (%)

9.6 Market opportunity by Speed

Market opportunity by Speed ($ million)
Data Table on Market opportunity by Speed ($ million)

10. Market Segmentation by Type

10.1 Market segments

Chart on Type - Market share 2025-2030 (%)
Data Table on Type - Market share 2025-2030 (%)

10.2 Comparison by Type

Chart on Comparison by Type
Data Table on Comparison by Type

10.3 Ceiling fans - Market size and forecast 2025-2030

Chart on Ceiling fans - Market size and forecast 2025-2030 ($ million)
Data Table on Ceiling fans - Market size and forecast 2025-2030 ($ million)
Chart on Ceiling fans - Year-over-year growth 2025-2030 (%)
Data Table on Ceiling fans - Year-over-year growth 2025-2030 (%)

10.4 Exhaust fans - Market size and forecast 2025-2030

Chart on Exhaust fans - Market size and forecast 2025-2030 ($ million)
Data Table on Exhaust fans - Market size and forecast 2025-2030 ($ million)
Chart on Exhaust fans - Year-over-year growth 2025-2030 (%)
Data Table on Exhaust fans - Year-over-year growth 2025-2030 (%)

10.5 Table fans - Market size and forecast 2025-2030

Chart on Table fans - Market size and forecast 2025-2030 ($ million)
Data Table on Table fans - Market size and forecast 2025-2030 ($ million)
Chart on Table fans - Year-over-year growth 2025-2030 (%)
Data Table on Table fans - Year-over-year growth 2025-2030 (%)

10.6 Others - Market size and forecast 2025-2030

Chart on Others - Market size and forecast 2025-2030 ($ million)
Data Table on Others - Market size and forecast 2025-2030 ($ million)
Chart on Others - Year-over-year growth 2025-2030 (%)
Data Table on Others - Year-over-year growth 2025-2030 (%)

10.7 Market opportunity by Type

Market opportunity by Type ($ million)
Data Table on Market opportunity by Type ($ million)

11. Customer Landscape

11.1 Customer landscape overview

Analysis of price sensitivity, lifecycle, customer purchase basket, adoption rates, and purchase criteria

12. Geographic Landscape

12.1 Geographic segmentation

Chart on Market share by geography 2025-2030 (%)
Data Table on Market share by geography 2025-2030 (%)

12.2 Geographic comparison

Chart on Geographic comparison
Data Table on Geographic comparison

12.3 APAC - Market size and forecast 2025-2030

Chart on APAC - Market size and forecast 2025-2030 ($ million)
Data Table on APAC - Market size and forecast 2025-2030 ($ million)
Chart on APAC - Year-over-year growth 2025-2030 (%)
Data Table on APAC - Year-over-year growth 2025-2030 (%)
Chart on Regional Comparison - APAC
Data Table on Regional Comparison - APAC

12.3.1 China - Market size and forecast 2025-2030

Chart on China - Market size and forecast 2025-2030 ($ million)
Data Table on China - Market size and forecast 2025-2030 ($ million)
Chart on China - Year-over-year growth 2025-2030 (%)
Data Table on China - Year-over-year growth 2025-2030 (%)

12.3.2 India - Market size and forecast 2025-2030

Chart on India - Market size and forecast 2025-2030 ($ million)
Data Table on India - Market size and forecast 2025-2030 ($ million)
Chart on India - Year-over-year growth 2025-2030 (%)
Data Table on India - Year-over-year growth 2025-2030 (%)

12.3.3 Japan - Market size and forecast 2025-2030

Chart on Japan - Market size and forecast 2025-2030 ($ million)
Data Table on Japan - Market size and forecast 2025-2030 ($ million)
Chart on Japan - Year-over-year growth 2025-2030 (%)
Data Table on Japan - Year-over-year growth 2025-2030 (%)

12.3.4 Indonesia - Market size and forecast 2025-2030

Chart on Indonesia - Market size and forecast 2025-2030 ($ million)
Data Table on Indonesia - Market size and forecast 2025-2030 ($ million)
Chart on Indonesia - Year-over-year growth 2025-2030 (%)
Data Table on Indonesia - Year-over-year growth 2025-2030 (%)

12.3.5 South Korea - Market size and forecast 2025-2030

Chart on South Korea - Market size and forecast 2025-2030 ($ million)
Data Table on South Korea - Market size and forecast 2025-2030 ($ million)
Chart on South Korea - Year-over-year growth 2025-2030 (%)
Data Table on South Korea - Year-over-year growth 2025-2030 (%)

12.3.6 Australia - Market size and forecast 2025-2030

Chart on Australia - Market size and forecast 2025-2030 ($ million)
Data Table on Australia - Market size and forecast 2025-2030 ($ million)
Chart on Australia - Year-over-year growth 2025-2030 (%)
Data Table on Australia - Year-over-year growth 2025-2030 (%)

12.4 North America - Market size and forecast 2025-2030

Chart on North America - Market size and forecast 2025-2030 ($ million)
Data Table on North America - Market size and forecast 2025-2030 ($ million)
Chart on North America - Year-over-year growth 2025-2030 (%)
Data Table on North America - Year-over-year growth 2025-2030 (%)
Chart on Regional Comparison - North America
Data Table on Regional Comparison - North America

12.4.1 US - Market size and forecast 2025-2030

Chart on US - Market size and forecast 2025-2030 ($ million)
Data Table on US - Market size and forecast 2025-2030 ($ million)
Chart on US - Year-over-year growth 2025-2030 (%)
Data Table on US - Year-over-year growth 2025-2030 (%)

12.4.2 Canada - Market size and forecast 2025-2030

Chart on Canada - Market size and forecast 2025-2030 ($ million)
Data Table on Canada - Market size and forecast 2025-2030 ($ million)
Chart on Canada - Year-over-year growth 2025-2030 (%)
Data Table on Canada - Year-over-year growth 2025-2030 (%)

12.4.3 Mexico - Market size and forecast 2025-2030

Chart on Mexico - Market size and forecast 2025-2030 ($ million)
Data Table on Mexico - Market size and forecast 2025-2030 ($ million)
Chart on Mexico - Year-over-year growth 2025-2030 (%)
Data Table on Mexico - Year-over-year growth 2025-2030 (%)

12.5 Europe - Market size and forecast 2025-2030

Chart on Europe - Market size and forecast 2025-2030 ($ million)
Data Table on Europe - Market size and forecast 2025-2030 ($ million)
Chart on Europe - Year-over-year growth 2025-2030 (%)
Data Table on Europe - Year-over-year growth 2025-2030 (%)
Chart on Regional Comparison - Europe
Data Table on Regional Comparison - Europe

12.5.1 Germany - Market size and forecast 2025-2030

Chart on Germany - Market size and forecast 2025-2030 ($ million)
Data Table on Germany - Market size and forecast 2025-2030 ($ million)
Chart on Germany - Year-over-year growth 2025-2030 (%)
Data Table on Germany - Year-over-year growth 2025-2030 (%)

12.5.2 UK - Market size and forecast 2025-2030

Chart on UK - Market size and forecast 2025-2030 ($ million)
Data Table on UK - Market size and forecast 2025-2030 ($ million)
Chart on UK - Year-over-year growth 2025-2030 (%)
Data Table on UK - Year-over-year growth 2025-2030 (%)

12.5.3 France - Market size and forecast 2025-2030

Chart on France - Market size and forecast 2025-2030 ($ million)
Data Table on France - Market size and forecast 2025-2030 ($ million)
Chart on France - Year-over-year growth 2025-2030 (%)
Data Table on France - Year-over-year growth 2025-2030 (%)

12.5.4 Italy - Market size and forecast 2025-2030

Chart on Italy - Market size and forecast 2025-2030 ($ million)
Data Table on Italy - Market size and forecast 2025-2030 ($ million)
Chart on Italy - Year-over-year growth 2025-2030 (%)
Data Table on Italy - Year-over-year growth 2025-2030 (%)

12.5.5 Spain - Market size and forecast 2025-2030

Chart on Spain - Market size and forecast 2025-2030 ($ million)
Data Table on Spain - Market size and forecast 2025-2030 ($ million)
Chart on Spain - Year-over-year growth 2025-2030 (%)
Data Table on Spain - Year-over-year growth 2025-2030 (%)

12.5.6 The Netherlands - Market size and forecast 2025-2030

Chart on The Netherlands - Market size and forecast 2025-2030 ($ million)
Data Table on The Netherlands - Market size and forecast 2025-2030 ($ million)
Chart on The Netherlands - Year-over-year growth 2025-2030 (%)
Data Table on The Netherlands - Year-over-year growth 2025-2030 (%)

12.6 South America - Market size and forecast 2025-2030

Chart on South America - Market size and forecast 2025-2030 ($ million)
Data Table on South America - Market size and forecast 2025-2030 ($ million)
Chart on South America - Year-over-year growth 2025-2030 (%)
Data Table on South America - Year-over-year growth 2025-2030 (%)
Chart on Regional Comparison - South America
Data Table on Regional Comparison - South America

12.6.1 Brazil - Market size and forecast 2025-2030

Chart on Brazil - Market size and forecast 2025-2030 ($ million)
Data Table on Brazil - Market size and forecast 2025-2030 ($ million)
Chart on Brazil - Year-over-year growth 2025-2030 (%)
Data Table on Brazil - Year-over-year growth 2025-2030 (%)

12.6.2 Argentina - Market size and forecast 2025-2030

Chart on Argentina - Market size and forecast 2025-2030 ($ million)
Data Table on Argentina - Market size and forecast 2025-2030 ($ million)
Chart on Argentina - Year-over-year growth 2025-2030 (%)
Data Table on Argentina - Year-over-year growth 2025-2030 (%)

12.6.3 Chile - Market size and forecast 2025-2030

Chart on Chile - Market size and forecast 2025-2030 ($ million)
Data Table on Chile - Market size and forecast 2025-2030 ($ million)
Chart on Chile - Year-over-year growth 2025-2030 (%)
Data Table on Chile - Year-over-year growth 2025-2030 (%)

12.7 Middle East and Africa - Market size and forecast 2025-2030

Chart on Middle East and Africa - Market size and forecast 2025-2030 ($ million)
Data Table on Middle East and Africa - Market size and forecast 2025-2030 ($ million)
Chart on Middle East and Africa - Year-over-year growth 2025-2030 (%)
Data Table on Middle East and Africa - Year-over-year growth 2025-2030 (%)
Chart on Regional Comparison - Middle East and Africa
Data Table on Regional Comparison - Middle East and Africa

12.7.1 Saudi Arabia - Market size and forecast 2025-2030

Chart on Saudi Arabia - Market size and forecast 2025-2030 ($ million)
Data Table on Saudi Arabia - Market size and forecast 2025-2030 ($ million)
Chart on Saudi Arabia - Year-over-year growth 2025-2030 (%)
Data Table on Saudi Arabia - Year-over-year growth 2025-2030 (%)

12.7.2 UAE - Market size and forecast 2025-2030

Chart on UAE - Market size and forecast 2025-2030 ($ million)
Data Table on UAE - Market size and forecast 2025-2030 ($ million)
Chart on UAE - Year-over-year growth 2025-2030 (%)
Data Table on UAE - Year-over-year growth 2025-2030 (%)

12.7.3 South Africa - Market size and forecast 2025-2030

Chart on South Africa - Market size and forecast 2025-2030 ($ million)
Data Table on South Africa - Market size and forecast 2025-2030 ($ million)
Chart on South Africa - Year-over-year growth 2025-2030 (%)
Data Table on South Africa - Year-over-year growth 2025-2030 (%)

12.7.4 Turkey - Market size and forecast 2025-2030

Chart on Turkey - Market size and forecast 2025-2030 ($ million)
Data Table on Turkey - Market size and forecast 2025-2030 ($ million)
Chart on Turkey - Year-over-year growth 2025-2030 (%)
Data Table on Turkey - Year-over-year growth 2025-2030 (%)

12.7.5 Israel - Market size and forecast 2025-2030

Chart on Israel - Market size and forecast 2025-2030 ($ million)
Data Table on Israel - Market size and forecast 2025-2030 ($ million)
Chart on Israel - Year-over-year growth 2025-2030 (%)
Data Table on Israel - Year-over-year growth 2025-2030 (%)

12.8 Market opportunity by geography

Market opportunity by geography ($ million)
Data Tables on Market opportunity by geography ($ million)

13. Drivers, Challenges, and Opportunity

13.1 Market drivers

Mandatory government energy efficiency standards propel consumer transition toward brushless systems
Rising electricity tariffs incentivize domestic investments in low wattage cooling solutions
Rapid real estate construction in tropical regions elevates ventilation requirements globally

13.2 Market challenges

High initial capital requirements deter price sensitive consumers from adopting technology
Technical electronic repair complexities exacerbate consumer dissatisfaction regarding system maintenance lifespans
Counterfeit component distribution undermines operational reliability of premium energy saving systems

13.3 Impact of drivers and challenges

Impact of drivers and challenges in 2025 and 2030

13.4 Market opportunities

Accelerated integration of internet things technology enables intelligent remote thermal controls
Growing architectural preference for premium aesthetic finishes incorporating integrated lighting fixtures
Industrial product innovation prioritizes aerodynamic blade designs minimizing operational noise levels

14. Competitive Landscape

14.1 Overview

14.2

Overview on criticality of inputs and factors of differentiation

14.3 Landscape disruption

Overview on factors of disruption

14.4 Industry risks

Impact of key risks on business

15. Competitive Analysis

15.1 Companies profiled

Companies covered

15.2 Company ranking index

15.3 Market positioning of companies

Matrix on companies position and classification

15.4 Aeratron Inc.

Aeratron Inc. - Overview
Aeratron Inc. - Product / Service
Aeratron Inc. - Key offerings
SWOT

15.5 Atomberg Technologies Pvt. Ltd.

Atomberg Technologies Pvt. Ltd. - Overview
Atomberg Technologies Pvt. Ltd. - Product / Service
Atomberg Technologies Pvt. Ltd. - Key offerings
SWOT

15.6 Bajaj Electricals Ltd.

Bajaj Electricals Ltd. - Overview
Bajaj Electricals Ltd. - Business segments
Bajaj Electricals Ltd. - Key offerings
Bajaj Electricals Ltd. - Segment focus
SWOT

15.7 Crompton Electricals Ltd.

Crompton Electricals Ltd. - Overview
Crompton Electricals Ltd. - Business segments
Crompton Electricals Ltd. - Key offerings
Crompton Electricals Ltd. - Segment focus
SWOT

15.8 Big Ass Fans

Big Ass Fans - Overview
Big Ass Fans - Product / Service
Big Ass Fans - Key offerings
SWOT

15.9 Fanimation Inc.

Fanimation Inc. - Overview
Fanimation Inc. - Product / Service
Fanimation Inc. - Key offerings
SWOT

15.10 Havells India Ltd.

Havells India Ltd. - Overview
Havells India Ltd. - Business segments
Havells India Ltd. - Key offerings
Havells India Ltd. - Segment focus
SWOT

15.11 Hunter Fan Co.

Hunter Fan Co. - Overview
Hunter Fan Co. - Product / Service
Hunter Fan Co. - Key offerings
SWOT

15.12 Minka Lighting Inc.

Minka Lighting Inc. - Overview
Minka Lighting Inc. - Product / Service
Minka Lighting Inc. - Key offerings
SWOT

15.13 Orient Electric Ltd.

Orient Electric Ltd. - Overview
Orient Electric Ltd. - Business segments
Orient Electric Ltd. - Key offerings
Orient Electric Ltd. - Segment focus
SWOT

15.14 Panasonic Holdings Corp.

Panasonic Holdings Corp. - Overview
Panasonic Holdings Corp. - Business segments
Panasonic Holdings Corp. - Key news
Panasonic Holdings Corp. - Key offerings
Panasonic Holdings Corp. - Segment focus
SWOT

15.15 Sinox Power

Sinox Power - Overview
Sinox Power - Product / Service
Sinox Power - Key offerings
SWOT

15.16 Surya Roshni Ltd.

Surya Roshni Ltd. - Overview
Surya Roshni Ltd. - Business segments
Surya Roshni Ltd. - Key offerings
Surya Roshni Ltd. - Segment focus
SWOT

15.17 Usha International Ltd.

Usha International Ltd. - Overview
Usha International Ltd. - Product / Service
Usha International Ltd. - Key offerings
SWOT

15.18 V Guard Industries Ltd.

V Guard Industries Ltd. - Overview
V Guard Industries Ltd. - Product / Service
V Guard Industries Ltd. - Key offerings
SWOT

16. Appendix

16.1 Scope of the report

Market definition
Objectives
Notes and caveats

16.2 Inclusions and exclusions checklist

Inclusions checklist
Exclusions checklist

16.3 Currency conversion rates for US$

16.4 Research methodology

16.5 Data procurement

Information sources

16.6 Data validation

16.7 Validation techniques employed for market sizing

16.8 Data synthesis

16.9 360 degree market analysis

16.10 List of abbreviations

Research Methodology

Technavio presents a detailed picture of the market by way of study, synthesis, and summation of data from multiple sources. The analysts have presented the various facets of the market with a particular focus on identifying the key industry influencers. The data thus presented is comprehensive, reliable, and the result of extensive research, both primary and secondary.

INFORMATION SOURCES

Primary sources

  • Manufacturers and suppliers
  • Channel partners
  • Industry experts
  • Strategic decision makers

Secondary sources

  • Industry journals and periodicals
  • Government data
  • Financial reports of key industry players
  • Historical data
  • Press releases

DATA ANALYSIS

Data Synthesis

  • Collation of data
  • Estimation of key figures
  • Analysis of derived insights

Data Validation

  • Triangulation with data models
  • Reference against proprietary databases
  • Corroboration with industry experts

REPORT WRITING

Qualitative

  • Market drivers
  • Market challenges
  • Market trends
  • Five forces analysis

Quantitative

  • Market size and forecast
  • Market segmentation
  • Geographical insights
  • Competitive landscape

Interested in this report?

Get your sample now to see our research methodology and insights!

Download Now

Frequently Asked Questions

Bldc Fan market growth will increase by USD 1536.3 million during 2026-2030.

The Bldc Fan market is expected to grow at a CAGR of 8.9% during 2026-2030.

Bldc Fan market is segmented by End-user (Commercial, Residential) Speed (More than 400 RPM, Below 300 RPM, Between 300 to 400 RPM) Type (Ceiling fans, Exhaust fans, Table fans, Others)

Aeratron Inc., Atomberg Technologies Pvt. Ltd., Bajaj Electricals Ltd., Crompton Electricals Ltd., Big Ass Fans, Fanimation Inc., Havells India Ltd., Hunter Fan Co., Luminous Power Technologies, Minka Lighting Inc., Modern Forms Inc., Orient Electric Ltd., Panasonic Holdings Corp., Sinox Power, Superfan, Surya Roshni Ltd., Usha International Ltd., V Guard Industries Ltd. are a few of the key vendors in the Bldc Fan market.

APAC will register the highest growth rate of 64.5% among the other regions. Therefore, the Bldc Fan market in APAC is expected to garner significant business opportunities for the vendors during the forecast period.

China, India, Japan, Indonesia, South Korea, Australia, US, Canada, Mexico, Germany, UK, France, Italy, Spain, The Netherlands, Brazil, Argentina, Chile, Saudi Arabia, UAE, South Africa, Turkey, Israel

  • Mandatory government energy efficiency standards propel consumer transition toward brushless systems is the driving factor this market.

The Bldc Fan market vendors should focus on grabbing business opportunities from the End-user segment as it accounted for the largest market share in the base year.
RIA - Research AI Assistant
Ask RIA
