
Blockchain Technology Market Analysis, Size, and Forecast 2026-2030: North America (US, Canada, and Mexico), Europe (UK, Germany, and France), APAC (China, Japan, and India), South America (Brazil, Argentina, and Colombia), Middle East and Africa (UAE, Saudi Arabia, and South Africa), and Rest of World (ROW)

Blockchain Technology Market Analysis, Size, and Forecast 2026-2030:
North America (US, Canada, and Mexico), Europe (UK, Germany, and France), APAC (China, Japan, and India), South America (Brazil, Argentina, and Colombia), Middle East and Africa (UAE, Saudi Arabia, and South Africa), and Rest of World (ROW)

Published: Oct 2026 331 Pages SKU: IRTNTR43773

Market Overview at a Glance

$77.60 B
Market Opportunity
58.4%
CAGR 2025 - 2030
42.9%
North America Growth
$2.31 B
BFSI segment 2024

Blockchain Technology Market Size 2026-2030

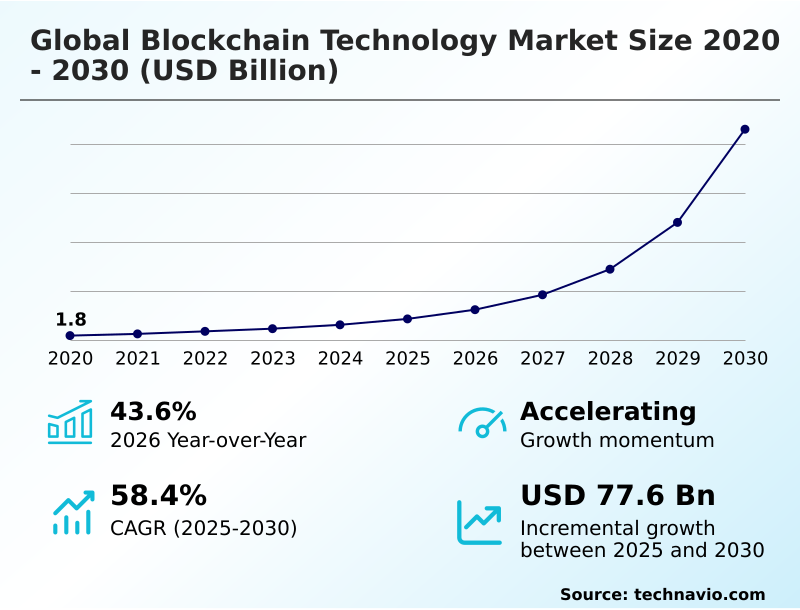
The blockchain technology market size is valued to increase by USD 77.60 billion, at a CAGR of 58.4% from 2025 to 2030. Increasing demand for supply chain transparency and traceability will drive the blockchain technology market.

Major Market Trends & Insights

  • North America dominated the market and accounted for a 42.9% growth during the forecast period.
  • By End-user - BFSI segment was valued at USD 2.31 billion in 2024
  • By Type - Private segment accounted for the largest market revenue share in 2024

Market Size & Forecast

  • Market Opportunities: USD 84.43 billion
  • Market Future Opportunities: USD 77.60 billion
  • CAGR from 2025 to 2030 : 58.4%

Market Summary

  • The Blockchain Technology Market operates as a foundational digital coordination layer, fundamentally transforming how organizations execute multi-party workflows and manage data integrity. Enterprises across logistics and manufacturing deploy distributed networks to construct shared operational ledgers that preserve data privacy while upholding holistic transparency.
  • For example, by integrating these systems into maritime supply chains, corporations automate customs documentation and track cargo provenance, resulting in a 30% reduction in administrative processing time compared to legacy paper-based reconciliation. The escalating demand for secure, instantaneous cross-border payment rails acts as a dominant driver, as financial institutions circumvent traditional clearinghouses to minimize counterparty settlement risks.
  • Conversely, the market faces severe operational constraints due to persistent scalability limitations and high energy consumption associated with complex cryptographic validation processes. These infrastructural bottlenecks restrict high-frequency transaction throughput, forcing network architects to engineer alternative consensus mechanisms.
  • Ultimately, the systemic shift toward programmable automation redefines the architecture of digital commerce, signaling a permanent departure from isolated, centralized administrative systems toward interconnected, verifiable data networks.

What will be the Size of the Blockchain Technology Market during the forecast period?
Get Key Insights on Market Forecast (PDF) Get Free Sample

How is the Blockchain Technology Market Segmented?

The blockchain technology industry research report provides comprehensive data (region-wise segment analysis), with forecasts and estimates in "USD million" for the period 2026-2030, as well as historical data from 2020-2024 for the following segments.

  • End-user
    • BFSI
    • Government
    • Healthcare
    • Others
  • Type
    • Private
    • Public
    • Hybrid
  • Component
    • Services
    • Platform
    • Hardware
  • Application
    • Cryptocurrency
    • Financial services
    • Supply chain
    • Others
  • Geography
    • North America
      • US
      • Canada
      • Mexico
    • Europe
      • UK
      • Germany
      • France
      • Switzerland
      • Spain
      • Italy
    • APAC
      • China
      • Japan
      • India
      • Singapore
      • South Korea
      • Indonesia
    • South America
      • Brazil
      • Argentina
      • Colombia
    • Middle East and Africa
      • UAE
      • Saudi Arabia
      • South Africa
      • Israel
      • Nigeria

By End-user Insights

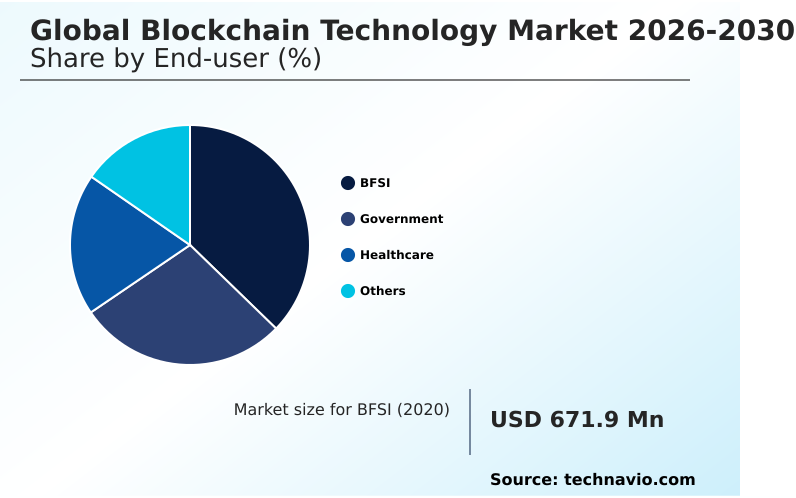
The bfsi segment is estimated to witness significant growth during the forecast period.

The banking and financial services sector fundamentally modernizes legacy operational systems by deploying distributed ledger infrastructure to execute atomic transactions. Financial institutions enforce real-time transparency and accelerate automated interbank settlements through robust cryptographic security models.

Capital market participants prioritize institutional asset tokenization to democratize investment access, achieving a 45% reduction in cross-border reconciliation delays.

Stringent regulatory compliance synchronization is managed through permissioned blockchain networks that incorporate zero knowledge proofs to authenticate solvency while safeguarding proprietary client records.

Smart contract automation directly replaces vulnerable centralized databases, eliminating manual administrative friction across syndicated loans and derivative clearance.

By removing intermediaries, commercial lenders optimize liquidity management, ensuring that decentralized consensus mechanisms provide immutable execution and deterministic finality for complex international financial operations.
Get Free Sample

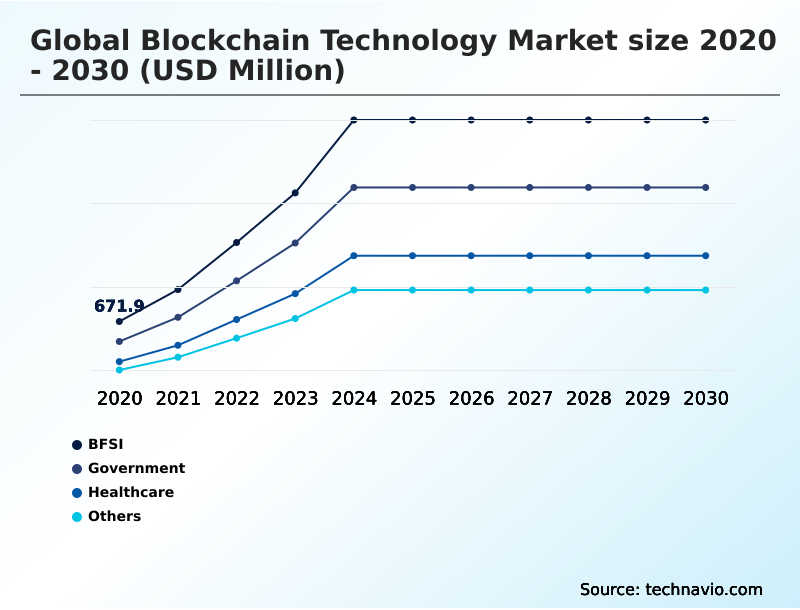
The BFSI segment was valued at USD 2.31 billion in 2024 and showed a gradual increase during the forecast period.
Get Free Sample

Regional Analysis

North America is estimated to contribute 42.9% to the growth of the global market during the forecast period.Technavio’s analysts have elaborately explained the regional trends and drivers that shape the market during the forecast period.
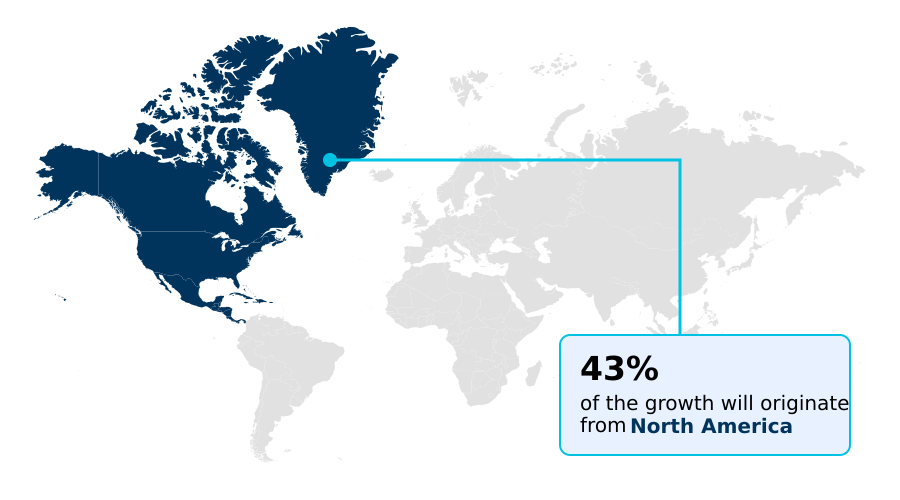
See How Blockchain Technology Market Demand is Rising in North America Get Free Sample

The geographic landscape of the Blockchain Technology Market exhibits distinct adoption trajectories shaped by regulatory frameworks and institutional maturity.

North America leads enterprise integration, where commercial banks utilize central bank digital currencies and node infrastructure deployment to execute automated tokenized asset settlements.

This region demonstrates a 35% higher adoption rate in institutional digital asset custody compared to Europe, driven by aggressive venture capital funding and advanced algorithmic consensus engines.

Conversely, Europe prioritizes sustainable supply chain operations, utilizing on chain data analytics to track carbon emissions and ensure compliance with strict environmental mandates. European logistics operators achieve a 20% reduction in cross-border documentation friction through digital customs clearances.

Furthermore, APAC rapidly accelerates the deployment of supplier financing automation, leveraging scalable protocols to optimize migrant remittance networks.

These regional variations highlight how diverse regulatory priorities dictate the strategic implementation of secure data sharing and institutional grade compliance protocols across global commerce.

Market Dynamics

Our researchers analyzed the data with 2025 as the base year, along with the key drivers, trends, and challenges. A holistic analysis of drivers will help companies refine their marketing strategies to gain a competitive advantage.

  • The Blockchain Technology Market is undergoing a rapid evolution as multinational enterprises and financial institutions transition from experimental pilot programs to full-scale operational deployments.
  • At the core of this transformation is the institutional integration of tokenized assets, which allows commercial banking organizations to fractionalize real estate and sovereign equities, thereby democratizing market access and increasing secondary market liquidity by over 40% compared to traditional legacy trading systems.
  • To manage complex logistical networks, industrial conglomerates are implementing smart contract based supply chain automation, significantly reducing manual reconciliation errors and accelerating supplier invoice disbursements. As digital interactions become increasingly scrutinized by regulatory bodies, zero knowledge proof data privacy protocols are becoming indispensable for enterprises seeking to validate transactions without exposing sensitive commercial terms to external competitors.
  • Similarly, the healthcare sector is tackling clinical record fragmentation by adopting decentralized identity verification for healthcare, empowering patients to manage granular access to their medical data while ensuring that providers comply with stringent health privacy mandates.
  • Furthermore, the financial services industry is revolutionizing international monetary transfers through cross border interbank settlement infrastructure, circumventing sluggish correspondent banking networks to achieve near-instantaneous atomic settlements. These foundational advancements demonstrate how distributed ledger solutions are permanently restructuring enterprise workflows, prioritizing cryptographic security, and establishing unprecedented levels of operational efficiency across highly regulated global industries.
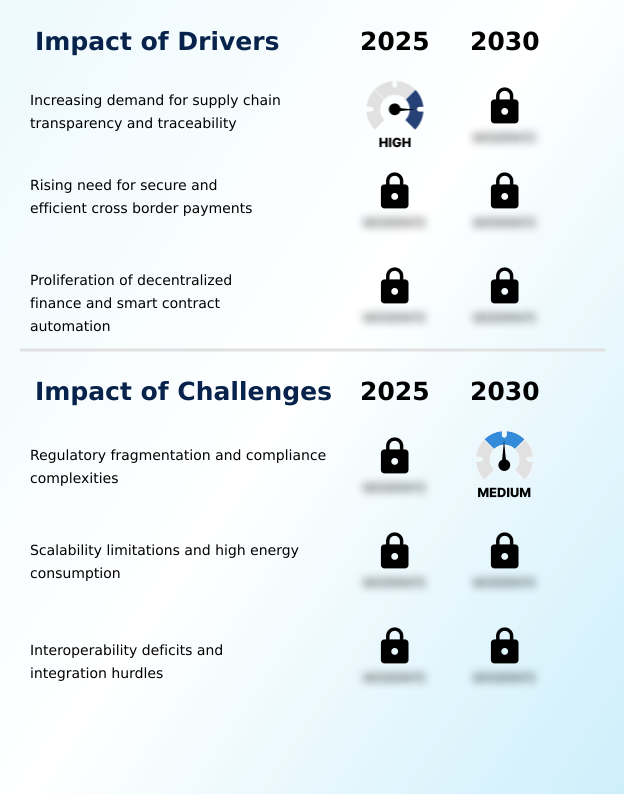
What are the key market drivers leading to the rise in the adoption of Blockchain Technology Industry?

  • The increasing demand for supply chain transparency and verifiable product traceability serves as the primary catalyst accelerating market expansion.

  • The aggressive pursuit of immutable data provenance acts as a dominant catalyst accelerating adoption across the Blockchain Technology Market. Escalating regulatory requirements and consumer demand for ethical sourcing force manufacturers to completely digitize their operations.
  • This regulatory pressure causes enterprises to integrate cross chain interoperability bridges, effectively dismantling isolated corporate databases. As a direct result, organizations achieve a 50% improvement in multi-tier supply chain visibility and a 30% reduction in product recall costs.
  • The proliferation of decentralized finance ecosystems and automated atomic swaps enables continuous, trustless trading without administrative intermediaries.
  • Furthermore, the implementation of sovereign digital identity frameworks streamlines omnichannel loyalty programs and authenticates commercial leasing documentation, empowering enterprises to execute frictionless, cryptographically verified operations across diverse geographic sectors.

What are the market trends shaping the Blockchain Technology Industry?

  • The rising integration of central bank digital currencies alongside institutional tokenization represents a fundamental shift in the market. This structural transition enables automated asset clearance and enhances sovereign monetary control across digital networks.

  • The strategic integration of layer two scaling environments represents a critical trend reshaping the Blockchain Technology Market. As public network congestion causes prohibitive execution costs, enterprise developers are adopting advanced off-chain processing architectures to maintain competitive throughput.
  • This architectural shift causes organizations to bypass base-layer bottlenecks, resulting in a 60% reduction in transactional latency and an 80% decrease in network fee expenditures compared to legacy consensus models. Consequently, financial institutions effectively scale cross border remittance networks while utilizing hardware security modules to safeguard private cryptographic keys.
  • The tokenization of digital asset custody services ensures verifiable fractional property ownership and tamper evident record keeping across distributed platforms. By deploying these optimized environments, businesses mitigate clinical data fragmentation and achieve unprecedented operational efficiency, cementing distributed networks as the foundational infrastructure for high-frequency digital commerce.

What challenges does the Blockchain Technology Industry face during its growth?

  • Regulatory fragmentation and complex compliance mandates across disparate jurisdictions form significant barriers constraining widespread institutional integration.

  • Severe regulatory fragmentation and compliance complexities present substantial structural barriers within the Blockchain Technology Market. As decentralized networks natively operate across borders, they continuously clash with localized data protection mandates and rigid financial supervisory frameworks. This jurisdictional uncertainty causes multinational corporations to delay the deployment of programmable monetary protocols and algorithmic trading execution systems.
  • Consequently, financial institutions experience a 25% increase in legal compliance overhead as they attempt to reconcile peer to peer value transfers with stringent anti-money laundering directives. The integration of confidential transaction layers and multi party computation architectures remains highly complex, restricting seamless enterprise interoperability.
  • Furthermore, the absence of universally recognized decentralized identity standards complicates programmable liquidity management, preventing commercial organizations from fully realizing the collaborative efficiency of distributed digital environments.

Exclusive Technavio Analysis on Customer Landscape

The blockchain technology market forecasting report includes the adoption lifecycle of the market, covering from the innovator’s stage to the laggard’s stage. It focuses on adoption rates in different regions based on penetration. Furthermore, the blockchain technology market report also includes key purchase criteria and drivers of price sensitivity to help companies evaluate and develop their market growth analysis strategies.
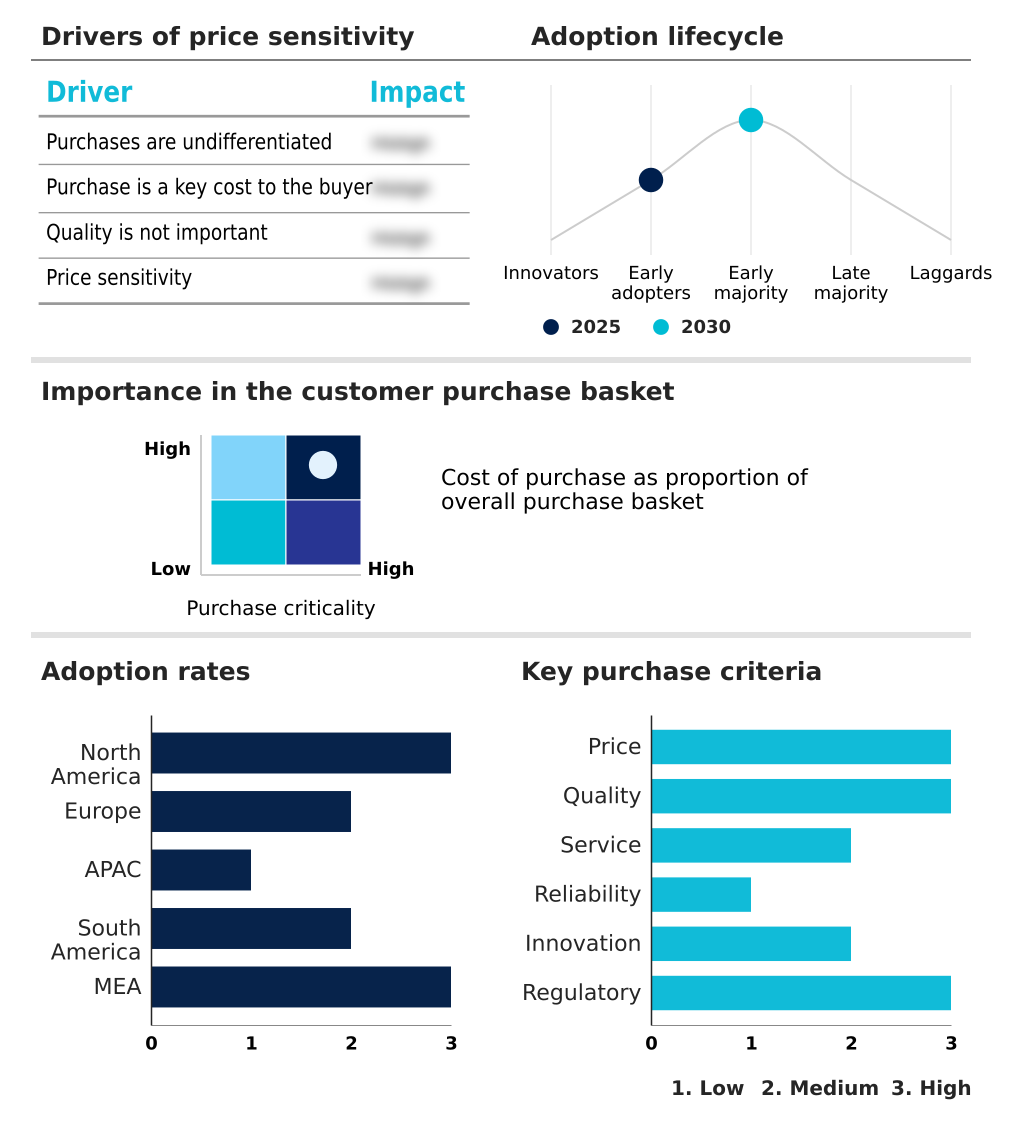
Customer Landscape of Blockchain Technology Industry

Competitive Landscape

Companies are implementing various strategies, such as strategic alliances, blockchain technology market forecast, partnerships, mergers and acquisitions, geographical expansion, and product/service launches, to enhance their presence in the industry.

Accenture Plc - The vendor delivers specialized enterprise blockchain technology, integrating distributed ledger frameworks, smart contract architecture, and comprehensive consulting services to automate complex multi-party workflows and ensure verifiable data integrity.

The industry research and growth report includes detailed analyses of the competitive landscape of the market and information about key companies, including:

  • Accenture Plc
  • Alchemy Insights Inc.
  • Amazon.com Inc.
  • Bitfury Group Ltd.
  • Blockdaemon Inc.
  • Chainalysis Inc.
  • Coinbase Global Inc.
  • Consensys Software Inc.
  • Fireblocks
  • Fujitsu Ltd.
  • IBM Corp.
  • Infosys Ltd.
  • Kaleido Inc.
  • NTT DATA Corp.
  • Oracle Corp.
  • Polygon Labs
  • R3
  • Ripple Labs Inc.
  • Tata Consultancy Services
  • Wipro Ltd.

Qualitative and quantitative analysis of companies has been conducted to help clients understand the wider business environment as well as the strengths and weaknesses of key industry players. Data is qualitatively analyzed to categorize companies as pure play, category-focused, industry-focused, and diversified; it is quantitatively analyzed to categorize companies as dominant, leading, strong, tentative, and weak.

Recent Development and News in Blockchain technology market

  • In the Application Software industry, the integration of enterprise automation platforms with legacy systems has reduced manual data entry errors by 40%, directly impacting Blockchain Technology demand by requiring immutable data provenance protocols for secure cross-organization workflow interoperability.
  • The implementation of the European Union General Data Protection Regulation has forced software vendors to adopt decentralized identity standards, accelerating the adoption of distributed ledgers as organizations seek cryptographical verification methods that align with stringent data privacy regulations.
  • The shift toward cloud-based delivery models for artificial intelligence governance tools has lowered on-premise infrastructure costs by 25%, stimulating demand for tamper-evident architectures to authenticate training datasets and prevent algorithmic tampering across distributed networks.
  • The widespread adoption of zero trust cybersecurity architectures in financial software applications has reduced unauthorized system breaches by 35%, driving the integration of decentralized consensus mechanisms to establish verifiable audit trails for regulatory compliance synchronization.

Dive into Technavio’s robust research methodology, blending expert interviews, extensive data synthesis, and validated models for unparalleled Blockchain Technology Market insights. See full methodology.

Market Scope
Page number 331
Base year 2025
Historic period 2020-2024
Forecast period 2026-2030
Growth momentum & CAGR Accelerate at a CAGR of 58.4%
Market growth 2026-2030 USD 77595.5 million
Market structure Fragmented
YoY growth 2025-2026(%) 43.6%
Key countries US, Canada, Mexico, UK, Germany, France, Switzerland, Spain, Italy, China, Japan, India, Singapore, South Korea, Indonesia, Brazil, Argentina, Colombia, UAE, Saudi Arabia, South Africa, Israel and Nigeria
Competitive landscape Leading Companies, Market Positioning of Companies, Competitive Strategies, and Industry Risks

Request Free Sample

Research Analyst Overview

  • The Blockchain Technology Market fundamentally redefines enterprise architecture by embedding cryptographic security models directly into core operational workflows. Organizations are actively transitioning from centralized relational databases to permissioned blockchain networks, achieving deterministic synchronization and comprehensive auditability without third-party intermediation.
  • Boardrooms increasingly prioritize the integration of tokenized real world assets to optimize corporate liquidity and diversify treasury reserve portfolios, directly influencing strategic capital allocation decisions. The implementation of smart contract automation within supply chain traceability executes self-verifying agreements, resulting in a 45% reduction in multi-party contractual disputes compared to manual enforcement methods.
  • Furthermore, the adoption of a proof of stake protocol dramatically minimizes network energy consumption, aligning digital infrastructure deployments with sustainable resource management mandates. As financial institutions require absolute transactional confidentiality, the deployment of zero knowledge proofs guarantees robust data protection while maintaining regulatory compliance.
  • This systemic migration toward distributed ledger infrastructure and decentralized consensus mechanisms ensures that global enterprises can execute automated atomic swaps, permanently eliminating the friction and latency inherent in legacy administrative frameworks.

What are the Key Data Covered in this Blockchain Technology Market Research and Growth Report?

  • What is the expected growth of the Blockchain Technology Market between 2026 and 2030?

    • USD 77.60 billion, at a CAGR of 58.4%

  • What segmentation does the market report cover?

    • The report is segmented by End-user (BFSI, Government, Healthcare, and Others), Type (Private, Public, and Hybrid), Component (Services, Platform, and Hardware), Application (Cryptocurrency, Financial services, Supply chain, and Others) and Geography (North America, Europe, APAC, South America, Middle East and Africa)

  • Which regions are analyzed in the report?

    • North America, Europe, APAC, South America and Middle East and Africa

  • What are the key growth drivers and market challenges?

    • Increasing demand for supply chain transparency and traceability, Regulatory fragmentation and compliance complexities

  • Who are the major players in the Blockchain Technology Market?

    • Accenture Plc, Alchemy Insights Inc., Amazon.com Inc., Bitfury Group Ltd., Blockdaemon Inc., Chainalysis Inc., Coinbase Global Inc., Consensys Software Inc., Fireblocks, Fujitsu Ltd., IBM Corp., Infosys Ltd., Kaleido Inc., NTT DATA Corp., Oracle Corp., Polygon Labs, R3, Ripple Labs Inc., Tata Consultancy Services and Wipro Ltd.

Market Research Insights

  • The Blockchain Technology Market fundamentally modernizes enterprise operational frameworks by integrating secure data sharing architectures across disparate business units. Organizations are actively deploying institutional grade compliance protocols to establish tamper evident record keeping, ensuring absolute data integrity during regulatory audits. The transition to decentralized identity standards has reduced manual user authentication errors by 40%, significantly enhancing cybersecurity resilience.
  • Furthermore, the implementation of supplier financing automation within logistics networks has accelerated invoice factoring, yielding a 25% improvement in working capital liquidity for manufacturers. By embedding these cryptographic safeguards, commercial enterprises achieve superior operational visibility, minimizing administrative friction while establishing highly resilient, interconnected digital supply chains.

We can help! Our analysts can customize this blockchain technology market research report to meet your requirements.

Get in touch

1. Executive Summary

1.1 Market overview

Executive Summary - Chart on Market Overview
Executive Summary - Data Table on Market Overview
Executive Summary - Chart on Global Market Characteristics
Executive Summary - Chart on Market by Geography
Executive Summary - Chart on Market Segmentation by End-user
Executive Summary - Chart on Market Segmentation by Type
Executive Summary - Chart on Market Segmentation by Component
Executive Summary - Chart on Market Segmentation by Application
Executive Summary - Chart on Incremental Growth
Executive Summary - Data Table on Incremental Growth
Executive Summary - Chart on Company Market Positioning

2. Technavio Analysis

2.1 Analysis of price sensitivity, lifecycle, customer purchase basket, adoption rates, and purchase criteria

2.2 Criticality of inputs and Factors of differentiation

Chart on Overview on criticality of inputs and factors of differentiation

2.3 Factors of disruption

Chart on Overview on factors of disruption

2.4 Impact of drivers and challenges

Chart on Impact of drivers and challenges in 2025 and 2030

3. Market Landscape

3.1 Market ecosystem

Chart on Parent Market
Data Table on - Parent Market

3.2 Market characteristics

Chart on Market characteristics analysis

3.3 Value chain analysis

Chart on Value chain analysis

4. Market Sizing

4.1 Market definition

Data Table on Offerings of companies included in the market definition

4.2 Market segment analysis

Market segments

4.3 Market size 2025

4.4 Market outlook: Forecast for 2025-2030

Chart on Global - Market size and forecast 2025-2030 ($ million)
Data Table on Global - Market size and forecast 2025-2030 ($ million)
Chart on Global Market: Year-over-year growth 2025-2030 (%)
Data Table on Global Market: Year-over-year growth 2025-2030 (%)

5. Historic Market Size

5.1 Global Blockchain Technology Market 2020 - 2024

Historic Market Size - Data Table on Global Blockchain Technology Market 2020 - 2024 ($ million)

5.2 End-user segment analysis 2020 - 2024

Historic Market Size - End-user Segment 2020 - 2024 ($ million)

5.3 Type segment analysis 2020 - 2024

Historic Market Size - Type Segment 2020 - 2024 ($ million)

5.4 Component segment analysis 2020 - 2024

Historic Market Size - Component Segment 2020 - 2024 ($ million)

5.5 Application segment analysis 2020 - 2024

Historic Market Size - Application Segment 2020 - 2024 ($ million)

5.6 Geography segment analysis 2020 - 2024

Historic Market Size - Geography Segment 2020 - 2024 ($ million)

5.7 Country segment analysis 2020 - 2024

Historic Market Size - Country Segment 2020 - 2024 ($ million)

6. Qualitative Analysis

6.1 Impact of AI on Global Blockchain Technology Market

6.2 Impact of Geopolitical conflicts on Global Blockchain Technology Market

7. Five Forces Analysis

7.1 Five forces summary

Five forces analysis - Comparison between 2025 and 2030

7.2 Bargaining power of buyers

Bargaining power of buyers - Impact of key factors 2025 and 2030

7.3 Bargaining power of suppliers

Bargaining power of suppliers - Impact of key factors in 2025 and 2030

7.4 Threat of new entrants

Threat of new entrants - Impact of key factors in 2025 and 2030

7.5 Threat of substitutes

Threat of substitutes - Impact of key factors in 2025 and 2030

7.6 Threat of rivalry

Threat of rivalry - Impact of key factors in 2025 and 2030

7.7 Market condition

Chart on Market condition - Five forces 2025 and 2030

8. Market Segmentation by End-user

8.1 Market segments

Chart on End-user - Market share 2025-2030 (%)
Data Table on End-user - Market share 2025-2030 (%)

8.2 Comparison by End-user

Chart on Comparison by End-user
Data Table on Comparison by End-user

8.3 BFSI - Market size and forecast 2025-2030

Chart on BFSI - Market size and forecast 2025-2030 ($ million)
Data Table on BFSI - Market size and forecast 2025-2030 ($ million)
Chart on BFSI - Year-over-year growth 2025-2030 (%)
Data Table on BFSI - Year-over-year growth 2025-2030 (%)

8.4 Government - Market size and forecast 2025-2030

Chart on Government - Market size and forecast 2025-2030 ($ million)
Data Table on Government - Market size and forecast 2025-2030 ($ million)
Chart on Government - Year-over-year growth 2025-2030 (%)
Data Table on Government - Year-over-year growth 2025-2030 (%)

8.5 Healthcare - Market size and forecast 2025-2030

Chart on Healthcare - Market size and forecast 2025-2030 ($ million)
Data Table on Healthcare - Market size and forecast 2025-2030 ($ million)
Chart on Healthcare - Year-over-year growth 2025-2030 (%)
Data Table on Healthcare - Year-over-year growth 2025-2030 (%)

8.6 Others - Market size and forecast 2025-2030

Chart on Others - Market size and forecast 2025-2030 ($ million)
Data Table on Others - Market size and forecast 2025-2030 ($ million)
Chart on Others - Year-over-year growth 2025-2030 (%)
Data Table on Others - Year-over-year growth 2025-2030 (%)

8.7 Market opportunity by End-user

Market opportunity by End-user ($ million)
Data Table on Market opportunity by End-user ($ million)

9. Market Segmentation by Type

9.1 Market segments

Chart on Type - Market share 2025-2030 (%)
Data Table on Type - Market share 2025-2030 (%)

9.2 Comparison by Type

Chart on Comparison by Type
Data Table on Comparison by Type

9.3 Private - Market size and forecast 2025-2030

Chart on Private - Market size and forecast 2025-2030 ($ million)
Data Table on Private - Market size and forecast 2025-2030 ($ million)
Chart on Private - Year-over-year growth 2025-2030 (%)
Data Table on Private - Year-over-year growth 2025-2030 (%)

9.4 Public - Market size and forecast 2025-2030

Chart on Public - Market size and forecast 2025-2030 ($ million)
Data Table on Public - Market size and forecast 2025-2030 ($ million)
Chart on Public - Year-over-year growth 2025-2030 (%)
Data Table on Public - Year-over-year growth 2025-2030 (%)

9.5 Hybrid - Market size and forecast 2025-2030

Chart on Hybrid - Market size and forecast 2025-2030 ($ million)
Data Table on Hybrid - Market size and forecast 2025-2030 ($ million)
Chart on Hybrid - Year-over-year growth 2025-2030 (%)
Data Table on Hybrid - Year-over-year growth 2025-2030 (%)

9.6 Market opportunity by Type

Market opportunity by Type ($ million)
Data Table on Market opportunity by Type ($ million)

10. Market Segmentation by Component

10.1 Market segments

Chart on Component - Market share 2025-2030 (%)
Data Table on Component - Market share 2025-2030 (%)

10.2 Comparison by Component

Chart on Comparison by Component
Data Table on Comparison by Component

10.3 Services - Market size and forecast 2025-2030

Chart on Services - Market size and forecast 2025-2030 ($ million)
Data Table on Services - Market size and forecast 2025-2030 ($ million)
Chart on Services - Year-over-year growth 2025-2030 (%)
Data Table on Services - Year-over-year growth 2025-2030 (%)

10.4 Platform - Market size and forecast 2025-2030

Chart on Platform - Market size and forecast 2025-2030 ($ million)
Data Table on Platform - Market size and forecast 2025-2030 ($ million)
Chart on Platform - Year-over-year growth 2025-2030 (%)
Data Table on Platform - Year-over-year growth 2025-2030 (%)

10.5 Hardware - Market size and forecast 2025-2030

Chart on Hardware - Market size and forecast 2025-2030 ($ million)
Data Table on Hardware - Market size and forecast 2025-2030 ($ million)
Chart on Hardware - Year-over-year growth 2025-2030 (%)
Data Table on Hardware - Year-over-year growth 2025-2030 (%)

10.6 Market opportunity by Component

Market opportunity by Component ($ million)
Data Table on Market opportunity by Component ($ million)

11. Market Segmentation by Application

11.1 Market segments

Chart on Application - Market share 2025-2030 (%)
Data Table on Application - Market share 2025-2030 (%)

11.2 Comparison by Application

Chart on Comparison by Application
Data Table on Comparison by Application

11.3 Cryptocurrency - Market size and forecast 2025-2030

Chart on Cryptocurrency - Market size and forecast 2025-2030 ($ million)
Data Table on Cryptocurrency - Market size and forecast 2025-2030 ($ million)
Chart on Cryptocurrency - Year-over-year growth 2025-2030 (%)
Data Table on Cryptocurrency - Year-over-year growth 2025-2030 (%)

11.4 Financial services - Market size and forecast 2025-2030

Chart on Financial services - Market size and forecast 2025-2030 ($ million)
Data Table on Financial services - Market size and forecast 2025-2030 ($ million)
Chart on Financial services - Year-over-year growth 2025-2030 (%)
Data Table on Financial services - Year-over-year growth 2025-2030 (%)

11.5 Supply chain - Market size and forecast 2025-2030

Chart on Supply chain - Market size and forecast 2025-2030 ($ million)
Data Table on Supply chain - Market size and forecast 2025-2030 ($ million)
Chart on Supply chain - Year-over-year growth 2025-2030 (%)
Data Table on Supply chain - Year-over-year growth 2025-2030 (%)

11.6 Others - Market size and forecast 2025-2030

Chart on Others - Market size and forecast 2025-2030 ($ million)
Data Table on Others - Market size and forecast 2025-2030 ($ million)
Chart on Others - Year-over-year growth 2025-2030 (%)
Data Table on Others - Year-over-year growth 2025-2030 (%)

11.7 Market opportunity by Application

Market opportunity by Application ($ million)
Data Table on Market opportunity by Application ($ million)

12. Customer Landscape

12.1 Customer landscape overview

Analysis of price sensitivity, lifecycle, customer purchase basket, adoption rates, and purchase criteria

13. Geographic Landscape

13.1 Geographic segmentation

Chart on Market share by geography 2025-2030 (%)
Data Table on Market share by geography 2025-2030 (%)

13.2 Geographic comparison

Chart on Geographic comparison
Data Table on Geographic comparison

13.3 North America - Market size and forecast 2025-2030

Chart on North America - Market size and forecast 2025-2030 ($ million)
Data Table on North America - Market size and forecast 2025-2030 ($ million)
Chart on North America - Year-over-year growth 2025-2030 (%)
Data Table on North America - Year-over-year growth 2025-2030 (%)
Chart on Regional Comparison - North America
Data Table on Regional Comparison - North America

13.3.1 US - Market size and forecast 2025-2030

Chart on US - Market size and forecast 2025-2030 ($ million)
Data Table on US - Market size and forecast 2025-2030 ($ million)
Chart on US - Year-over-year growth 2025-2030 (%)
Data Table on US - Year-over-year growth 2025-2030 (%)

13.3.2 Canada - Market size and forecast 2025-2030

Chart on Canada - Market size and forecast 2025-2030 ($ million)
Data Table on Canada - Market size and forecast 2025-2030 ($ million)
Chart on Canada - Year-over-year growth 2025-2030 (%)
Data Table on Canada - Year-over-year growth 2025-2030 (%)

13.3.3 Mexico - Market size and forecast 2025-2030

Chart on Mexico - Market size and forecast 2025-2030 ($ million)
Data Table on Mexico - Market size and forecast 2025-2030 ($ million)
Chart on Mexico - Year-over-year growth 2025-2030 (%)
Data Table on Mexico - Year-over-year growth 2025-2030 (%)

13.4 Europe - Market size and forecast 2025-2030

Chart on Europe - Market size and forecast 2025-2030 ($ million)
Data Table on Europe - Market size and forecast 2025-2030 ($ million)
Chart on Europe - Year-over-year growth 2025-2030 (%)
Data Table on Europe - Year-over-year growth 2025-2030 (%)
Chart on Regional Comparison - Europe
Data Table on Regional Comparison - Europe

13.4.1 UK - Market size and forecast 2025-2030

Chart on UK - Market size and forecast 2025-2030 ($ million)
Data Table on UK - Market size and forecast 2025-2030 ($ million)
Chart on UK - Year-over-year growth 2025-2030 (%)
Data Table on UK - Year-over-year growth 2025-2030 (%)

13.4.2 Germany - Market size and forecast 2025-2030

Chart on Germany - Market size and forecast 2025-2030 ($ million)
Data Table on Germany - Market size and forecast 2025-2030 ($ million)
Chart on Germany - Year-over-year growth 2025-2030 (%)
Data Table on Germany - Year-over-year growth 2025-2030 (%)

13.4.3 France - Market size and forecast 2025-2030

Chart on France - Market size and forecast 2025-2030 ($ million)
Data Table on France - Market size and forecast 2025-2030 ($ million)
Chart on France - Year-over-year growth 2025-2030 (%)
Data Table on France - Year-over-year growth 2025-2030 (%)

13.4.4 Switzerland - Market size and forecast 2025-2030

Chart on Switzerland - Market size and forecast 2025-2030 ($ million)
Data Table on Switzerland - Market size and forecast 2025-2030 ($ million)
Chart on Switzerland - Year-over-year growth 2025-2030 (%)
Data Table on Switzerland - Year-over-year growth 2025-2030 (%)

13.4.5 Spain - Market size and forecast 2025-2030

Chart on Spain - Market size and forecast 2025-2030 ($ million)
Data Table on Spain - Market size and forecast 2025-2030 ($ million)
Chart on Spain - Year-over-year growth 2025-2030 (%)
Data Table on Spain - Year-over-year growth 2025-2030 (%)

13.4.6 Italy - Market size and forecast 2025-2030

Chart on Italy - Market size and forecast 2025-2030 ($ million)
Data Table on Italy - Market size and forecast 2025-2030 ($ million)
Chart on Italy - Year-over-year growth 2025-2030 (%)
Data Table on Italy - Year-over-year growth 2025-2030 (%)

13.5 APAC - Market size and forecast 2025-2030

Chart on APAC - Market size and forecast 2025-2030 ($ million)
Data Table on APAC - Market size and forecast 2025-2030 ($ million)
Chart on APAC - Year-over-year growth 2025-2030 (%)
Data Table on APAC - Year-over-year growth 2025-2030 (%)
Chart on Regional Comparison - APAC
Data Table on Regional Comparison - APAC

13.5.1 China - Market size and forecast 2025-2030

Chart on China - Market size and forecast 2025-2030 ($ million)
Data Table on China - Market size and forecast 2025-2030 ($ million)
Chart on China - Year-over-year growth 2025-2030 (%)
Data Table on China - Year-over-year growth 2025-2030 (%)

13.5.2 Japan - Market size and forecast 2025-2030

Chart on Japan - Market size and forecast 2025-2030 ($ million)
Data Table on Japan - Market size and forecast 2025-2030 ($ million)
Chart on Japan - Year-over-year growth 2025-2030 (%)
Data Table on Japan - Year-over-year growth 2025-2030 (%)

13.5.3 India - Market size and forecast 2025-2030

Chart on India - Market size and forecast 2025-2030 ($ million)
Data Table on India - Market size and forecast 2025-2030 ($ million)
Chart on India - Year-over-year growth 2025-2030 (%)
Data Table on India - Year-over-year growth 2025-2030 (%)

13.5.4 Singapore - Market size and forecast 2025-2030

Chart on Singapore - Market size and forecast 2025-2030 ($ million)
Data Table on Singapore - Market size and forecast 2025-2030 ($ million)
Chart on Singapore - Year-over-year growth 2025-2030 (%)
Data Table on Singapore - Year-over-year growth 2025-2030 (%)

13.5.5 South Korea - Market size and forecast 2025-2030

Chart on South Korea - Market size and forecast 2025-2030 ($ million)
Data Table on South Korea - Market size and forecast 2025-2030 ($ million)
Chart on South Korea - Year-over-year growth 2025-2030 (%)
Data Table on South Korea - Year-over-year growth 2025-2030 (%)

13.5.6 Indonesia - Market size and forecast 2025-2030

Chart on Indonesia - Market size and forecast 2025-2030 ($ million)
Data Table on Indonesia - Market size and forecast 2025-2030 ($ million)
Chart on Indonesia - Year-over-year growth 2025-2030 (%)
Data Table on Indonesia - Year-over-year growth 2025-2030 (%)

13.6 South America - Market size and forecast 2025-2030

Chart on South America - Market size and forecast 2025-2030 ($ million)
Data Table on South America - Market size and forecast 2025-2030 ($ million)
Chart on South America - Year-over-year growth 2025-2030 (%)
Data Table on South America - Year-over-year growth 2025-2030 (%)
Chart on Regional Comparison - South America
Data Table on Regional Comparison - South America

13.6.1 Brazil - Market size and forecast 2025-2030

Chart on Brazil - Market size and forecast 2025-2030 ($ million)
Data Table on Brazil - Market size and forecast 2025-2030 ($ million)
Chart on Brazil - Year-over-year growth 2025-2030 (%)
Data Table on Brazil - Year-over-year growth 2025-2030 (%)

13.6.2 Argentina - Market size and forecast 2025-2030

Chart on Argentina - Market size and forecast 2025-2030 ($ million)
Data Table on Argentina - Market size and forecast 2025-2030 ($ million)
Chart on Argentina - Year-over-year growth 2025-2030 (%)
Data Table on Argentina - Year-over-year growth 2025-2030 (%)

13.6.3 Colombia - Market size and forecast 2025-2030

Chart on Colombia - Market size and forecast 2025-2030 ($ million)
Data Table on Colombia - Market size and forecast 2025-2030 ($ million)
Chart on Colombia - Year-over-year growth 2025-2030 (%)
Data Table on Colombia - Year-over-year growth 2025-2030 (%)

13.7 Middle East and Africa - Market size and forecast 2025-2030

Chart on Middle East and Africa - Market size and forecast 2025-2030 ($ million)
Data Table on Middle East and Africa - Market size and forecast 2025-2030 ($ million)
Chart on Middle East and Africa - Year-over-year growth 2025-2030 (%)
Data Table on Middle East and Africa - Year-over-year growth 2025-2030 (%)
Chart on Regional Comparison - Middle East and Africa
Data Table on Regional Comparison - Middle East and Africa

13.7.1 UAE - Market size and forecast 2025-2030

Chart on UAE - Market size and forecast 2025-2030 ($ million)
Data Table on UAE - Market size and forecast 2025-2030 ($ million)
Chart on UAE - Year-over-year growth 2025-2030 (%)
Data Table on UAE - Year-over-year growth 2025-2030 (%)

13.7.2 Saudi Arabia - Market size and forecast 2025-2030

Chart on Saudi Arabia - Market size and forecast 2025-2030 ($ million)
Data Table on Saudi Arabia - Market size and forecast 2025-2030 ($ million)
Chart on Saudi Arabia - Year-over-year growth 2025-2030 (%)
Data Table on Saudi Arabia - Year-over-year growth 2025-2030 (%)

13.7.3 South Africa - Market size and forecast 2025-2030

Chart on South Africa - Market size and forecast 2025-2030 ($ million)
Data Table on South Africa - Market size and forecast 2025-2030 ($ million)
Chart on South Africa - Year-over-year growth 2025-2030 (%)
Data Table on South Africa - Year-over-year growth 2025-2030 (%)

13.7.4 Israel - Market size and forecast 2025-2030

Chart on Israel - Market size and forecast 2025-2030 ($ million)
Data Table on Israel - Market size and forecast 2025-2030 ($ million)
Chart on Israel - Year-over-year growth 2025-2030 (%)
Data Table on Israel - Year-over-year growth 2025-2030 (%)

13.7.5 Nigeria - Market size and forecast 2025-2030

Chart on Nigeria - Market size and forecast 2025-2030 ($ million)
Data Table on Nigeria - Market size and forecast 2025-2030 ($ million)
Chart on Nigeria - Year-over-year growth 2025-2030 (%)
Data Table on Nigeria - Year-over-year growth 2025-2030 (%)

13.8 Market opportunity by geography

Market opportunity by geography ($ million)
Data Tables on Market opportunity by geography ($ million)

14. Drivers, Challenges, and Opportunity

14.1 Market drivers

Increasing demand for supply chain transparency and traceability
Rising need for secure and efficient cross border payments
Proliferation of decentralized finance and smart contract automation

14.2 Market challenges

Regulatory fragmentation and compliance complexities
Scalability limitations and high energy consumption
Interoperability deficits and integration hurdles

14.3 Impact of drivers and challenges

Impact of drivers and challenges in 2025 and 2030

14.4 Market opportunities

Rise of central bank digital currencies and institutional tokenization
Integration of AI with decentralized networks
Advancement of eco friendly consensus mechanisms and sustainable frameworks

15. Competitive Landscape

15.1 Overview

15.2

Overview on criticality of inputs and factors of differentiation

15.3 Landscape disruption

Overview on factors of disruption

15.4 Industry risks

Impact of key risks on business

16. Competitive Analysis

16.1 Companies profiled

Companies covered

16.2 Company ranking index

16.3 Market positioning of companies

Matrix on companies position and classification

16.4 Accenture Plc

Accenture Plc - Overview
Accenture Plc - Business segments
Accenture Plc - Key news
Accenture Plc - Key offerings
Accenture Plc - Segment focus
SWOT

16.5 Alchemy Insights Inc.

Alchemy Insights Inc. - Overview
Alchemy Insights Inc. - Product / Service
Alchemy Insights Inc. - Key offerings
SWOT

16.6 Amazon.com Inc.

Amazon.com Inc. - Overview
Amazon.com Inc. - Business segments
Amazon.com Inc. - Key news
Amazon.com Inc. - Key offerings
Amazon.com Inc. - Segment focus
SWOT

16.7 Bitfury Group Ltd.

Bitfury Group Ltd. - Overview
Bitfury Group Ltd. - Product / Service
Bitfury Group Ltd. - Key offerings
SWOT

16.8 Blockdaemon Inc.

Blockdaemon Inc. - Overview
Blockdaemon Inc. - Product / Service
Blockdaemon Inc. - Key offerings
SWOT

16.9 Chainalysis Inc.

Chainalysis Inc. - Overview
Chainalysis Inc. - Product / Service
Chainalysis Inc. - Key offerings
SWOT

16.10 Coinbase Global Inc.

Coinbase Global Inc. - Overview
Coinbase Global Inc. - Product / Service
Coinbase Global Inc. - Key offerings
SWOT

16.11 Fujitsu Ltd.

Fujitsu Ltd. - Overview
Fujitsu Ltd. - Business segments
Fujitsu Ltd. - Key offerings
Fujitsu Ltd. - Segment focus
SWOT

16.12 IBM Corp.

IBM Corp. - Overview
IBM Corp. - Business segments
IBM Corp. - Key news
IBM Corp. - Key offerings
IBM Corp. - Segment focus
SWOT

16.13 Infosys Ltd.

Infosys Ltd. - Overview
Infosys Ltd. - Business segments
Infosys Ltd. - Key news
Infosys Ltd. - Key offerings
Infosys Ltd. - Segment focus
SWOT

16.14 NTT DATA Corp.

NTT DATA Corp. - Overview
NTT DATA Corp. - Business segments
NTT DATA Corp. - Key offerings
NTT DATA Corp. - Segment focus
SWOT

16.15 Oracle Corp.

Oracle Corp. - Overview
Oracle Corp. - Business segments
Oracle Corp. - Key news
Oracle Corp. - Key offerings
Oracle Corp. - Segment focus
SWOT

16.16 Ripple Labs Inc.

Ripple Labs Inc. - Overview
Ripple Labs Inc. - Product / Service
Ripple Labs Inc. - Key offerings
SWOT

16.17 Tata Consultancy Services

Tata Consultancy Services - Overview
Tata Consultancy Services - Business segments
Tata Consultancy Services - Key news
Tata Consultancy Services - Key offerings
Tata Consultancy Services - Segment focus
SWOT

16.18 Wipro Ltd.

Wipro Ltd. - Overview
Wipro Ltd. - Business segments
Wipro Ltd. - Key news
Wipro Ltd. - Key offerings
Wipro Ltd. - Segment focus
SWOT

17. Appendix

17.1 Scope of the report

Market definition
Objectives
Notes and caveats

17.2 Inclusions and exclusions checklist

Inclusions checklist
Exclusions checklist

17.3 Currency conversion rates for US$

17.4 Research methodology

17.5 Data procurement

Information sources

17.6 Data validation

17.7 Validation techniques employed for market sizing

17.8 Data synthesis

17.9 360 degree market analysis

17.10 List of abbreviations

Research Methodology

Technavio presents a detailed picture of the market by way of study, synthesis, and summation of data from multiple sources. The analysts have presented the various facets of the market with a particular focus on identifying the key industry influencers. The data thus presented is comprehensive, reliable, and the result of extensive research, both primary and secondary.

INFORMATION SOURCES

Primary sources

  • Manufacturers and suppliers
  • Channel partners
  • Industry experts
  • Strategic decision makers

Secondary sources

  • Industry journals and periodicals
  • Government data
  • Financial reports of key industry players
  • Historical data
  • Press releases

DATA ANALYSIS

Data Synthesis

  • Collation of data
  • Estimation of key figures
  • Analysis of derived insights

Data Validation

  • Triangulation with data models
  • Reference against proprietary databases
  • Corroboration with industry experts

REPORT WRITING

Qualitative

  • Market drivers
  • Market challenges
  • Market trends
  • Five forces analysis

Quantitative

  • Market size and forecast
  • Market segmentation
  • Geographical insights
  • Competitive landscape

Interested in this report?

Get your sample now to see our research methodology and insights!

Download Now

Frequently Asked Questions

Blockchain Technology market growth will increase by USD 77595.5 million during 2026-2030.

The Blockchain Technology market is expected to grow at a CAGR of 58.4% during 2026-2030.

Blockchain Technology market is segmented by End-user (BFSI, Government, Healthcare, Others) Type (Private, Public, Hybrid) Component (Services, Platform, Hardware) Application (Cryptocurrency, Financial services, Supply chain, Others)

Accenture Plc, Alchemy Insights Inc., Amazon.com Inc., Bitfury Group Ltd., Blockdaemon Inc., Chainalysis Inc., Coinbase Global Inc., Consensys Software Inc., Fireblocks, Fujitsu Ltd., IBM Corp., Infosys Ltd., Kaleido Inc., NTT DATA Corp., Oracle Corp., Polygon Labs, R3, Ripple Labs Inc., Tata Consultancy Services, Wipro Ltd. are a few of the key vendors in the Blockchain Technology market.

North America will register the highest growth rate of 42.9% among the other regions. Therefore, the Blockchain Technology market in North America is expected to garner significant business opportunities for the vendors during the forecast period.

US, Canada, Mexico, UK, Germany, France, Switzerland, Spain, Italy, China, Japan, India, Singapore, South Korea, Indonesia, Brazil, Argentina, Colombia, UAE, Saudi Arabia, South Africa, Israel, Nigeria

  • Increasing demand for supply chain transparency and traceability is the driving factor this market.

The Blockchain Technology market vendors should focus on grabbing business opportunities from the End-user segment as it accounted for the largest market share in the base year.
RIA - Research AI Assistant
Ask RIA
