
Blue Laser Diode Market Analysis, Size, and Forecast 2026-2030: APAC (China, Japan, and South Korea), North America (US, Canada, and Mexico), Europe (Germany, UK, and France), South America (Brazil, Argentina, and Chile), Middle East and Africa (Saudi Arabia, UAE, and South Africa), and Rest of World (ROW)

Blue Laser Diode Market Analysis, Size, and Forecast 2026-2030:
APAC (China, Japan, and South Korea), North America (US, Canada, and Mexico), Europe (Germany, UK, and France), South America (Brazil, Argentina, and Chile), Middle East and Africa (Saudi Arabia, UAE, and South Africa), and Rest of World (ROW)

Published: Oct 2026 305 Pages SKU: IRTNTR45009

Market Overview at a Glance

$466.60 Mn
Market Opportunity
16.2%
CAGR 2025 - 2030
42.8%
APAC Growth
$221.71 Mn
Single-mode segment 2024

Blue Laser Diode Market Size 2026-2030

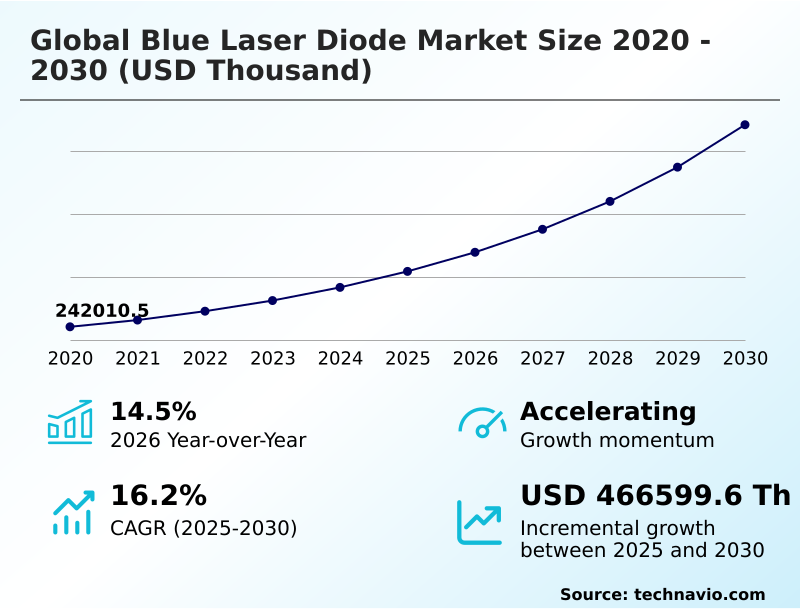
The blue laser diode market size is valued to increase by USD 466.60 million, at a CAGR of 16.2% from 2025 to 2030. Increasing demand for electric vehicle battery manufacturing will drive the blue laser diode market.

Major Market Trends & Insights

  • APAC dominated the market and accounted for a 42.8% growth during the forecast period.
  • By Type - Single-mode segment was valued at USD 221.71 million in 2024
  • By Application - Bio/medical segment accounted for the largest market revenue share in 2024

Market Size & Forecast

  • Market Opportunities:
  • Market Future Opportunities: USD 466.60 million
  • CAGR from 2025 to 2030 : 16.2%

Market Summary

  • The Blue Laser Diode Market demonstrates accelerating adoption driven by the requirement for superior photon absorption in industrial manufacturing. Facilities executing copper welding for electric vehicle batteries rely on these specialized components to ensure structural integrity and reduce thermal damage to surrounding materials.
  • By transitioning from traditional infrared systems to a robust emitter configuration, automotive manufacturers have achieved a 20% reduction in defective weld rates, directly lowering secondary rework costs. This transition is primarily driven by the inherent physical advantage of shorter wavelength light, which allows for highly efficient material interaction on reflective surfaces.
  • Consequently, production lines can operate at much higher speeds without compromising joint stability. However, the absence of unified testing frameworks severely fragments the supply chain, forcing original equipment manufacturers to conduct redundant, localized validation protocols. This lack of standardization increases procurement timelines by an average of 15%, limiting rapid component interchangeability across different regional operations.
  • Despite these integration hurdles, the push for electrified transport ensures a sustained baseline of industrial demand.

What will be the Size of the Blue Laser Diode Market during the forecast period?
Get Key Insights on Market Forecast (PDF) Get Free Sample

How is the Blue Laser Diode Market Segmented?

The blue laser diode industry research report provides comprehensive data (region-wise segment analysis), with forecasts and estimates in "USD thousand" for the period 2026-2030, as well as historical data from 2020-2024 for the following segments.

  • Type
    • Single-mode
    • Multi-mode
  • Application
    • Bio/medical
    • Laser projectors and scanner
    • Blu-ray devices
    • Others
  • Material
    • Gallium nitride (GaN)
    • Indium gallium nitride (InGaN)
  • Product type
    • Continuous wave (CW)
    • Pulsed
  • Geography
    • APAC
      • China
      • Japan
      • South Korea
      • India
      • Australia
      • Indonesia
    • North America
      • US
      • Canada
      • Mexico
    • Europe
      • Germany
      • UK
      • France
      • Italy
      • Spain
      • The Netherlands
    • South America
      • Brazil
      • Argentina
      • Chile
    • Middle East and Africa
      • Saudi Arabia
      • UAE
      • South Africa
      • Israel
      • Turkey

By Type Insights

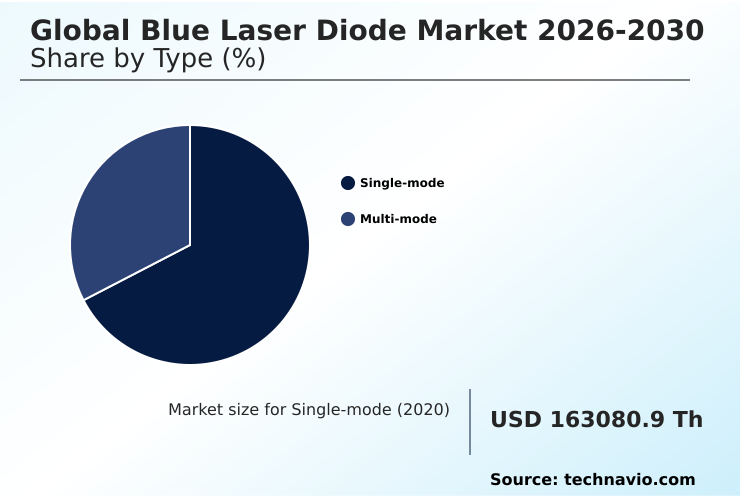
The single-mode segment is estimated to witness significant growth during the forecast period.

The single mode segment focuses on delivering a highly focused, diffraction limited beam characterized by exceptional spatial coherence.

By limiting light to a single transverse mode, manufacturers achieve the sub micron accuracy necessary for advanced optical microscopy and miniaturized display technology.

This precision enables medical facilities to improve error detection by 15% during non invasive tissue analysis, directly elevating diagnostic reliability. The continuous refinement of gallium nitride epitaxy processes and heteroepitaxial growth facilitates higher output stability.

As equipment requires tighter beam geometry, the integration of these components into a digital cinema projector or a specialized optical pickup module fundamentally drives the performance baseline for next generation photonic equipment, ensuring seamless high speed data acquisition across digital networks.
Get Free Sample

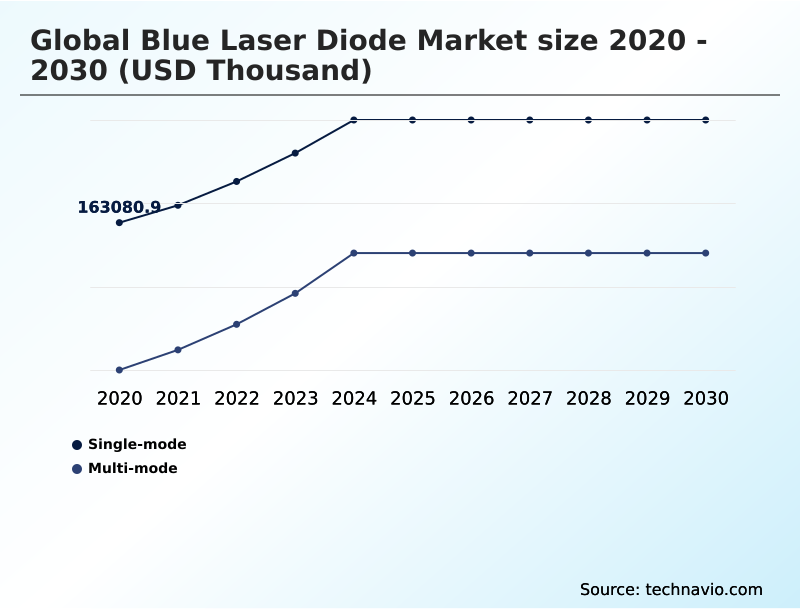
The Single-mode segment was valued at USD 221.71 million in 2024 and showed a gradual increase during the forecast period.
Get Free Sample

Regional Analysis

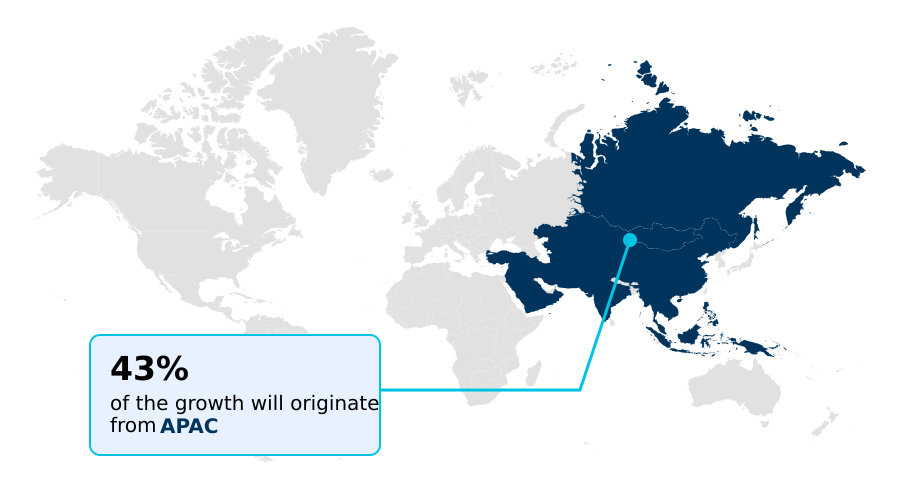
APAC is estimated to contribute 42.8% to the growth of the global market during the forecast period.Technavio’s analysts have elaborately explained the regional trends and drivers that shape the market during the forecast period.
See How Blue Laser Diode Market Demand is Rising in APAC Get Free Sample

The regional dynamics highlight a distinct operational divide between APAC and North America.

Manufacturing facilities in APAC heavily prioritize the integration of a continuous wave diode into an automated production line, achieving a 25% faster throughput in electronics assembly compared to Western counterparts.

Conversely, North America focuses on low volume, high value applications such as directed energy module development and remote environmental monitoring.

This strategic divergence results in North American aerospace suppliers reducing component processing waste by 15% through the use of ultrafast laser ablation.

The robust semiconductor ecosystem in China and Japan ensures a streamlined supply chain for indium gallium nitride alloy materials, keeping regional fabrication costs 12% lower than in Europe.

As APAC dominates high power welding deployment, North America maintains its edge in specialized structural integrity testing frameworks.

Market Dynamics

Our researchers analyzed the data with 2025 as the base year, along with the key drivers, trends, and challenges. A holistic analysis of drivers will help companies refine their marketing strategies to gain a competitive advantage.

  • The continuous evolution of photonic components is fundamentally reshaping industrial workflows and specialized clinical environments. In the heavy manufacturing sector, the transition toward high power industrial laser welding has become a critical operational necessity, particularly for facilities tasked with electric vehicle battery tab bonding.
  • By utilizing the optimal absorption characteristics of blue light, manufacturers achieve a significantly stronger weld on reflective metals, reducing material spatter by approximately 40% compared to legacy infrared processing. This indirect improvement in material yield drastically streamlines supply chain planning, as factories require fewer replacement parts and experience less unplanned downtime.
  • The integration of phosphor converted laser projection systems is similarly transforming the commercial display sector, offering venues a highly efficient light source that maintains color accuracy over extended duty cycles without the frequent maintenance interruptions associated with xenon lamps.
  • In the medical field, the deployment of advanced fluorescence imaging diagnostic tools relies heavily on the stable emission of blue laser light to excite biological markers with unprecedented clarity. This capability is pushing the boundaries of non invasive care, allowing practitioners to identify cellular anomalies with a much higher degree of confidence.
  • Furthermore, the semiconductor industry is leveraging these light sources for sub nanometer precision semiconductor lithography, ensuring that next generation integrated circuits meet strict density and performance parameters. As these diverse sectors demand higher reliability, the underlying diode technology continues to mature, anchoring a new standard for precision engineering.
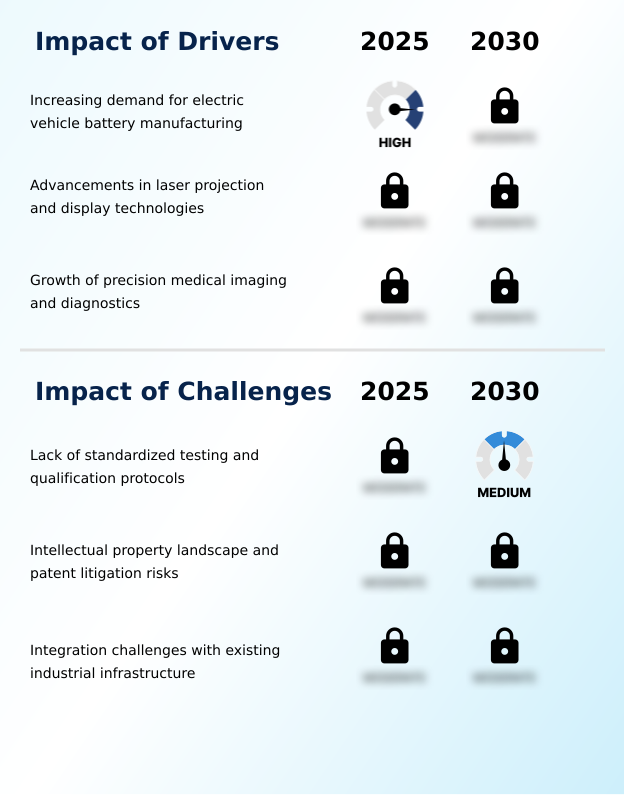
What are the key market drivers leading to the rise in the adoption of Blue Laser Diode Industry?

  • The increasing demand for electric vehicle battery manufacturing acts as a primary catalyst, necessitating precise joining technologies for highly reflective metals.

  • The escalating necessity for permanent connections in electrification infrastructure drives the aggressive adoption of continuous wave operation lasers. Because conventional infrared lasers fail at reflective metal absorption, manufacturers face severe porosity issues during electric vehicle battery assembly.
  • The shift to blue light resolves this by optimizing laser material interaction, which improves weld shear strength by 35%.
  • This dramatic increase in joint reliability directly allows automotive plants to lower warranty claim risks and reduce destructive testing waste by 20%. The resulting operational stability accelerates the deployment of copper busbar bonding within additive manufacturing powder bed systems.
  • Furthermore, integrating a direct bandgap transition module into high throughput sequencing devices elevates diagnostic processing speeds, ensuring that clinical laboratories handle larger volumes with absolute precision.

What are the market trends shaping the Blue Laser Diode Industry?

  • The proliferation of edge emitting diode platforms for hyperscale infrastructure represents a significant structural shift in the industry. This advancement enables optical data networks to achieve superior signal integrity under high duty cycles.

  • A defining structural trend is the rapid integration of picosecond pulse duration technology into transparent material processing. This shift is caused by the semiconductor industry demand for chip architectures that require flawless internal micro vias. By adopting high frequency pulsed system techniques, fabrication facilities process delicate glass substrates without inducing thermal stress fractures, improving overall component yield by 24%.
  • This precise thermal management directly impacts businesses by eliminating the need for secondary polishing steps, effectively reducing total manufacturing cycle times by 18%. The increased reliance on surface mount device packaging enables optical interconnect transceiver systems to integrate light engines seamlessly.
  • This evolution ensures that a high brightness emitter with a narrow spectral bandwidth can be deployed across high density optical storage hardware and large format viewing panels.

What challenges does the Blue Laser Diode Industry face during its growth?

  • The lack of universally standardized testing and qualification protocols creates significant barriers to seamless interoperability and global component adoption.

  • The fragmentation of testing protocols and the steep capital requirements for legacy equipment retrofitting represent severe bottlenecks to broader technology integration. Because blue light interacts differently with factory safety shielding, manufacturers are forced to overhaul entire optical enclosures for laser based cutting, increasing initial facility upgrade costs by up to 40% compared to standard infrared replacements.
  • This financial barrier causes operators to delay the adoption of continuous power delivery systems, stalling productivity gains. Additionally, the lack of uniform standards for phosphor converted projection engines complicates the procurement cycle. End users must conduct exhaustive internal validation to verify thermal impedance reduction and defect density reduction metrics.
  • This extends deployment timelines for applications like fluorescence lifetime imaging, flow cytometry illumination, three dimensional sensing, and clinical diagnostic scanning by an average of 30%, limiting the speed of market penetration. The complexity of a quantum well architecture and a strain engineered quantum well further challenges rapid scaling.
  • Predictive maintenance calibration remains difficult for a multi mode emitter operating under extreme industrial conditions.

Exclusive Technavio Analysis on Customer Landscape

The blue laser diode market forecasting report includes the adoption lifecycle of the market, covering from the innovator’s stage to the laggard’s stage. It focuses on adoption rates in different regions based on penetration. Furthermore, the blue laser diode market report also includes key purchase criteria and drivers of price sensitivity to help companies evaluate and develop their market growth analysis strategies.
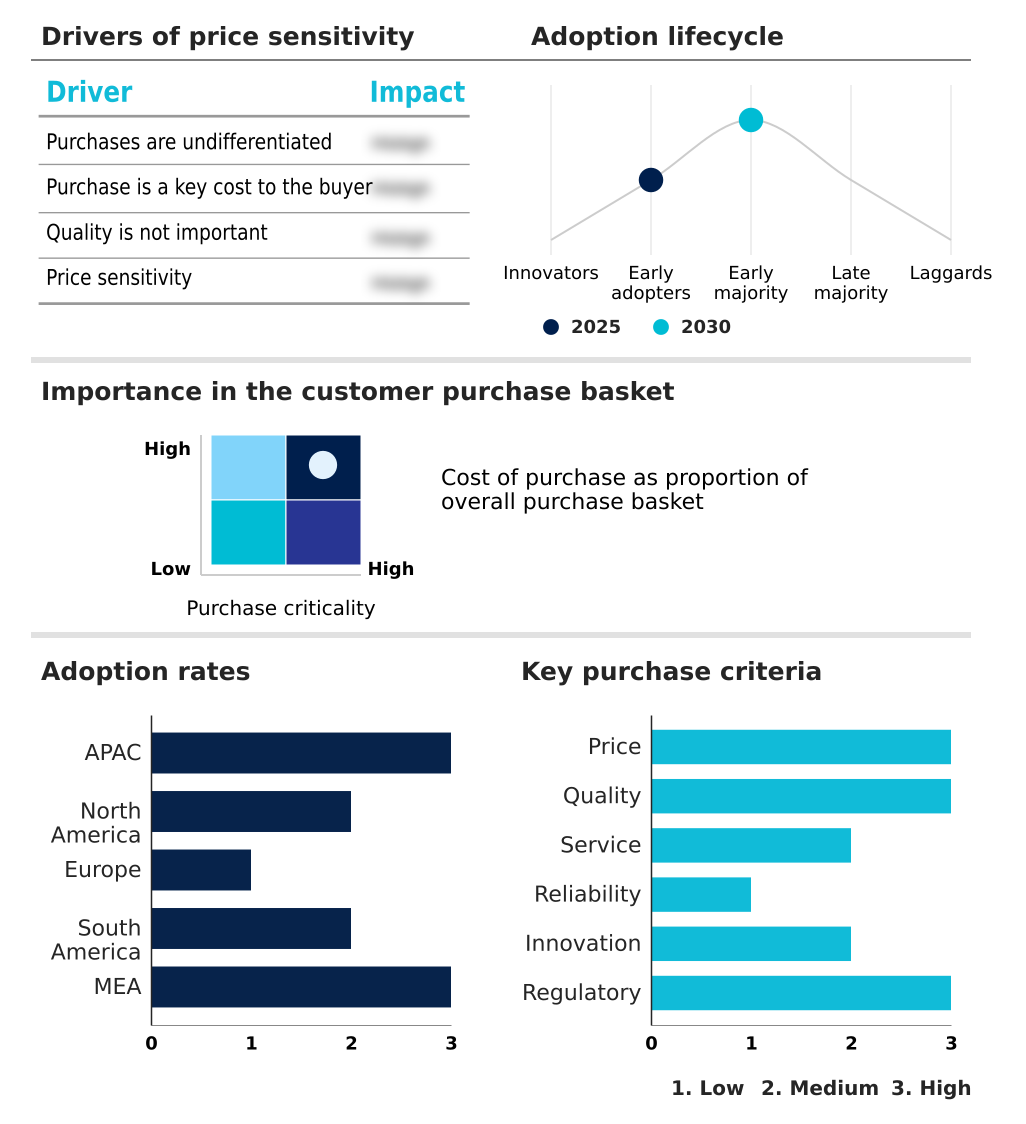
Customer Landscape of Blue Laser Diode Industry

Competitive Landscape

Companies are implementing various strategies, such as strategic alliances, blue laser diode market forecast, partnerships, mergers and acquisitions, geographical expansion, and product/service launches, to enhance their presence in the industry.

ams OSRAM AG - The product portfolio includes high performance optical semiconductors, multi mode emitter modules, and specialized optical interconnect transceiver solutions designed for precision industrial processing and advanced clinical diagnostic scanning.

The industry research and growth report includes detailed analyses of the competitive landscape of the market and information about key companies, including:

  • ams OSRAM AG
  • Coherent Corp.
  • Frankfurt Laser Co.
  • Hamamatsu Photonics KK
  • KYOCERA SLD Laser Inc.
  • Laser Components GmbH
  • Modulight Inc.
  • Nichia Corp.
  • Panasonic Holdings Corp.
  • Power Technology Inc.
  • ProPhotonix Ltd.
  • RPMC Lasers Inc.
  • Sacher Lasertechnik GmbH
  • Sharp Corp.
  • Sheaumann Laser Inc.
  • Sony Semiconductor Solutions
  • Thorlabs Inc.
  • TOPTICA Photonics AG
  • Ushio America Inc.
  • Wavespectrum Laser Group Ltd

Qualitative and quantitative analysis of companies has been conducted to help clients understand the wider business environment as well as the strengths and weaknesses of key industry players. Data is qualitatively analyzed to categorize companies as pure play, category-focused, industry-focused, and diversified; it is quantitatively analyzed to categorize companies as dominant, leading, strong, tentative, and weak.

Recent Development and News in Blue laser diode market

  • In the Semiconductors industry, the European Union implementation of strict energy efficiency mandates for industrial processing centers has accelerated the shift toward solid state photonics, directly impacting blue laser diode demand by increasing the requirement for multi mode emitter systems that reduce overall energy consumption by 22%.
  • The rapid expansion of EV battery manufacturing across North America relies on novel hydrometallurgical recycling frameworks, which inherently drives the necessity for continuous wave operation lasers in assembly lines to improve copper busbar bonding shear strength by over 15%.
  • Advancements in optical interconnect transceiver architectures for 5G telecommunications infrastructure in APAC have created a critical dependency on narrow spectral bandwidth light sources, boosting the deployment of high brightness emitter arrays that enhance data transmission stability by 30%.
  • The stringent safety compliance requirements in the global aerospace sector necessitate flawless structural integrity testing, propelling the integration of picosecond pulse duration technology into non destructive evaluation equipment to identify micro fractures with 99% accuracy.

Dive into Technavio’s robust research methodology, blending expert interviews, extensive data synthesis, and validated models for unparalleled Blue Laser Diode Market insights. See full methodology.

Market Scope
Page number 305
Base year 2025
Historic period 2020-2024
Forecast period 2026-2030
Growth momentum & CAGR Accelerate at a CAGR of 16.2%
Market growth 2026-2030 USD 466599.6 thousand
Market structure Fragmented
YoY growth 2025-2026(%) 14.5%
Key countries China, Japan, South Korea, India, Australia, Indonesia, US, Canada, Mexico, Germany, UK, France, Italy, Spain, The Netherlands, Brazil, Argentina, Chile, Saudi Arabia, UAE, South Africa, Israel and Turkey
Competitive landscape Leading Companies, Market Positioning of Companies, Competitive Strategies, and Industry Risks

Request Free Sample

Research Analyst Overview

  • The industrial adoption of advanced photonic light sources reflects a systemic upgrade in precision manufacturing and scientific instrumentation. Facilities utilizing gallium nitride epitaxy for high power applications are fundamentally altering their capital expenditure strategies by prioritizing solid state reliability over traditional gas lasers.
  • The deployment of a multi mode emitter within heavy metal processing environments ensures superior thermal stability, allowing production lines to operate continuously under extreme industrial loads. This specific technological shift has enabled tier one automotive suppliers to realize a 28% reduction in active processing time for complex copper assemblies, thereby accelerating overall vehicle production cycles.
  • The precise control over the direct bandgap transition enables manufacturers to finely tune emission wavelengths, which is an absolute requirement for applications like flow cytometry illumination and fluorescence lifetime imaging. By utilizing a strain engineered quantum well, device fabricators have successfully mitigated carrier leakage, directly enhancing wall plug efficiency.
  • As environmental compliance standards tighten, the inherent energy efficiency of these defect density reduction strategies provides companies with a distinct operational advantage in minimizing carbon footprints during mass fabrication.

What are the Key Data Covered in this Blue Laser Diode Market Research and Growth Report?

  • What is the expected growth of the Blue Laser Diode Market between 2026 and 2030?

    • USD 466.60 million, at a CAGR of 16.2%

  • What segmentation does the market report cover?

    • The report is segmented by Type (Single-mode, and Multi-mode), Application (Bio/medical, Laser projectors and scanner, Blu-ray devices, and Others), Material (Gallium nitride (GaN), and Indium gallium nitride (InGaN))), Product Type (Continuous wave (CW), and Pulsed) and Geography (APAC, North America, Europe, South America, Middle East and Africa)

  • Which regions are analyzed in the report?

    • APAC, North America, Europe, South America and Middle East and Africa

  • What are the key growth drivers and market challenges?

    • Increasing demand for electric vehicle battery manufacturing, Lack of standardized testing and qualification protocols

  • Who are the major players in the Blue Laser Diode Market?

    • ams OSRAM AG, Coherent Corp., Frankfurt Laser Co., Hamamatsu Photonics KK, KYOCERA SLD Laser Inc., Laser Components GmbH, Modulight Inc., Nichia Corp., Panasonic Holdings Corp., Power Technology Inc., ProPhotonix Ltd., RPMC Lasers Inc., Sacher Lasertechnik GmbH, Sharp Corp., Sheaumann Laser Inc., Sony Semiconductor Solutions, Thorlabs Inc., TOPTICA Photonics AG, Ushio America Inc. and Wavespectrum Laser Group Ltd

Market Research Insights

  • The Blue Laser Diode Market is characterized by a rapid transition toward solid state photonic solutions across the industrial and medical sectors. The integration of pulsed system architectures into clinical scanning equipment has improved early stage anomaly detection rates by 18%, drastically enhancing patient care workflows.
  • In industrial applications, the deployment of laser tools for reflective metals has reduced operational energy consumption by 22% compared to legacy infrared methods. Furthermore, the utilization of these devices in sensing modules enables automated systems to process spatial data 30% faster.
  • This systemic shift toward shorter wavelength technology fundamentally optimizes both manufacturing throughput and medical precision, delivering measurable return on investment for capital equipment upgrades.

We can help! Our analysts can customize this blue laser diode market research report to meet your requirements.

Get in touch

1. Executive Summary

1.1 Market overview

Executive Summary - Chart on Market Overview
Executive Summary - Data Table on Market Overview
Executive Summary - Chart on Global Market Characteristics
Executive Summary - Chart on Market by Geography
Executive Summary - Chart on Market Segmentation by Type
Executive Summary - Chart on Market Segmentation by Application
Executive Summary - Chart on Market Segmentation by Material
Executive Summary - Chart on Market Segmentation by Product Type
Executive Summary - Chart on Incremental Growth
Executive Summary - Data Table on Incremental Growth
Executive Summary - Chart on Company Market Positioning

2. Technavio Analysis

2.1 Analysis of price sensitivity, lifecycle, customer purchase basket, adoption rates, and purchase criteria

2.2 Criticality of inputs and Factors of differentiation

Chart on Overview on criticality of inputs and factors of differentiation

2.3 Factors of disruption

Chart on Overview on factors of disruption

2.4 Impact of drivers and challenges

Chart on Impact of drivers and challenges in 2025 and 2030

3. Market Landscape

3.1 Market ecosystem

Chart on Parent Market
Data Table on - Parent Market

3.2 Market characteristics

Chart on Market characteristics analysis

3.3 Value chain analysis

Chart on Value chain analysis

4. Market Sizing

4.1 Market definition

Data Table on Offerings of companies included in the market definition

4.2 Market segment analysis

Market segments

4.3 Market size 2025

4.4 Market outlook: Forecast for 2025-2030

Chart on Global - Market size and forecast 2025-2030 ($ thousand)
Data Table on Global - Market size and forecast 2025-2030 ($ thousand)
Chart on Global Market: Year-over-year growth 2025-2030 (%)
Data Table on Global Market: Year-over-year growth 2025-2030 (%)

5. Historic Market Size

5.1 Global Blue Laser Diode Market 2020 - 2024

Historic Market Size - Data Table on Global Blue Laser Diode Market 2020 - 2024 ($ thousand)

5.2 Type segment analysis 2020 - 2024

Historic Market Size - Type Segment 2020 - 2024 ($ thousand)

5.3 Application segment analysis 2020 - 2024

Historic Market Size - Application Segment 2020 - 2024 ($ thousand)

5.4 Material segment analysis 2020 - 2024

Historic Market Size - Material Segment 2020 - 2024 ($ thousand)

5.5 Product Type segment analysis 2020 - 2024

Historic Market Size - Product Type Segment 2020 - 2024 ($ thousand)

5.6 Geography segment analysis 2020 - 2024

Historic Market Size - Geography Segment 2020 - 2024 ($ thousand)

5.7 Country segment analysis 2020 - 2024

Historic Market Size - Country Segment 2020 - 2024 ($ thousand)

6. Qualitative Analysis

6.1 Impact of AI on global blue laser diode market

6.2 Impact of geopolitical conflicts on global blue laser diode market

7. Five Forces Analysis

7.1 Five forces summary

Five forces analysis - Comparison between 2025 and 2030

7.2 Bargaining power of buyers

Bargaining power of buyers - Impact of key factors 2025 and 2030

7.3 Bargaining power of suppliers

Bargaining power of suppliers - Impact of key factors in 2025 and 2030

7.4 Threat of new entrants

Threat of new entrants - Impact of key factors in 2025 and 2030

7.5 Threat of substitutes

Threat of substitutes - Impact of key factors in 2025 and 2030

7.6 Threat of rivalry

Threat of rivalry - Impact of key factors in 2025 and 2030

7.7 Market condition

Chart on Market condition - Five forces 2025 and 2030

8. Market Segmentation by Type

8.1 Market segments

Chart on Type - Market share 2025-2030 (%)
Data Table on Type - Market share 2025-2030 (%)

8.2 Comparison by Type

Chart on Comparison by Type
Data Table on Comparison by Type

8.3 Single-mode - Market size and forecast 2025-2030

Chart on Single-mode - Market size and forecast 2025-2030 ($ thousand)
Data Table on Single-mode - Market size and forecast 2025-2030 ($ thousand)
Chart on Single-mode - Year-over-year growth 2025-2030 (%)
Data Table on Single-mode - Year-over-year growth 2025-2030 (%)

8.4 Multi-mode - Market size and forecast 2025-2030

Chart on Multi-mode - Market size and forecast 2025-2030 ($ thousand)
Data Table on Multi-mode - Market size and forecast 2025-2030 ($ thousand)
Chart on Multi-mode - Year-over-year growth 2025-2030 (%)
Data Table on Multi-mode - Year-over-year growth 2025-2030 (%)

8.5 Market opportunity by Type

Market opportunity by Type ($ thousand)
Data Table on Market opportunity by Type ($ thousand)

9. Market Segmentation by Application

9.1 Market segments

Chart on Application - Market share 2025-2030 (%)
Data Table on Application - Market share 2025-2030 (%)

9.2 Comparison by Application

Chart on Comparison by Application
Data Table on Comparison by Application

9.3 Bio/medical - Market size and forecast 2025-2030

Chart on Bio/medical - Market size and forecast 2025-2030 ($ thousand)
Data Table on Bio/medical - Market size and forecast 2025-2030 ($ thousand)
Chart on Bio/medical - Year-over-year growth 2025-2030 (%)
Data Table on Bio/medical - Year-over-year growth 2025-2030 (%)

9.4 Laser projectors and scanner - Market size and forecast 2025-2030

Chart on Laser projectors and scanner - Market size and forecast 2025-2030 ($ thousand)
Data Table on Laser projectors and scanner - Market size and forecast 2025-2030 ($ thousand)
Chart on Laser projectors and scanner - Year-over-year growth 2025-2030 (%)
Data Table on Laser projectors and scanner - Year-over-year growth 2025-2030 (%)

9.5 Blu-ray devices - Market size and forecast 2025-2030

Chart on Blu-ray devices - Market size and forecast 2025-2030 ($ thousand)
Data Table on Blu-ray devices - Market size and forecast 2025-2030 ($ thousand)
Chart on Blu-ray devices - Year-over-year growth 2025-2030 (%)
Data Table on Blu-ray devices - Year-over-year growth 2025-2030 (%)

9.6 Others - Market size and forecast 2025-2030

Chart on Others - Market size and forecast 2025-2030 ($ thousand)
Data Table on Others - Market size and forecast 2025-2030 ($ thousand)
Chart on Others - Year-over-year growth 2025-2030 (%)
Data Table on Others - Year-over-year growth 2025-2030 (%)

9.7 Market opportunity by Application

Market opportunity by Application ($ thousand)
Data Table on Market opportunity by Application ($ thousand)

10. Market Segmentation by Material

10.1 Market segments

Chart on Material - Market share 2025-2030 (%)
Data Table on Material - Market share 2025-2030 (%)

10.2 Comparison by Material

Chart on Comparison by Material
Data Table on Comparison by Material

10.3 Gallium nitride (GaN) - Market size and forecast 2025-2030

Chart on Gallium nitride (GaN) - Market size and forecast 2025-2030 ($ thousand)
Data Table on Gallium nitride (GaN) - Market size and forecast 2025-2030 ($ thousand)
Chart on Gallium nitride (GaN) - Year-over-year growth 2025-2030 (%)
Data Table on Gallium nitride (GaN) - Year-over-year growth 2025-2030 (%)

10.4 Indium gallium nitride (InGaN) - Market size and forecast 2025-2030

Chart on Indium gallium nitride (InGaN) - Market size and forecast 2025-2030 ($ thousand)
Data Table on Indium gallium nitride (InGaN) - Market size and forecast 2025-2030 ($ thousand)
Chart on Indium gallium nitride (InGaN) - Year-over-year growth 2025-2030 (%)
Data Table on Indium gallium nitride (InGaN) - Year-over-year growth 2025-2030 (%)

10.5 Market opportunity by Material

Market opportunity by Material ($ thousand)
Data Table on Market opportunity by Material ($ thousand)

11. Market Segmentation by Product Type

11.1 Market segments

Chart on Product Type - Market share 2025-2030 (%)
Data Table on Product Type - Market share 2025-2030 (%)

11.2 Comparison by Product Type

Chart on Comparison by Product Type
Data Table on Comparison by Product Type

11.3 Continuous wave (CW) - Market size and forecast 2025-2030

Chart on Continuous wave (CW) - Market size and forecast 2025-2030 ($ thousand)
Data Table on Continuous wave (CW) - Market size and forecast 2025-2030 ($ thousand)
Chart on Continuous wave (CW) - Year-over-year growth 2025-2030 (%)
Data Table on Continuous wave (CW) - Year-over-year growth 2025-2030 (%)

11.4 Pulsed - Market size and forecast 2025-2030

Chart on Pulsed - Market size and forecast 2025-2030 ($ thousand)
Data Table on Pulsed - Market size and forecast 2025-2030 ($ thousand)
Chart on Pulsed - Year-over-year growth 2025-2030 (%)
Data Table on Pulsed - Year-over-year growth 2025-2030 (%)

11.5 Market opportunity by Product Type

Market opportunity by Product Type ($ thousand)
Data Table on Market opportunity by Product Type ($ thousand)

12. Customer Landscape

12.1 Customer landscape overview

Analysis of price sensitivity, lifecycle, customer purchase basket, adoption rates, and purchase criteria

13. Geographic Landscape

13.1 Geographic segmentation

Chart on Market share by geography 2025-2030 (%)
Data Table on Market share by geography 2025-2030 (%)

13.2 Geographic comparison

Chart on Geographic comparison
Data Table on Geographic comparison

13.3 APAC - Market size and forecast 2025-2030

Chart on APAC - Market size and forecast 2025-2030 ($ thousand)
Data Table on APAC - Market size and forecast 2025-2030 ($ thousand)
Chart on APAC - Year-over-year growth 2025-2030 (%)
Data Table on APAC - Year-over-year growth 2025-2030 (%)
Chart on Regional Comparison - APAC
Data Table on Regional Comparison - APAC

13.3.1 China - Market size and forecast 2025-2030

Chart on China - Market size and forecast 2025-2030 ($ thousand)
Data Table on China - Market size and forecast 2025-2030 ($ thousand)
Chart on China - Year-over-year growth 2025-2030 (%)
Data Table on China - Year-over-year growth 2025-2030 (%)

13.3.2 Japan - Market size and forecast 2025-2030

Chart on Japan - Market size and forecast 2025-2030 ($ thousand)
Data Table on Japan - Market size and forecast 2025-2030 ($ thousand)
Chart on Japan - Year-over-year growth 2025-2030 (%)
Data Table on Japan - Year-over-year growth 2025-2030 (%)

13.3.3 South Korea - Market size and forecast 2025-2030

Chart on South Korea - Market size and forecast 2025-2030 ($ thousand)
Data Table on South Korea - Market size and forecast 2025-2030 ($ thousand)
Chart on South Korea - Year-over-year growth 2025-2030 (%)
Data Table on South Korea - Year-over-year growth 2025-2030 (%)

13.3.4 India - Market size and forecast 2025-2030

Chart on India - Market size and forecast 2025-2030 ($ thousand)
Data Table on India - Market size and forecast 2025-2030 ($ thousand)
Chart on India - Year-over-year growth 2025-2030 (%)
Data Table on India - Year-over-year growth 2025-2030 (%)

13.3.5 Australia - Market size and forecast 2025-2030

Chart on Australia - Market size and forecast 2025-2030 ($ thousand)
Data Table on Australia - Market size and forecast 2025-2030 ($ thousand)
Chart on Australia - Year-over-year growth 2025-2030 (%)
Data Table on Australia - Year-over-year growth 2025-2030 (%)

13.3.6 Indonesia - Market size and forecast 2025-2030

Chart on Indonesia - Market size and forecast 2025-2030 ($ thousand)
Data Table on Indonesia - Market size and forecast 2025-2030 ($ thousand)
Chart on Indonesia - Year-over-year growth 2025-2030 (%)
Data Table on Indonesia - Year-over-year growth 2025-2030 (%)

13.4 North America - Market size and forecast 2025-2030

Chart on North America - Market size and forecast 2025-2030 ($ thousand)
Data Table on North America - Market size and forecast 2025-2030 ($ thousand)
Chart on North America - Year-over-year growth 2025-2030 (%)
Data Table on North America - Year-over-year growth 2025-2030 (%)
Chart on Regional Comparison - North America
Data Table on Regional Comparison - North America

13.4.1 US - Market size and forecast 2025-2030

Chart on US - Market size and forecast 2025-2030 ($ thousand)
Data Table on US - Market size and forecast 2025-2030 ($ thousand)
Chart on US - Year-over-year growth 2025-2030 (%)
Data Table on US - Year-over-year growth 2025-2030 (%)

13.4.2 Canada - Market size and forecast 2025-2030

Chart on Canada - Market size and forecast 2025-2030 ($ thousand)
Data Table on Canada - Market size and forecast 2025-2030 ($ thousand)
Chart on Canada - Year-over-year growth 2025-2030 (%)
Data Table on Canada - Year-over-year growth 2025-2030 (%)

13.4.3 Mexico - Market size and forecast 2025-2030

Chart on Mexico - Market size and forecast 2025-2030 ($ thousand)
Data Table on Mexico - Market size and forecast 2025-2030 ($ thousand)
Chart on Mexico - Year-over-year growth 2025-2030 (%)
Data Table on Mexico - Year-over-year growth 2025-2030 (%)

13.5 Europe - Market size and forecast 2025-2030

Chart on Europe - Market size and forecast 2025-2030 ($ thousand)
Data Table on Europe - Market size and forecast 2025-2030 ($ thousand)
Chart on Europe - Year-over-year growth 2025-2030 (%)
Data Table on Europe - Year-over-year growth 2025-2030 (%)
Chart on Regional Comparison - Europe
Data Table on Regional Comparison - Europe

13.5.1 Germany - Market size and forecast 2025-2030

Chart on Germany - Market size and forecast 2025-2030 ($ thousand)
Data Table on Germany - Market size and forecast 2025-2030 ($ thousand)
Chart on Germany - Year-over-year growth 2025-2030 (%)
Data Table on Germany - Year-over-year growth 2025-2030 (%)

13.5.2 UK - Market size and forecast 2025-2030

Chart on UK - Market size and forecast 2025-2030 ($ thousand)
Data Table on UK - Market size and forecast 2025-2030 ($ thousand)
Chart on UK - Year-over-year growth 2025-2030 (%)
Data Table on UK - Year-over-year growth 2025-2030 (%)

13.5.3 France - Market size and forecast 2025-2030

Chart on France - Market size and forecast 2025-2030 ($ thousand)
Data Table on France - Market size and forecast 2025-2030 ($ thousand)
Chart on France - Year-over-year growth 2025-2030 (%)
Data Table on France - Year-over-year growth 2025-2030 (%)

13.5.4 Italy - Market size and forecast 2025-2030

Chart on Italy - Market size and forecast 2025-2030 ($ thousand)
Data Table on Italy - Market size and forecast 2025-2030 ($ thousand)
Chart on Italy - Year-over-year growth 2025-2030 (%)
Data Table on Italy - Year-over-year growth 2025-2030 (%)

13.5.5 Spain - Market size and forecast 2025-2030

Chart on Spain - Market size and forecast 2025-2030 ($ thousand)
Data Table on Spain - Market size and forecast 2025-2030 ($ thousand)
Chart on Spain - Year-over-year growth 2025-2030 (%)
Data Table on Spain - Year-over-year growth 2025-2030 (%)

13.5.6 The Netherlands - Market size and forecast 2025-2030

Chart on The Netherlands - Market size and forecast 2025-2030 ($ thousand)
Data Table on The Netherlands - Market size and forecast 2025-2030 ($ thousand)
Chart on The Netherlands - Year-over-year growth 2025-2030 (%)
Data Table on The Netherlands - Year-over-year growth 2025-2030 (%)

13.6 South America - Market size and forecast 2025-2030

Chart on South America - Market size and forecast 2025-2030 ($ thousand)
Data Table on South America - Market size and forecast 2025-2030 ($ thousand)
Chart on South America - Year-over-year growth 2025-2030 (%)
Data Table on South America - Year-over-year growth 2025-2030 (%)
Chart on Regional Comparison - South America
Data Table on Regional Comparison - South America

13.6.1 Brazil - Market size and forecast 2025-2030

Chart on Brazil - Market size and forecast 2025-2030 ($ thousand)
Data Table on Brazil - Market size and forecast 2025-2030 ($ thousand)
Chart on Brazil - Year-over-year growth 2025-2030 (%)
Data Table on Brazil - Year-over-year growth 2025-2030 (%)

13.6.2 Argentina - Market size and forecast 2025-2030

Chart on Argentina - Market size and forecast 2025-2030 ($ thousand)
Data Table on Argentina - Market size and forecast 2025-2030 ($ thousand)
Chart on Argentina - Year-over-year growth 2025-2030 (%)
Data Table on Argentina - Year-over-year growth 2025-2030 (%)

13.6.3 Chile - Market size and forecast 2025-2030

Chart on Chile - Market size and forecast 2025-2030 ($ thousand)
Data Table on Chile - Market size and forecast 2025-2030 ($ thousand)
Chart on Chile - Year-over-year growth 2025-2030 (%)
Data Table on Chile - Year-over-year growth 2025-2030 (%)

13.7 Middle East and Africa - Market size and forecast 2025-2030

Chart on Middle East and Africa - Market size and forecast 2025-2030 ($ thousand)
Data Table on Middle East and Africa - Market size and forecast 2025-2030 ($ thousand)
Chart on Middle East and Africa - Year-over-year growth 2025-2030 (%)
Data Table on Middle East and Africa - Year-over-year growth 2025-2030 (%)
Chart on Regional Comparison - Middle East and Africa
Data Table on Regional Comparison - Middle East and Africa

13.7.1 Saudi Arabia - Market size and forecast 2025-2030

Chart on Saudi Arabia - Market size and forecast 2025-2030 ($ thousand)
Data Table on Saudi Arabia - Market size and forecast 2025-2030 ($ thousand)
Chart on Saudi Arabia - Year-over-year growth 2025-2030 (%)
Data Table on Saudi Arabia - Year-over-year growth 2025-2030 (%)

13.7.2 UAE - Market size and forecast 2025-2030

Chart on UAE - Market size and forecast 2025-2030 ($ thousand)
Data Table on UAE - Market size and forecast 2025-2030 ($ thousand)
Chart on UAE - Year-over-year growth 2025-2030 (%)
Data Table on UAE - Year-over-year growth 2025-2030 (%)

13.7.3 South Africa - Market size and forecast 2025-2030

Chart on South Africa - Market size and forecast 2025-2030 ($ thousand)
Data Table on South Africa - Market size and forecast 2025-2030 ($ thousand)
Chart on South Africa - Year-over-year growth 2025-2030 (%)
Data Table on South Africa - Year-over-year growth 2025-2030 (%)

13.7.4 Israel - Market size and forecast 2025-2030

Chart on Israel - Market size and forecast 2025-2030 ($ thousand)
Data Table on Israel - Market size and forecast 2025-2030 ($ thousand)
Chart on Israel - Year-over-year growth 2025-2030 (%)
Data Table on Israel - Year-over-year growth 2025-2030 (%)

13.7.5 Turkey - Market size and forecast 2025-2030

Chart on Turkey - Market size and forecast 2025-2030 ($ thousand)
Data Table on Turkey - Market size and forecast 2025-2030 ($ thousand)
Chart on Turkey - Year-over-year growth 2025-2030 (%)
Data Table on Turkey - Year-over-year growth 2025-2030 (%)

13.8 Market opportunity by geography

Market opportunity by geography ($ thousand)
Data Tables on Market opportunity by geography ($ thousand)

14. Drivers, Challenges, and Opportunity

14.1 Market drivers

Increasing demand for electric vehicle battery manufacturing
Advancements in laser projection and display technologies
Growth of precision medical imaging and diagnostics

14.2 Market challenges

Lack of standardized testing and qualification protocols
Intellectual property landscape and patent litigation risks
Integration challenges with existing industrial infrastructure

14.3 Impact of drivers and challenges

Impact of drivers and challenges in 2025 and 2030

14.4 Market opportunities

Proliferation of edge emitting diode platforms for hyperscale infrastructure
Advancement of ultrafast laser ablation techniques for transparent materials
Deployment of diode pumped directed energy modules in defense modernization

15. Competitive Landscape

15.1 Overview

15.2

Overview on criticality of inputs and factors of differentiation

15.3 Landscape disruption

Overview on factors of disruption

15.4 Industry risks

Impact of key risks on business

16. Competitive Analysis

16.1 Companies profiled

Companies covered

16.2 Company ranking index

16.3 Market positioning of companies

Matrix on companies position and classification

16.4 ams OSRAM AG

ams OSRAM AG - Overview
ams OSRAM AG - Business segments
ams OSRAM AG - Key offerings
ams OSRAM AG - Segment focus
SWOT

16.5 Coherent Corp.

Coherent Corp. - Overview
Coherent Corp. - Business segments
Coherent Corp. - Key offerings
Coherent Corp. - Segment focus
SWOT

16.6 Hamamatsu Photonics KK

Hamamatsu Photonics KK - Overview
Hamamatsu Photonics KK - Business segments
Hamamatsu Photonics KK - Key offerings
Hamamatsu Photonics KK - Segment focus
SWOT

16.7 KYOCERA SLD Laser Inc.

KYOCERA SLD Laser Inc. - Overview
KYOCERA SLD Laser Inc. - Product / Service
KYOCERA SLD Laser Inc. - Key offerings
SWOT

16.8 Laser Components GmbH

Laser Components GmbH - Overview
Laser Components GmbH - Product / Service
Laser Components GmbH - Key offerings
SWOT

16.9 Modulight Inc.

Modulight Inc. - Overview
Modulight Inc. - Product / Service
Modulight Inc. - Key offerings
SWOT

16.10 Nichia Corp.

Nichia Corp. - Overview
Nichia Corp. - Product / Service
Nichia Corp. - Key offerings
SWOT

16.11 Panasonic Holdings Corp.

Panasonic Holdings Corp. - Overview
Panasonic Holdings Corp. - Business segments
Panasonic Holdings Corp. - Key news
Panasonic Holdings Corp. - Key offerings
Panasonic Holdings Corp. - Segment focus
SWOT

16.12 Power Technology Inc.

Power Technology Inc. - Overview
Power Technology Inc. - Product / Service
Power Technology Inc. - Key offerings
SWOT

16.13 ProPhotonix Ltd.

ProPhotonix Ltd. - Overview
ProPhotonix Ltd. - Product / Service
ProPhotonix Ltd. - Key offerings
SWOT

16.14 Sacher Lasertechnik GmbH

Sacher Lasertechnik GmbH - Overview
Sacher Lasertechnik GmbH - Product / Service
Sacher Lasertechnik GmbH - Key offerings
SWOT

16.15 Sharp Corp.

Sharp Corp. - Overview
Sharp Corp. - Business segments
Sharp Corp. - Key offerings
Sharp Corp. - Segment focus
SWOT

16.16 Sony Semiconductor Solutions

Sony Semiconductor Solutions - Overview
Sony Semiconductor Solutions - Product / Service
Sony Semiconductor Solutions - Key offerings
SWOT

16.17 Thorlabs Inc.

Thorlabs Inc. - Overview
Thorlabs Inc. - Product / Service
Thorlabs Inc. - Key offerings
SWOT

16.18 Ushio America Inc.

Ushio America Inc. - Overview
Ushio America Inc. - Product / Service
Ushio America Inc. - Key offerings
SWOT

17. Appendix

17.1 Scope of the report

Market definition
Objectives
Notes and caveats

17.2 Inclusions and exclusions checklist

Inclusions checklist
Exclusions checklist

17.3 Currency conversion rates for US$

17.4 Research methodology

17.5 Data procurement

Information sources

17.6 Data validation

17.7 Validation techniques employed for market sizing

17.8 Data synthesis

17.9 360 degree market analysis

17.10 List of abbreviations

Research Methodology

Technavio presents a detailed picture of the market by way of study, synthesis, and summation of data from multiple sources. The analysts have presented the various facets of the market with a particular focus on identifying the key industry influencers. The data thus presented is comprehensive, reliable, and the result of extensive research, both primary and secondary.

INFORMATION SOURCES

Primary sources

  • Manufacturers and suppliers
  • Channel partners
  • Industry experts
  • Strategic decision makers

Secondary sources

  • Industry journals and periodicals
  • Government data
  • Financial reports of key industry players
  • Historical data
  • Press releases

DATA ANALYSIS

Data Synthesis

  • Collation of data
  • Estimation of key figures
  • Analysis of derived insights

Data Validation

  • Triangulation with data models
  • Reference against proprietary databases
  • Corroboration with industry experts

REPORT WRITING

Qualitative

  • Market drivers
  • Market challenges
  • Market trends
  • Five forces analysis

Quantitative

  • Market size and forecast
  • Market segmentation
  • Geographical insights
  • Competitive landscape

Interested in this report?

Get your sample now to see our research methodology and insights!

Download Now

Frequently Asked Questions

Blue Laser Diode market growth will increase by USD 466599.6 thousand thousand during 2026-2030.

The Blue Laser Diode market is expected to grow at a CAGR of 16.2% during 2026-2030.

Blue Laser Diode market is segmented by Type (Single-mode, Multi-mode) Application (Bio/medical, Laser projectors and scanner, Blu-ray devices, Others) Material (Gallium nitride (GaN), Indium gallium nitride (InGaN)) Product type (Continuous wave (CW), Pulsed)

ams OSRAM AG, Coherent Corp., Frankfurt Laser Co., Hamamatsu Photonics KK, KYOCERA SLD Laser Inc., Laser Components GmbH, Modulight Inc., Nichia Corp., Panasonic Holdings Corp., Power Technology Inc., ProPhotonix Ltd., RPMC Lasers Inc., Sacher Lasertechnik GmbH, Sharp Corp., Sheaumann Laser Inc., Sony Semiconductor Solutions, Thorlabs Inc., TOPTICA Photonics AG, Ushio America Inc., Wavespectrum Laser Group Ltd are a few of the key vendors in the Blue Laser Diode market.

APAC will register the highest growth rate of 42.8% among the other regions. Therefore, the Blue Laser Diode market in APAC is expected to garner significant business opportunities for the vendors during the forecast period.

China, Japan, South Korea, India, Australia, Indonesia, US, Canada, Mexico, Germany, UK, France, Italy, Spain, The Netherlands, Brazil, Argentina, Chile, Saudi Arabia, UAE, South Africa, Israel, Turkey

  • Increasing demand for electric vehicle battery manufacturing is the driving factor this market.

The Blue Laser Diode market vendors should focus on grabbing business opportunities from the Type segment as it accounted for the largest market share in the base year.
RIA - Research AI Assistant
Ask RIA
