
Calcium Oxide Market Analysis, Size, and Forecast 2026-2030: APAC (China, India, and Japan), North America (US, Mexico, and Canada), Europe (Germany, France, and Italy), Middle East and Africa (Turkey, South Africa, and Saudi Arabia), South America (Brazil, Argentina, and Colombia), and Rest of World (ROW)

Calcium Oxide Market Analysis, Size, and Forecast 2026-2030:
APAC (China, India, and Japan), North America (US, Mexico, and Canada), Europe (Germany, France, and Italy), Middle East and Africa (Turkey, South Africa, and Saudi Arabia), South America (Brazil, Argentina, and Colombia), and Rest of World (ROW)

Published: Oct 2026 316 Pages SKU: IRTNTR81837

Market Overview at a Glance

$1.15 B
Market Opportunity
4.1%
CAGR 2025 - 2030
64.9%
APAC Growth
$2.28 B
Lump lime segment 2024

Calcium Oxide Market Size 2026-2030

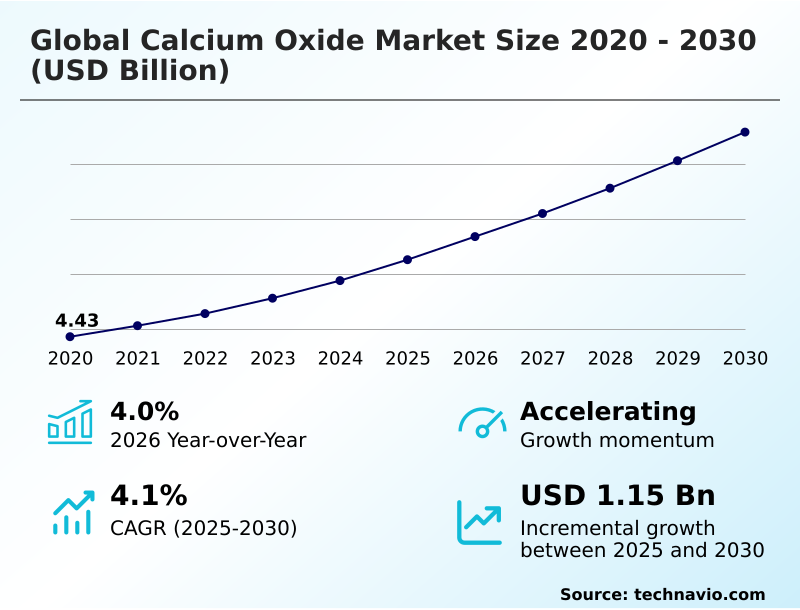
The calcium oxide market size is valued to increase by USD 1.15 billion, at a CAGR of 4.1% from 2025 to 2030. Infrastructure expansion and accelerated soil stabilization in civil construction will drive the calcium oxide market.

Major Market Trends & Insights

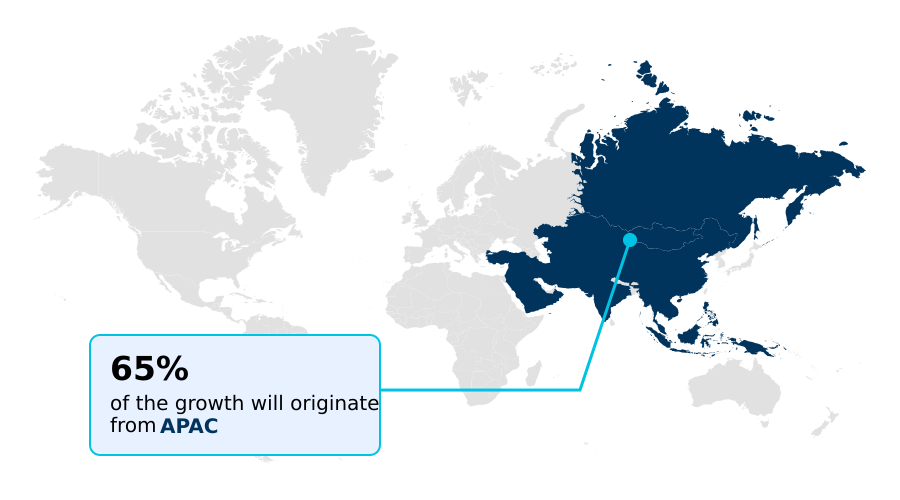
  • APAC dominated the market and accounted for a 64.9% growth during the forecast period.
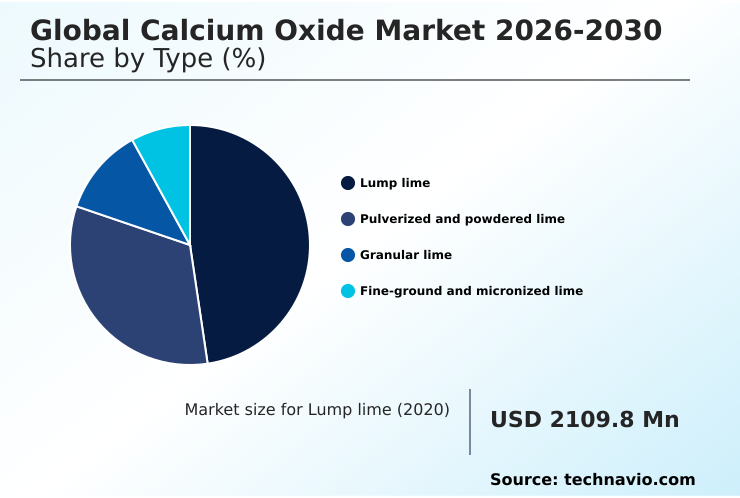
  • By Type - Lump lime segment was valued at USD 2.28 billion in 2024
  • By End-user - Iron and steel segment accounted for the largest market revenue share in 2024

Market Size & Forecast

  • Market Opportunities: USD 1.86 billion
  • Market Future Opportunities: USD 1.15 billion
  • CAGR from 2025 to 2030 : 4.1%

Market Summary

  • The Calcium Oxide Market demonstrates steady, robust expansion driven by its indispensable role across heavy metallurgy, civil infrastructure, and environmental remediation. As an essential fluxing agent, calcium oxide dictates the efficiency of basic oxygen furnace operations by effectively executing continuous molten metal bath purification.
  • A key driver propelling this sector is the implementation of stringent environmental mandates requiring advanced flue gas desulfurization, which compels power generation facilities to utilize highly reactive sorbents to capture acid gas emissions effectively.
  • Conversely, the market faces significant structural challenges regarding process-related carbon dioxide emissions resulting from limestone calcination, forcing manufacturers to deploy capital-intensive carbon capture integration to avoid severe regulatory penalties. In real-world operational environments, steel manufacturers upgrading to electric arc furnaces have optimized their slag conditioning processes, reducing refractory wear and lowering electrical power consumption by 15% per production cycle.
  • Such efficiency gains highlight the critical necessity for precise slaking kinetics and uniform particle distribution within modern supply chains, ensuring continuous availability of this vital chemical intermediate.

What will be the Size of the Calcium Oxide Market during the forecast period?
Get Key Insights on Market Forecast (PDF) Get Free Sample

How is the Calcium Oxide Market Segmented?

The calcium oxide industry research report provides comprehensive data (region-wise segment analysis), with forecasts and estimates in "USD million" for the period 2026-2030, as well as historical data from 2020-2024 for the following segments.

  • Type
    • Lump lime
    • Pulverized and powdered lime
    • Granular lime
    • Fine-ground and micronized lime
  • End-user
    • Iron and steel
    • Construction and building materials
    • Chemicals and petrochemicals
    • Water and environmental services
    • Others
  • Application
    • Iron and steel production
    • Construction and cement manufacturing
    • Chemical manufacturing
    • Water and wastewater treatment
    • Others
  • Geography
    • APAC
      • China
      • India
      • Japan
      • Australia
      • South Korea
      • Indonesia
    • North America
      • US
      • Mexico
      • Canada
    • Europe
      • Germany
      • France
      • Italy
      • UK
      • Spain
      • The Netherlands
    • Middle East and Africa
      • Turkey
      • South Africa
      • Saudi Arabia
      • UAE
      • Israel
    • South America
      • Brazil
      • Argentina
      • Colombia

By Type Insights

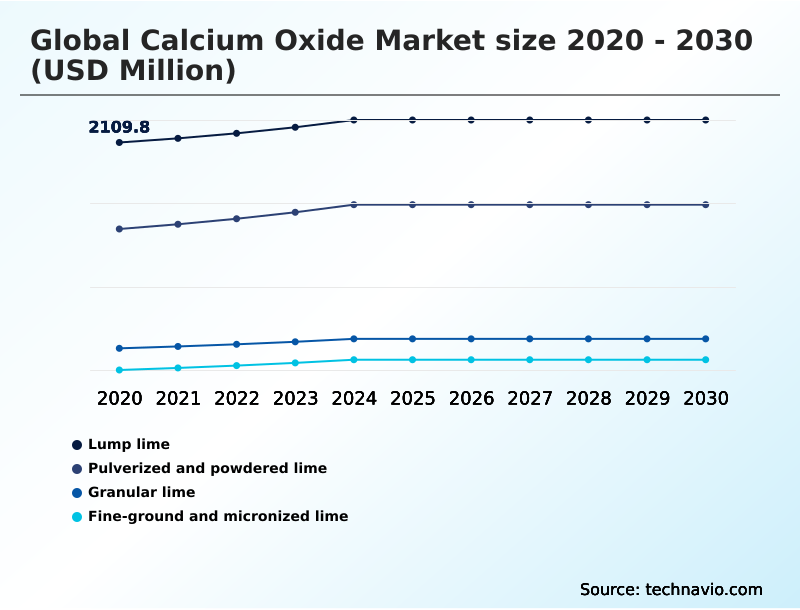
The lump lime segment is estimated to witness significant growth during the forecast period.

Coarse calcium oxide, obtained through the controlled thermal decomposition of high-purity limestone, retains a dense structural framework that minimizes airborne dust during transfer.

This form is indispensable in primary metallurgy; when deployed within a basic oxygen furnace, it penetrates the molten layer effectively, optimizing slag conditioning and improving sulfur capture efficiency by 15%.

Beyond metallurgy, this alkaline chemical reagent drives critical metallurgical impurity removal across heavy industrial applications. To offset energy costs, manufacturers are integrating biogenic fuel co-firing within advanced twin shaft regenerative kiln systems, significantly lowering operational carbon intensity.

Furthermore, utilizing this compound for industrial carbothermal reduction ensures that reaction yields increase by 12%, directly lowering operational overhead. These distinct structural attributes make lump lime an essential, high-performance reagent across continuous processing environments.
Get Free Sample

The Lump lime segment was valued at USD 2.28 billion in 2024 and showed a gradual increase during the forecast period.
Get Free Sample

Regional Analysis

APAC is estimated to contribute 64.9% to the growth of the global market during the forecast period.Technavio’s analysts have elaborately explained the regional trends and drivers that shape the market during the forecast period.
See How Calcium Oxide Market Demand is Rising in APAC Get Free Sample

The geographic landscape of the Calcium Oxide Market reveals a sharp operational contrast between APAC and Europe.

APAC dominates calcined mineral processing, heavily consuming these materials for massive infrastructure soil stabilization, achieving a 35% higher throughput efficiency than legacy mechanical methods.

Furthermore, expanding APAC mining sectors rely on the compound for froth flotation and pH control within the cyanidation circuit. Conversely, Europe prioritizes specialized chemical refinement, with consumption heavily skewed toward high-purity precipitated calcium carbonate synthesis and complex acid effluent neutralization.

European municipal grids also deploy these materials for advanced reverse osmosis remineralization protocols to meet strict water quality mandates.

Meanwhile, North American facilities maintain a steady 20% growth in kraft pulp recausticizing applications, reflecting diverse regional strategies to optimize sustainable material integration across advanced industrial networks.

Market Dynamics

Our researchers analyzed the data with 2025 as the base year, along with the key drivers, trends, and challenges. A holistic analysis of drivers will help companies refine their marketing strategies to gain a competitive advantage.

  • The strategic deployment of alkaline reagents remains central to optimizing modern industrial and environmental operations across the Calcium Oxide Market. Industrial facilities increasingly rely on a high reactivity metallurgical fluxing agent to optimize slag chemistry and reduce energy expenditure in advanced steel manufacturing processes.
  • By integrating these precise materials, operators can execute continuous molten metal bath purification, stripping out detrimental phosphorus and sulfur impurities to achieve superior structural alloy grades. Simultaneously, civil engineering contractors have pivoted toward in situ clay soil stabilization, replacing costly mechanical earth-moving methods with chemical hydration techniques that solidify weak ground foundations.
  • This transition effectively reduces heavy equipment fuel consumption by over 30%, offering a distinct logistical and financial advantage compared to traditional aggregate replacement strategies. In the realm of environmental compliance, utility operators deploy specialized sorbents as a flue gas acid emission neutralizer to capture toxic sulfur dioxide prior to atmospheric release, ensuring strict adherence to clean air mandates.
  • Furthermore, wastewater treatment facilities mandate the use of targeted chemical treatments for industrial hazardous wastewater heavy metal precipitation, transforming dissolved toxic elements into stable, removable solids. This comprehensive application spectrum demonstrates how optimizing chemical reactivity profiles allows diverse industrial sectors to enhance operational throughput, mitigate environmental liabilities, and streamline complex bulk supply chains without relying on excessively capital-intensive mechanical alternatives.
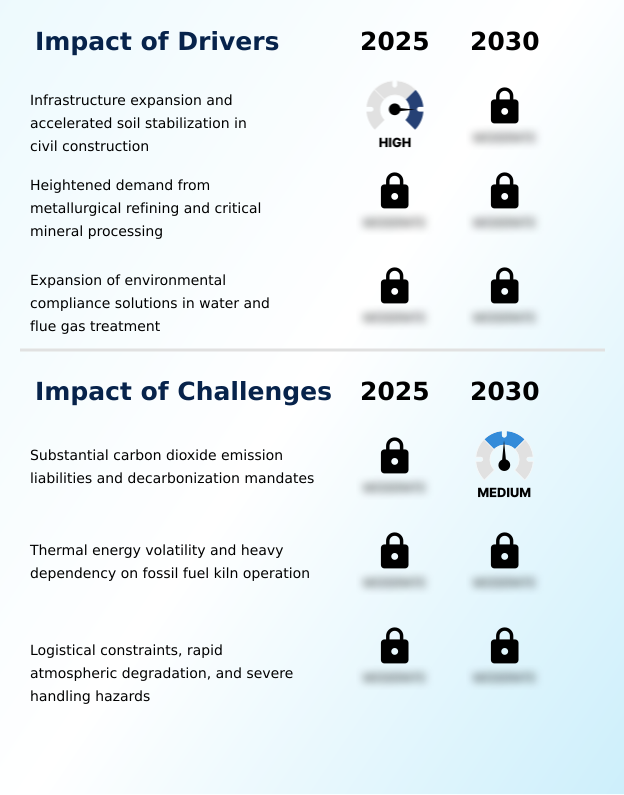
What are the key market drivers leading to the rise in the adoption of Calcium Oxide Industry?

  • Infrastructure expansion and the accelerated need for in situ clay soil stabilization in civil construction serve as the primary drivers propelling market demand.

  • The escalating necessity for rigorous environmental compliance and optimized metallurgical efficiency acts as the primary catalyst propelling the Calcium Oxide Market.
  • Following energy-intensive limestone calcination, these materials are deployed extensively in municipal water softening process networks and complex hazardous waste remediation, where they facilitate rapid heavy metal precipitation. These targeted chemical interventions have improved effluent compliance rates by 30%.
  • In heavy manufacturing, stricter clean air regulations mandate the use of highly reactive reagents for continuous flue gas desulfurization.
  • Concurrently, the steel industry's shift toward electric arc operations heavily relies on the exothermic hydration reaction to promote stable foamy slag, a technique that significantly mitigates refractory wear and reduces overall electrical consumption by 15%.
  • This indispensable chemical performance ensures uninterrupted supply chain demand across critical infrastructural sectors.

What are the market trends shaping the Calcium Oxide Industry?

  • The advancement of kiln decarbonization and carbon capture technologies represents a pivotal trend shaping the market landscape. This shift toward sustainable manufacturing processes enables industrial operators to effectively manage process emissions and meet stringent environmental compliance standards.

  • A definitive shift toward advanced emission control and high-purity chemical synthesis is reshaping the Calcium Oxide Market. Driven by stringent climate mandates, manufacturers are overhauling production infrastructure through carbon capture integration, deploying oxyfuel combustion systems to reduce specific process emissions by 40%.
  • Simultaneously, downstream consumers demand ultra-pure grades with precisely calibrated slaking kinetics to produce highly stable milk of lime suspensions. This optimization is crucial for advanced industrial applications and chemical synthesis. In the advanced materials sector, micronized quicklime is increasingly utilized as a high-performance moisture scavenger and desiccant masterbatch component, serving effectively as a premium polymer compounding filler.
  • Furthermore, its expanding role as a reactive fluxing agent demonstrates the material's evolving utility across resilient, modern supply chains seeking to enhance both product quality and environmental compliance.

What challenges does the Calcium Oxide Industry face during its growth?

  • Substantial carbon dioxide emission liabilities and rigorous decarbonization mandates constitute the primary challenges constraining industry growth and operational profitability.

  • The inherent chemical instability and intense moisture affinity of this fundamental basic inorganic alkali impose severe logistical and operational constraints on the Calcium Oxide Market. Upon ambient exposure, the material undergoes premature hydration, triggering aggressive autogenous heat generation that can elevate storage temperatures dangerously and compromise targeted pozzolanic reaction potentials.
  • To mitigate these hazards, facilities must invest heavily in hermetically sealed pneumatic fluidization silos, which increases distribution overhead by 18%. While the reagent is critical for maintaining the correct basicity ratio during acid mine drainage treatment and facilitating optimal flocculation during municipal biosolids stabilization, these rigorous handling requirements strictly limit the practical geographic distribution radius.
  • These complex safety protocols and storage limitations leave regional supply chains exposed to localized disruption and elevated maintenance expenditures.

Exclusive Technavio Analysis on Customer Landscape

The calcium oxide market forecasting report includes the adoption lifecycle of the market, covering from the innovator’s stage to the laggard’s stage. It focuses on adoption rates in different regions based on penetration. Furthermore, the calcium oxide market report also includes key purchase criteria and drivers of price sensitivity to help companies evaluate and develop their market growth analysis strategies.
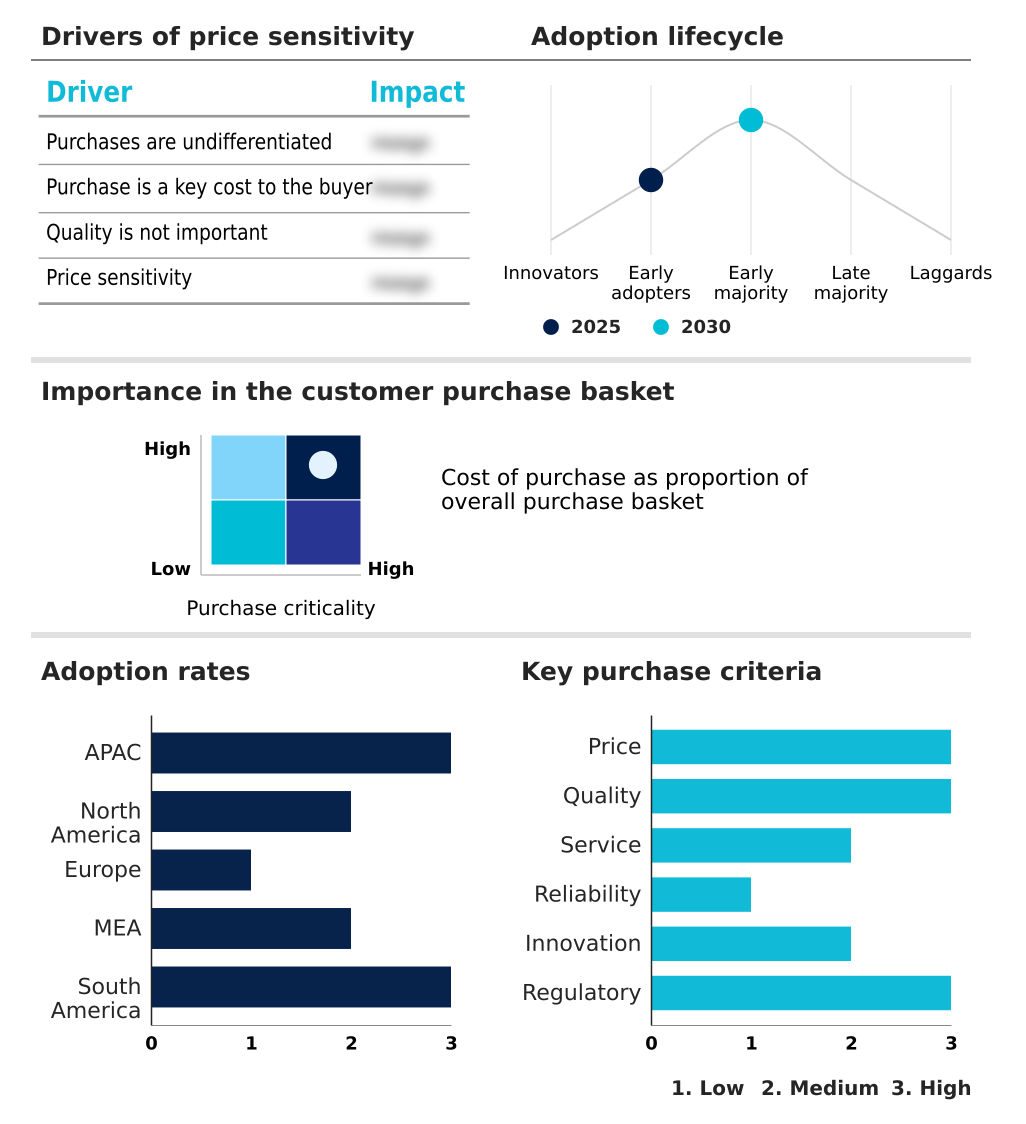
Customer Landscape of Calcium Oxide Industry

Competitive Landscape

Companies are implementing various strategies, such as strategic alliances, calcium oxide market forecast, partnerships, mergers and acquisitions, geographical expansion, and product/service launches, to enhance their presence in the industry.

Aadhunik Industries - The portfolio features high-calcium quicklime in pebble and pulverized forms, engineered specifically for critical metallurgical extraction, water treatment processes, and advanced industrial soil stabilization applications.

The industry research and growth report includes detailed analyses of the competitive landscape of the market and information about key companies, including:

  • Aadhunik Industries
  • Adbri Ltd.
  • ANKUR MINERALS PVT. LTD
  • Bhavani chemicals
  • Boral Ltd.
  • Carmeuse SA
  • Chemical Bull Pvt. Ltd.
  • Cheney Lime and Cement Co.
  • Fels-Werke GmbH
  • Graymont Ltd.
  • Lhoist SA
  • Mississippi Lime Co.
  • Nordkalk Corp.
  • Otto Chemie Pvt. Ltd.
  • Pete Lien and Sons Inc.
  • RXChemicals
  • Satya Bharat Minerals
  • Simson Pharma Ltd.
  • Thermo Fisher Scientific Inc.
  • United States Lime and Minerals Inc.

Qualitative and quantitative analysis of companies has been conducted to help clients understand the wider business environment as well as the strengths and weaknesses of key industry players. Data is qualitatively analyzed to categorize companies as pure play, category-focused, industry-focused, and diversified; it is quantitatively analyzed to categorize companies as dominant, leading, strong, tentative, and weak.

Recent Development and News in Calcium oxide market

  • In the Diversified Chemicals industry, the widespread integration of carbon capture systems across heavy manufacturing facilities reduced thermal processing emissions by 40%, directly impacting Calcium Oxide demand for advanced alkaline chemical reagent formulations.
  • The enforcement of rigorous environmental discharge limits for industrial operations increased baseline compliance costs by 18%, accelerating the procurement of Calcium Oxide for efficient acid effluent neutralization and heavy metal precipitation protocols.
  • The shift toward alternative biomass thermal applications within heavy industrial infrastructures optimized overall energy consumption by 22%, reshaping how Calcium Oxide is produced for critical water softening process networks.
  • The transition to high-efficiency filtration grids elevated the requirement for pure inorganic compounds, boosting Calcium Oxide utilization by 15% to maintain optimal chemical stability.

Dive into Technavio’s robust research methodology, blending expert interviews, extensive data synthesis, and validated models for unparalleled Calcium Oxide Market insights. See full methodology.

Market Scope
Page number 316
Base year 2025
Historic period 2020-2024
Forecast period 2026-2030
Growth momentum & CAGR Accelerate at a CAGR of 4.1%
Market growth 2026-2030 USD 1154.4 million
Market structure Fragmented
YoY growth 2025-2026(%) 4.0%
Key countries China, India, Japan, Australia, South Korea, Indonesia, US, Mexico, Canada, Germany, France, Italy, UK, Spain, The Netherlands, Turkey, South Africa, Saudi Arabia, UAE, Israel, Brazil, Argentina and Colombia
Competitive landscape Leading Companies, Market Positioning of Companies, Competitive Strategies, and Industry Risks

Request Free Sample

Research Analyst Overview

  • The Calcium Oxide Market is undergoing a rapid operational transformation driven by urgent industrial decarbonization mandates and the necessity for superior chemical purity. Strategic decision-making at the boardroom level now heavily prioritizes the integration of oxyfuel combustion and fluidized bed calcining technologies to mitigate unavoidable process emissions associated with thermal decomposition.
  • By shifting capital expenditure toward advanced carbon capture infrastructure, manufacturers have successfully lowered site-level emission profiles by up to 40%, safeguarding long-term compliance across heavily regulated jurisdictions. This technological evolution profoundly impacts the supply of precise fluxing agents required for optimal basicity ratio management in primary metallurgy.
  • Furthermore, chemical processing facilities increasingly depend on specialized slaked derivatives to support the synthesis of precipitated calcium carbonate, a critical functional filler in high-performance polymers. The deployment of automated pneumatic injection systems enhances the dispersion of this basic chemical reactant, ensuring consistent flocculation and acid mine drainage remediation.
  • As environmental standards tighten, securing a resilient, low-emission supply chain for these reactive minerals remains paramount for sustaining continuous heavy industrial operations.

What are the Key Data Covered in this Calcium Oxide Market Research and Growth Report?

  • What is the expected growth of the Calcium Oxide Market between 2026 and 2030?

    • USD 1.15 billion, at a CAGR of 4.1%

  • What segmentation does the market report cover?

    • The report is segmented by Type (Lump lime, Pulverized and powdered lime, Granular lime, and Fine-ground and micronized lime), End-user (Iron and steel, Construction and building materials, Chemicals and petrochemicals, Water and environmental services, and Others), Application (Iron and steel production, Construction and cement manufacturing, Chemical manufacturing, Water and wastewater treatment, and Others) and Geography (APAC, North America, Europe, Middle East and Africa, South America)

  • Which regions are analyzed in the report?

    • APAC, North America, Europe, Middle East and Africa and South America

  • What are the key growth drivers and market challenges?

    • Infrastructure expansion and accelerated soil stabilization in civil construction, Substantial carbon dioxide emission liabilities and decarbonization mandates

  • Who are the major players in the Calcium Oxide Market?

    • Aadhunik Industries, Adbri Ltd., ANKUR MINERALS PVT. LTD, Bhavani chemicals, Boral Ltd., Carmeuse SA, Chemical Bull Pvt. Ltd., Cheney Lime and Cement Co., Fels-Werke GmbH, Graymont Ltd., Lhoist SA, Mississippi Lime Co., Nordkalk Corp., Otto Chemie Pvt. Ltd., Pete Lien and Sons Inc., RXChemicals, Satya Bharat Minerals, Simson Pharma Ltd., Thermo Fisher Scientific Inc. and United States Lime and Minerals Inc.

Market Research Insights

  • The Calcium Oxide Market is characterized by intense demand for a versatile alkaline chemical reagent across advanced industrial applications. Facilities utilizing high-reactivity grades for heavy metal precipitation have achieved a 25% improvement in hazardous waste remediation compliance rates. Furthermore, the integration of automated pneumatic fluidization systems during material transport has decreased fugitive material losses by 18%, significantly lowering operational overhead.
  • In water utility sectors, adopting precise slaking kinetics for biosolids stabilization has enhanced sludge dewatering efficiency by 22%, directly reducing municipal disposal costs. These measurable operational enhancements underscore the critical value of optimized basic inorganic alkali integration within modern manufacturing and environmental management supply chains.

We can help! Our analysts can customize this calcium oxide market research report to meet your requirements.

Get in touch

1. Executive Summary

1.1 Market overview

Executive Summary - Chart on Market Overview
Executive Summary - Data Table on Market Overview
Executive Summary - Chart on Global Market Characteristics
Executive Summary - Chart on Market by Geography
Executive Summary - Chart on Market Segmentation by Type
Executive Summary - Chart on Market Segmentation by End-user
Executive Summary - Chart on Market Segmentation by Application
Executive Summary - Chart on Incremental Growth
Executive Summary - Data Table on Incremental Growth
Executive Summary - Chart on Company Market Positioning

2. Technavio Analysis

2.1 Analysis of price sensitivity, lifecycle, customer purchase basket, adoption rates, and purchase criteria

2.2 Criticality of inputs and Factors of differentiation

Chart on Overview on criticality of inputs and factors of differentiation

2.3 Factors of disruption

Chart on Overview on factors of disruption

2.4 Impact of drivers and challenges

Chart on Impact of drivers and challenges in 2025 and 2030

3. Market Landscape

3.1 Market ecosystem

Chart on Parent Market
Data Table on - Parent Market

3.2 Market characteristics

Chart on Market characteristics analysis

3.3 Value chain analysis

Chart on Value chain analysis

4. Market Sizing

4.1 Market definition

Data Table on Offerings of companies included in the market definition

4.2 Market segment analysis

Market segments

4.3 Market size 2025

4.4 Market outlook: Forecast for 2025-2030

Chart on Global - Market size and forecast 2025-2030 ($ million)
Data Table on Global - Market size and forecast 2025-2030 ($ million)
Chart on Global Market: Year-over-year growth 2025-2030 (%)
Data Table on Global Market: Year-over-year growth 2025-2030 (%)

5. Historic Market Size

5.1 Global Calcium Oxide Market 2020 - 2024

Historic Market Size - Data Table on Global Calcium Oxide Market 2020 - 2024 ($ million)

5.2 Type segment analysis 2020 - 2024

Historic Market Size - Type Segment 2020 - 2024 ($ million)

5.3 End-user segment analysis 2020 - 2024

Historic Market Size - End-user Segment 2020 - 2024 ($ million)

5.4 Application segment analysis 2020 - 2024

Historic Market Size - Application Segment 2020 - 2024 ($ million)

5.5 Geography segment analysis 2020 - 2024

Historic Market Size - Geography Segment 2020 - 2024 ($ million)

5.6 Country segment analysis 2020 - 2024

Historic Market Size - Country Segment 2020 - 2024 ($ million)

6. Qualitative Analysis

6.1 Impact of AI on Global Calcium Oxide Market

6.2 Impact of Geopolitical Conflicts on Global Calcium Oxide Market

7. Five Forces Analysis

7.1 Five forces summary

Five forces analysis - Comparison between 2025 and 2030

7.2 Bargaining power of buyers

Bargaining power of buyers - Impact of key factors 2025 and 2030

7.3 Bargaining power of suppliers

Bargaining power of suppliers - Impact of key factors in 2025 and 2030

7.4 Threat of new entrants

Threat of new entrants - Impact of key factors in 2025 and 2030

7.5 Threat of substitutes

Threat of substitutes - Impact of key factors in 2025 and 2030

7.6 Threat of rivalry

Threat of rivalry - Impact of key factors in 2025 and 2030

7.7 Market condition

Chart on Market condition - Five forces 2025 and 2030

8. Market Segmentation by Type

8.1 Market segments

Chart on Type - Market share 2025-2030 (%)
Data Table on Type - Market share 2025-2030 (%)

8.2 Comparison by Type

Chart on Comparison by Type
Data Table on Comparison by Type

8.3 Lump lime - Market size and forecast 2025-2030

Chart on Lump lime - Market size and forecast 2025-2030 ($ million)
Data Table on Lump lime - Market size and forecast 2025-2030 ($ million)
Chart on Lump lime - Year-over-year growth 2025-2030 (%)
Data Table on Lump lime - Year-over-year growth 2025-2030 (%)

8.4 Pulverized and powdered lime - Market size and forecast 2025-2030

Chart on Pulverized and powdered lime - Market size and forecast 2025-2030 ($ million)
Data Table on Pulverized and powdered lime - Market size and forecast 2025-2030 ($ million)
Chart on Pulverized and powdered lime - Year-over-year growth 2025-2030 (%)
Data Table on Pulverized and powdered lime - Year-over-year growth 2025-2030 (%)

8.5 Granular lime - Market size and forecast 2025-2030

Chart on Granular lime - Market size and forecast 2025-2030 ($ million)
Data Table on Granular lime - Market size and forecast 2025-2030 ($ million)
Chart on Granular lime - Year-over-year growth 2025-2030 (%)
Data Table on Granular lime - Year-over-year growth 2025-2030 (%)

8.6 Fine-ground and micronized lime - Market size and forecast 2025-2030

Chart on Fine-ground and micronized lime - Market size and forecast 2025-2030 ($ million)
Data Table on Fine-ground and micronized lime - Market size and forecast 2025-2030 ($ million)
Chart on Fine-ground and micronized lime - Year-over-year growth 2025-2030 (%)
Data Table on Fine-ground and micronized lime - Year-over-year growth 2025-2030 (%)

8.7 Market opportunity by Type

Market opportunity by Type ($ million)
Data Table on Market opportunity by Type ($ million)

9. Market Segmentation by End-user

9.1 Market segments

Chart on End-user - Market share 2025-2030 (%)
Data Table on End-user - Market share 2025-2030 (%)

9.2 Comparison by End-user

Chart on Comparison by End-user
Data Table on Comparison by End-user

9.3 Iron and steel - Market size and forecast 2025-2030

Chart on Iron and steel - Market size and forecast 2025-2030 ($ million)
Data Table on Iron and steel - Market size and forecast 2025-2030 ($ million)
Chart on Iron and steel - Year-over-year growth 2025-2030 (%)
Data Table on Iron and steel - Year-over-year growth 2025-2030 (%)

9.4 Construction and building materials - Market size and forecast 2025-2030

Chart on Construction and building materials - Market size and forecast 2025-2030 ($ million)
Data Table on Construction and building materials - Market size and forecast 2025-2030 ($ million)
Chart on Construction and building materials - Year-over-year growth 2025-2030 (%)
Data Table on Construction and building materials - Year-over-year growth 2025-2030 (%)

9.5 Chemicals and petrochemicals - Market size and forecast 2025-2030

Chart on Chemicals and petrochemicals - Market size and forecast 2025-2030 ($ million)
Data Table on Chemicals and petrochemicals - Market size and forecast 2025-2030 ($ million)
Chart on Chemicals and petrochemicals - Year-over-year growth 2025-2030 (%)
Data Table on Chemicals and petrochemicals - Year-over-year growth 2025-2030 (%)

9.6 Water and environmental services - Market size and forecast 2025-2030

Chart on Water and environmental services - Market size and forecast 2025-2030 ($ million)
Data Table on Water and environmental services - Market size and forecast 2025-2030 ($ million)
Chart on Water and environmental services - Year-over-year growth 2025-2030 (%)
Data Table on Water and environmental services - Year-over-year growth 2025-2030 (%)

9.7 Others - Market size and forecast 2025-2030

Chart on Others - Market size and forecast 2025-2030 ($ million)
Data Table on Others - Market size and forecast 2025-2030 ($ million)
Chart on Others - Year-over-year growth 2025-2030 (%)
Data Table on Others - Year-over-year growth 2025-2030 (%)

9.8 Market opportunity by End-user

Market opportunity by End-user ($ million)
Data Table on Market opportunity by End-user ($ million)

10. Market Segmentation by Application

10.1 Market segments

Chart on Application - Market share 2025-2030 (%)
Data Table on Application - Market share 2025-2030 (%)

10.2 Comparison by Application

Chart on Comparison by Application
Data Table on Comparison by Application

10.3 Iron and steel production - Market size and forecast 2025-2030

Chart on Iron and steel production - Market size and forecast 2025-2030 ($ million)
Data Table on Iron and steel production - Market size and forecast 2025-2030 ($ million)
Chart on Iron and steel production - Year-over-year growth 2025-2030 (%)
Data Table on Iron and steel production - Year-over-year growth 2025-2030 (%)

10.4 Construction and cement manufacturing - Market size and forecast 2025-2030

Chart on Construction and cement manufacturing - Market size and forecast 2025-2030 ($ million)
Data Table on Construction and cement manufacturing - Market size and forecast 2025-2030 ($ million)
Chart on Construction and cement manufacturing - Year-over-year growth 2025-2030 (%)
Data Table on Construction and cement manufacturing - Year-over-year growth 2025-2030 (%)

10.5 Chemical manufacturing - Market size and forecast 2025-2030

Chart on Chemical manufacturing - Market size and forecast 2025-2030 ($ million)
Data Table on Chemical manufacturing - Market size and forecast 2025-2030 ($ million)
Chart on Chemical manufacturing - Year-over-year growth 2025-2030 (%)
Data Table on Chemical manufacturing - Year-over-year growth 2025-2030 (%)

10.6 Water and wastewater treatment - Market size and forecast 2025-2030

Chart on Water and wastewater treatment - Market size and forecast 2025-2030 ($ million)
Data Table on Water and wastewater treatment - Market size and forecast 2025-2030 ($ million)
Chart on Water and wastewater treatment - Year-over-year growth 2025-2030 (%)
Data Table on Water and wastewater treatment - Year-over-year growth 2025-2030 (%)

10.7 Others - Market size and forecast 2025-2030

Chart on Others - Market size and forecast 2025-2030 ($ million)
Data Table on Others - Market size and forecast 2025-2030 ($ million)
Chart on Others - Year-over-year growth 2025-2030 (%)
Data Table on Others - Year-over-year growth 2025-2030 (%)

10.8 Market opportunity by Application

Market opportunity by Application ($ million)
Data Table on Market opportunity by Application ($ million)

11. Customer Landscape

11.1 Customer landscape overview

Analysis of price sensitivity, lifecycle, customer purchase basket, adoption rates, and purchase criteria

12. Geographic Landscape

12.1 Geographic segmentation

Chart on Market share by geography 2025-2030 (%)
Data Table on Market share by geography 2025-2030 (%)

12.2 Geographic comparison

Chart on Geographic comparison
Data Table on Geographic comparison

12.3 APAC - Market size and forecast 2025-2030

Chart on APAC - Market size and forecast 2025-2030 ($ million)
Data Table on APAC - Market size and forecast 2025-2030 ($ million)
Chart on APAC - Year-over-year growth 2025-2030 (%)
Data Table on APAC - Year-over-year growth 2025-2030 (%)
Chart on Regional Comparison - APAC
Data Table on Regional Comparison - APAC

12.3.1 China - Market size and forecast 2025-2030

Chart on China - Market size and forecast 2025-2030 ($ million)
Data Table on China - Market size and forecast 2025-2030 ($ million)
Chart on China - Year-over-year growth 2025-2030 (%)
Data Table on China - Year-over-year growth 2025-2030 (%)

12.3.2 India - Market size and forecast 2025-2030

Chart on India - Market size and forecast 2025-2030 ($ million)
Data Table on India - Market size and forecast 2025-2030 ($ million)
Chart on India - Year-over-year growth 2025-2030 (%)
Data Table on India - Year-over-year growth 2025-2030 (%)

12.3.3 Japan - Market size and forecast 2025-2030

Chart on Japan - Market size and forecast 2025-2030 ($ million)
Data Table on Japan - Market size and forecast 2025-2030 ($ million)
Chart on Japan - Year-over-year growth 2025-2030 (%)
Data Table on Japan - Year-over-year growth 2025-2030 (%)

12.3.4 Australia - Market size and forecast 2025-2030

Chart on Australia - Market size and forecast 2025-2030 ($ million)
Data Table on Australia - Market size and forecast 2025-2030 ($ million)
Chart on Australia - Year-over-year growth 2025-2030 (%)
Data Table on Australia - Year-over-year growth 2025-2030 (%)

12.3.5 South Korea - Market size and forecast 2025-2030

Chart on South Korea - Market size and forecast 2025-2030 ($ million)
Data Table on South Korea - Market size and forecast 2025-2030 ($ million)
Chart on South Korea - Year-over-year growth 2025-2030 (%)
Data Table on South Korea - Year-over-year growth 2025-2030 (%)

12.3.6 Indonesia - Market size and forecast 2025-2030

Chart on Indonesia - Market size and forecast 2025-2030 ($ million)
Data Table on Indonesia - Market size and forecast 2025-2030 ($ million)
Chart on Indonesia - Year-over-year growth 2025-2030 (%)
Data Table on Indonesia - Year-over-year growth 2025-2030 (%)

12.4 North America - Market size and forecast 2025-2030

Chart on North America - Market size and forecast 2025-2030 ($ million)
Data Table on North America - Market size and forecast 2025-2030 ($ million)
Chart on North America - Year-over-year growth 2025-2030 (%)
Data Table on North America - Year-over-year growth 2025-2030 (%)
Chart on Regional Comparison - North America
Data Table on Regional Comparison - North America

12.4.1 US - Market size and forecast 2025-2030

Chart on US - Market size and forecast 2025-2030 ($ million)
Data Table on US - Market size and forecast 2025-2030 ($ million)
Chart on US - Year-over-year growth 2025-2030 (%)
Data Table on US - Year-over-year growth 2025-2030 (%)

12.4.2 Mexico - Market size and forecast 2025-2030

Chart on Mexico - Market size and forecast 2025-2030 ($ million)
Data Table on Mexico - Market size and forecast 2025-2030 ($ million)
Chart on Mexico - Year-over-year growth 2025-2030 (%)
Data Table on Mexico - Year-over-year growth 2025-2030 (%)

12.4.3 Canada - Market size and forecast 2025-2030

Chart on Canada - Market size and forecast 2025-2030 ($ million)
Data Table on Canada - Market size and forecast 2025-2030 ($ million)
Chart on Canada - Year-over-year growth 2025-2030 (%)
Data Table on Canada - Year-over-year growth 2025-2030 (%)

12.5 Europe - Market size and forecast 2025-2030

Chart on Europe - Market size and forecast 2025-2030 ($ million)
Data Table on Europe - Market size and forecast 2025-2030 ($ million)
Chart on Europe - Year-over-year growth 2025-2030 (%)
Data Table on Europe - Year-over-year growth 2025-2030 (%)
Chart on Regional Comparison - Europe
Data Table on Regional Comparison - Europe

12.5.1 Germany - Market size and forecast 2025-2030

Chart on Germany - Market size and forecast 2025-2030 ($ million)
Data Table on Germany - Market size and forecast 2025-2030 ($ million)
Chart on Germany - Year-over-year growth 2025-2030 (%)
Data Table on Germany - Year-over-year growth 2025-2030 (%)

12.5.2 France - Market size and forecast 2025-2030

Chart on France - Market size and forecast 2025-2030 ($ million)
Data Table on France - Market size and forecast 2025-2030 ($ million)
Chart on France - Year-over-year growth 2025-2030 (%)
Data Table on France - Year-over-year growth 2025-2030 (%)

12.5.3 Italy - Market size and forecast 2025-2030

Chart on Italy - Market size and forecast 2025-2030 ($ million)
Data Table on Italy - Market size and forecast 2025-2030 ($ million)
Chart on Italy - Year-over-year growth 2025-2030 (%)
Data Table on Italy - Year-over-year growth 2025-2030 (%)

12.5.4 UK - Market size and forecast 2025-2030

Chart on UK - Market size and forecast 2025-2030 ($ million)
Data Table on UK - Market size and forecast 2025-2030 ($ million)
Chart on UK - Year-over-year growth 2025-2030 (%)
Data Table on UK - Year-over-year growth 2025-2030 (%)

12.5.5 Spain - Market size and forecast 2025-2030

Chart on Spain - Market size and forecast 2025-2030 ($ million)
Data Table on Spain - Market size and forecast 2025-2030 ($ million)
Chart on Spain - Year-over-year growth 2025-2030 (%)
Data Table on Spain - Year-over-year growth 2025-2030 (%)

12.5.6 The Netherlands - Market size and forecast 2025-2030

Chart on The Netherlands - Market size and forecast 2025-2030 ($ million)
Data Table on The Netherlands - Market size and forecast 2025-2030 ($ million)
Chart on The Netherlands - Year-over-year growth 2025-2030 (%)
Data Table on The Netherlands - Year-over-year growth 2025-2030 (%)

12.6 Middle East and Africa - Market size and forecast 2025-2030

Chart on Middle East and Africa - Market size and forecast 2025-2030 ($ million)
Data Table on Middle East and Africa - Market size and forecast 2025-2030 ($ million)
Chart on Middle East and Africa - Year-over-year growth 2025-2030 (%)
Data Table on Middle East and Africa - Year-over-year growth 2025-2030 (%)
Chart on Regional Comparison - Middle East and Africa
Data Table on Regional Comparison - Middle East and Africa

12.6.1 Turkey - Market size and forecast 2025-2030

Chart on Turkey - Market size and forecast 2025-2030 ($ million)
Data Table on Turkey - Market size and forecast 2025-2030 ($ million)
Chart on Turkey - Year-over-year growth 2025-2030 (%)
Data Table on Turkey - Year-over-year growth 2025-2030 (%)

12.6.2 South Africa - Market size and forecast 2025-2030

Chart on South Africa - Market size and forecast 2025-2030 ($ million)
Data Table on South Africa - Market size and forecast 2025-2030 ($ million)
Chart on South Africa - Year-over-year growth 2025-2030 (%)
Data Table on South Africa - Year-over-year growth 2025-2030 (%)

12.6.3 Saudi Arabia - Market size and forecast 2025-2030

Chart on Saudi Arabia - Market size and forecast 2025-2030 ($ million)
Data Table on Saudi Arabia - Market size and forecast 2025-2030 ($ million)
Chart on Saudi Arabia - Year-over-year growth 2025-2030 (%)
Data Table on Saudi Arabia - Year-over-year growth 2025-2030 (%)

12.6.4 UAE - Market size and forecast 2025-2030

Chart on UAE - Market size and forecast 2025-2030 ($ million)
Data Table on UAE - Market size and forecast 2025-2030 ($ million)
Chart on UAE - Year-over-year growth 2025-2030 (%)
Data Table on UAE - Year-over-year growth 2025-2030 (%)

12.6.5 Israel - Market size and forecast 2025-2030

Chart on Israel - Market size and forecast 2025-2030 ($ million)
Data Table on Israel - Market size and forecast 2025-2030 ($ million)
Chart on Israel - Year-over-year growth 2025-2030 (%)
Data Table on Israel - Year-over-year growth 2025-2030 (%)

12.7 South America - Market size and forecast 2025-2030

Chart on South America - Market size and forecast 2025-2030 ($ million)
Data Table on South America - Market size and forecast 2025-2030 ($ million)
Chart on South America - Year-over-year growth 2025-2030 (%)
Data Table on South America - Year-over-year growth 2025-2030 (%)
Chart on Regional Comparison - South America
Data Table on Regional Comparison - South America

12.7.1 Brazil - Market size and forecast 2025-2030

Chart on Brazil - Market size and forecast 2025-2030 ($ million)
Data Table on Brazil - Market size and forecast 2025-2030 ($ million)
Chart on Brazil - Year-over-year growth 2025-2030 (%)
Data Table on Brazil - Year-over-year growth 2025-2030 (%)

12.7.2 Argentina - Market size and forecast 2025-2030

Chart on Argentina - Market size and forecast 2025-2030 ($ million)
Data Table on Argentina - Market size and forecast 2025-2030 ($ million)
Chart on Argentina - Year-over-year growth 2025-2030 (%)
Data Table on Argentina - Year-over-year growth 2025-2030 (%)

12.7.3 Colombia - Market size and forecast 2025-2030

Chart on Colombia - Market size and forecast 2025-2030 ($ million)
Data Table on Colombia - Market size and forecast 2025-2030 ($ million)
Chart on Colombia - Year-over-year growth 2025-2030 (%)
Data Table on Colombia - Year-over-year growth 2025-2030 (%)

12.8 Market opportunity by geography

Market opportunity by geography ($ million)
Data Tables on Market opportunity by geography ($ million)

13. Drivers, Challenges, and Opportunity

13.1 Market drivers

Infrastructure expansion and accelerated soil stabilization in civil construction
Heightened demand from metallurgical refining and critical mineral processing
Expansion of environmental compliance solutions in water and flue gas treatment

13.2 Market challenges

Substantial carbon dioxide emission liabilities and decarbonization mandates
Thermal energy volatility and heavy dependency on fossil fuel kiln operation
Logistical constraints, rapid atmospheric degradation, and severe handling hazards

13.3 Impact of drivers and challenges

Impact of drivers and challenges in 2025 and 2030

13.4 Market opportunities

Advancement of kiln decarbonization and carbon capture technologies
Rising demand for ultra-high-purity calcium oxide in chemical and polymer applications
Integration of AI-driven kiln automation and operational optimization

14. Competitive Landscape

14.1 Overview

14.2

Overview on criticality of inputs and factors of differentiation

14.3 Landscape disruption

Overview on factors of disruption

14.4 Industry risks

Impact of key risks on business

15. Competitive Analysis

15.1 Companies profiled

Companies covered

15.2 Company ranking index

15.3 Market positioning of companies

Matrix on companies position and classification

15.4 Adbri Ltd.

Adbri Ltd. - Overview
Adbri Ltd. - Product / Service
Adbri Ltd. - Key offerings
SWOT

15.5 Bhavani chemicals

Bhavani chemicals - Overview
Bhavani chemicals - Product / Service
Bhavani chemicals - Key offerings
SWOT

15.6 Carmeuse SA

Carmeuse SA - Overview
Carmeuse SA - Product / Service
Carmeuse SA - Key offerings
SWOT

15.7 Chemical Bull Pvt. Ltd.

Chemical Bull Pvt. Ltd. - Overview
Chemical Bull Pvt. Ltd. - Product / Service
Chemical Bull Pvt. Ltd. - Key offerings
SWOT

15.8 Cheney Lime and Cement Co.

Cheney Lime and Cement Co. - Overview
Cheney Lime and Cement Co. - Product / Service
Cheney Lime and Cement Co. - Key offerings
SWOT

15.9 Fels-Werke GmbH

Fels-Werke GmbH - Overview
Fels-Werke GmbH - Product / Service
Fels-Werke GmbH - Key offerings
SWOT

15.10 Graymont Ltd.

Graymont Ltd. - Overview
Graymont Ltd. - Product / Service
Graymont Ltd. - Key offerings
SWOT

15.11 Lhoist SA

Lhoist SA - Overview
Lhoist SA - Product / Service
Lhoist SA - Key offerings
SWOT

15.12 Mississippi Lime Co.

Mississippi Lime Co. - Overview
Mississippi Lime Co. - Product / Service
Mississippi Lime Co. - Key offerings
SWOT

15.13 Nordkalk Corp.

Nordkalk Corp. - Overview
Nordkalk Corp. - Product / Service
Nordkalk Corp. - Key offerings
SWOT

15.14 Otto Chemie Pvt. Ltd.

Otto Chemie Pvt. Ltd. - Overview
Otto Chemie Pvt. Ltd. - Product / Service
Otto Chemie Pvt. Ltd. - Key offerings
SWOT

15.15 Pete Lien and Sons Inc.

Pete Lien and Sons Inc. - Overview
Pete Lien and Sons Inc. - Product / Service
Pete Lien and Sons Inc. - Key offerings
SWOT

15.16 Simson Pharma Ltd.

Simson Pharma Ltd. - Overview
Simson Pharma Ltd. - Product / Service
Simson Pharma Ltd. - Key offerings
SWOT

15.17 Thermo Fisher Scientific Inc.

Thermo Fisher Scientific Inc. - Overview
Thermo Fisher Scientific Inc. - Business segments
Thermo Fisher Scientific Inc. - Key news
Thermo Fisher Scientific Inc. - Key offerings
Thermo Fisher Scientific Inc. - Segment focus
SWOT

15.18 United States Lime and Minerals Inc.

United States Lime and Minerals Inc. - Overview
United States Lime and Minerals Inc. - Product / Service
United States Lime and Minerals Inc. - Key offerings
SWOT

16. Appendix

16.1 Scope of the report

Market definition
Objectives
Notes and caveats

16.2 Inclusions and exclusions checklist

Inclusions checklist
Exclusions checklist

16.3 Currency conversion rates for US$

16.4 Research methodology

16.5 Data procurement

Information sources

16.6 Data validation

16.7 Validation techniques employed for market sizing

16.8 Data synthesis

16.9 360 degree market analysis

16.10 List of abbreviations

Research Methodology

Technavio presents a detailed picture of the market by way of study, synthesis, and summation of data from multiple sources. The analysts have presented the various facets of the market with a particular focus on identifying the key industry influencers. The data thus presented is comprehensive, reliable, and the result of extensive research, both primary and secondary.

INFORMATION SOURCES

Primary sources

  • Manufacturers and suppliers
  • Channel partners
  • Industry experts
  • Strategic decision makers

Secondary sources

  • Industry journals and periodicals
  • Government data
  • Financial reports of key industry players
  • Historical data
  • Press releases

DATA ANALYSIS

Data Synthesis

  • Collation of data
  • Estimation of key figures
  • Analysis of derived insights

Data Validation

  • Triangulation with data models
  • Reference against proprietary databases
  • Corroboration with industry experts

REPORT WRITING

Qualitative

  • Market drivers
  • Market challenges
  • Market trends
  • Five forces analysis

Quantitative

  • Market size and forecast
  • Market segmentation
  • Geographical insights
  • Competitive landscape

Interested in this report?

Get your sample now to see our research methodology and insights!

Download Now

Frequently Asked Questions

Calcium Oxide market growth will increase by USD 1154.4 million during 2026-2030.

The Calcium Oxide market is expected to grow at a CAGR of 4.1% during 2026-2030.

Calcium Oxide market is segmented by Type (Lump lime, Pulverized and powdered lime, Granular lime, Fine-ground and micronized lime) End-user (Iron and steel, Construction and building materials, Chemicals and petrochemicals, Water and environmental services, Others) Application (Iron and steel production, Construction and cement manufacturing, Chemical manufacturing, Water and wastewater treatment, Others)

Aadhunik Industries, Adbri Ltd., ANKUR MINERALS PVT. LTD, Bhavani chemicals, Boral Ltd., Carmeuse SA, Chemical Bull Pvt. Ltd., Cheney Lime and Cement Co., Fels-Werke GmbH, Graymont Ltd., Lhoist SA, Mississippi Lime Co., Nordkalk Corp., Otto Chemie Pvt. Ltd., Pete Lien and Sons Inc., RXChemicals, Satya Bharat Minerals, Simson Pharma Ltd., Thermo Fisher Scientific Inc., United States Lime and Minerals Inc. are a few of the key vendors in the Calcium Oxide market.

APAC will register the highest growth rate of 64.9% among the other regions. Therefore, the Calcium Oxide market in APAC is expected to garner significant business opportunities for the vendors during the forecast period.

China, India, Japan, Australia, South Korea, Indonesia, US, Mexico, Canada, Germany, France, Italy, UK, Spain, The Netherlands, Turkey, South Africa, Saudi Arabia, UAE, Israel, Brazil, Argentina, Colombia

  • Infrastructure expansion and accelerated soil stabilization in civil construction is the driving factor this market.

The Calcium Oxide market vendors should focus on grabbing business opportunities from the Type segment as it accounted for the largest market share in the base year.
RIA - Research AI Assistant
Ask RIA
