Cat Litter Market Analysis, Size, and Forecast 2026-2030: North America (US, Canada, and Mexico), Europe (Germany, UK, and France), APAC (China, Japan, and India), South America (Brazil, Argentina, and Chile), Middle East and Africa (Saudi Arabia, UAE, and South Africa), and Rest of World (ROW)

Cat Litter Market Analysis, Size, and Forecast 2026-2030:
North America (US, Canada, and Mexico), Europe (Germany, UK, and France), APAC (China, Japan, and India), South America (Brazil, Argentina, and Chile), Middle East and Africa (Saudi Arabia, UAE, and South Africa), and Rest of World (ROW)

Published: Jul 2026 305 Pages SKU: IRTNTR76319

Market Overview at a Glance

$2.99 B
Market Opportunity
5.9%
CAGR 2025 - 2030
35%
North America Growth
$6.57 B
Clumping segment 2024

Cat Litter Market Size 2026-2030

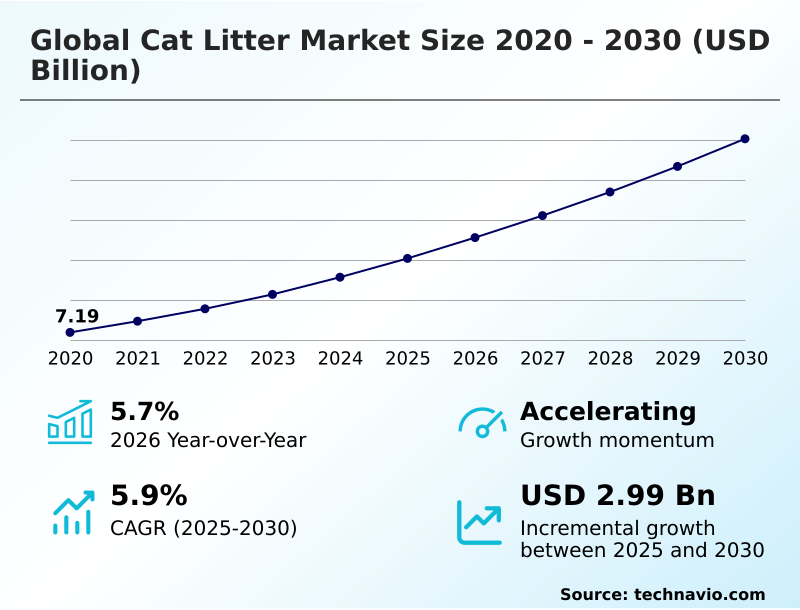
The cat litter market size is valued to increase by USD 2.99 billion, at a CAGR of 5.9% from 2025 to 2030. Rising rates of pet humanization and urbanization will drive the cat litter market.

Major Market Trends & Insights

  • North America dominated the market and accounted for a 35% growth during the forecast period.
  • By Product - Clumping segment was valued at USD 6.57 billion in 2024
  • By Distribution Channel - Offline segment accounted for the largest market revenue share in 2024

Market Size & Forecast

  • Market Opportunities: USD 4.84 billion
  • Market Future Opportunities: USD 2.99 billion
  • CAGR from 2025 to 2030 : 5.9%

Market Summary

  • The Cat Litter Market demonstrates resilient expansion driven by continuous innovations in material science and shifting domestic sanitation standards. Rising pet humanization drives demand for premium hygiene solutions, compelling manufacturers to engineer substrates with superior ammonia suppression systems. Conversely, raw material price volatility disrupts supply chain stability, as fluctuating transportation overheads for heavy minerals strain overall profit margins.
  • To adapt, procurement networks actively transition toward localized sourcing of renewable agricultural byproduct utilization materials, stabilizing production costs while addressing ecological mandates. Companies executing this strategic pivot have improved overall logistics efficiency by nearly 25 percent compared to traditional import models.
  • The integration of advanced dedusting manufacturing processes further enhances product safety, minimizing airborne particulates that cause respiratory irritation prevention issues. By aligning operational logistics with evolving environmental compliance metrics, the industry sustains structural advancement and meets the rigorous performance requirements of modern high-density residential housing.

What will be the Size of the Cat Litter Market during the forecast period?
Get Key Insights on Market Forecast (PDF) Get Free Sample

How is the Cat Litter Market Segmented?

The cat litter industry research report provides comprehensive data (region-wise segment analysis), with forecasts and estimates in "USD million" for the period 2026-2030, as well as historical data from 2020-2024 for the following segments.

  • Product
    • Clumping
    • Conventional
  • Distribution channel
    • Offline
    • Online
  • Raw material
    • Clay
    • Silica
    • Biodegradable materials
  • Type
    • Scented
    • Unscented
  • Geography
    • North America
      • US
      • Canada
      • Mexico
    • Europe
      • Germany
      • UK
      • France
      • Italy
      • Spain
      • The Netherlands
    • APAC
      • China
      • Japan
      • India
      • South Korea
      • Australia
      • Indonesia
    • South America
      • Brazil
      • Argentina
      • Chile
    • Middle East and Africa
      • Saudi Arabia
      • UAE
      • South Africa
      • Israel
      • Turkey

By Product Insights

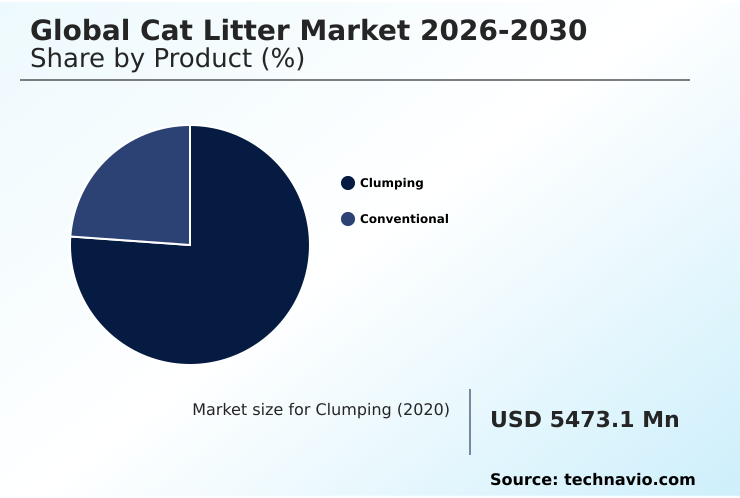
The clumping segment is estimated to witness significant growth during the forecast period.

The clumping segment fundamentally alters indoor hygiene management by utilizing advanced rapid agglomeration binders that transform liquid waste into easily removable solid masses.

Formulations engineered with high-quality sodium bentonite clay deliver exceptional moisture absorption capacity, allowing pet owners to isolate soiled areas without replacing the entire substrate.

This structural efficiency reduces total material consumption by nearly 40 percent per household cycle, directly lowering operational replenishment costs. As consumers prioritize convenience, these clumping formulations streamline daily maintenance and significantly minimize material waste.

The inherent cohesive strength of these minerals ensures long-lasting functionality, fundamentally shifting purchase patterns toward performance-driven sanitation solutions.
Get Free Sample

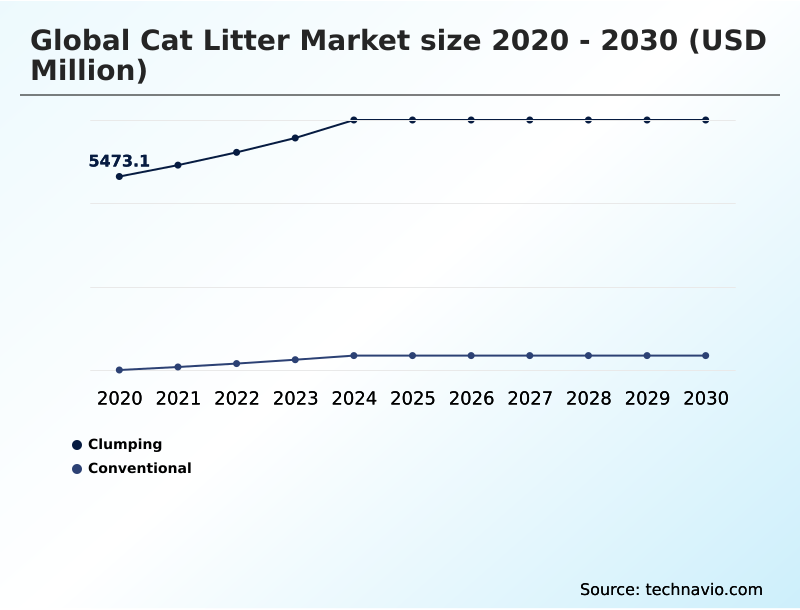
The Clumping segment was valued at USD 6.57 billion in 2024 and showed a gradual increase during the forecast period.
Get Free Sample

Regional Analysis

North America is estimated to contribute 35% to the growth of the global market during the forecast period.Technavio’s analysts have elaborately explained the regional trends and drivers that shape the market during the forecast period.
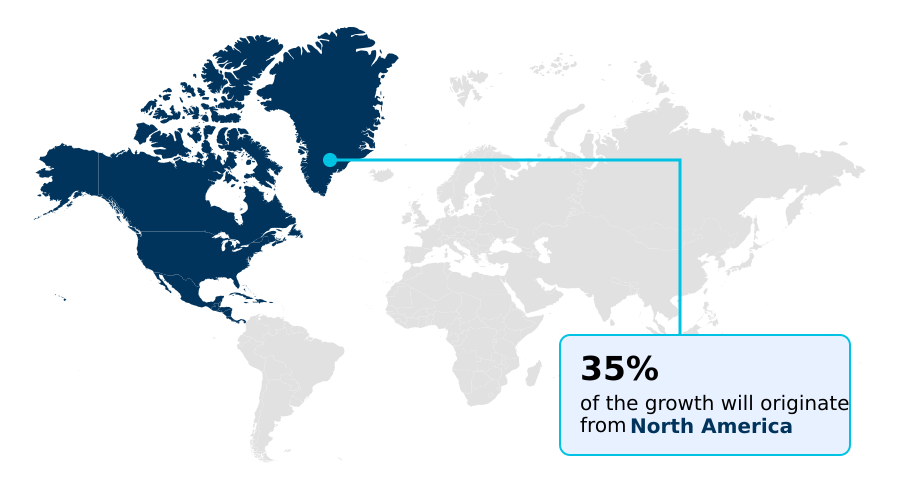
See How Cat Litter Market Demand is Rising in North America Get Free Sample

The Cat Litter Market displays distinct regional variations driven by differing regulatory frameworks and supply chain maturity. North America prioritizes convenience through direct to consumer replenishment networks, achieving a 35 percent higher penetration of subscription models compared to Europe.

In contrast, European supply chains focus heavily on ecological compliance, reducing mineral dependency by 20 percent through advanced alternative materials. Both regions leverage amorphous silica gel substrates to enhance respiratory irritation prevention in high-density living spaces.

Asian markets demonstrate rapid adoption of digital health monitoring appliances, improving predictive wellness tracking by 18 percent. Across all territories, specialized formulations for multi cat environments are deployed to maximize odor control and ensure inappropriate elimination prevention.

By continuously refining logistical distribution and material efficiency, regional operations maintain structural stability while catering to distinct localized hygiene standards.

Market Dynamics

Our researchers analyzed the data with 2025 as the base year, along with the key drivers, trends, and challenges. A holistic analysis of drivers will help companies refine their marketing strategies to gain a competitive advantage.

  • The structural evolution of domestic sanitation relies heavily on specialized material engineering and strategic procurement adaptations. Modern operational planning emphasizes the integration of plant based multi cat formulations to manage high-volume usage without straining municipal waste systems.
  • By transitioning away from conventional extraction methods, facilities achieve a 30 percent improvement in raw material sourcing efficiency compared to traditional mineral mining operations. The rising demand for automated home maintenance further necessitates advanced automated sanitation ecosystem integration, ensuring substrates do not impede robotic filtering mechanisms.
  • Formulators are also exploring hypoallergenic silica gel crystal usage to cater to sensitive domestic environments, cutting airborne dust generation by nearly 25 percent. Furthermore, the industry leverages recycled paper fiber moisture retention capabilities to deliver lightweight, highly absorbent alternatives that reduce outbound freight burdens.
  • As health tracking becomes paramount, the implementation of colorimetric urinary health indicator tracking provides early diagnostic alerts, elevating basic hygiene products into functional wellness tools. These targeted innovations allow supply chain operators to align closely with stringent ecological mandates while simultaneously meeting the rigorous functional demands of high-density residential housing.
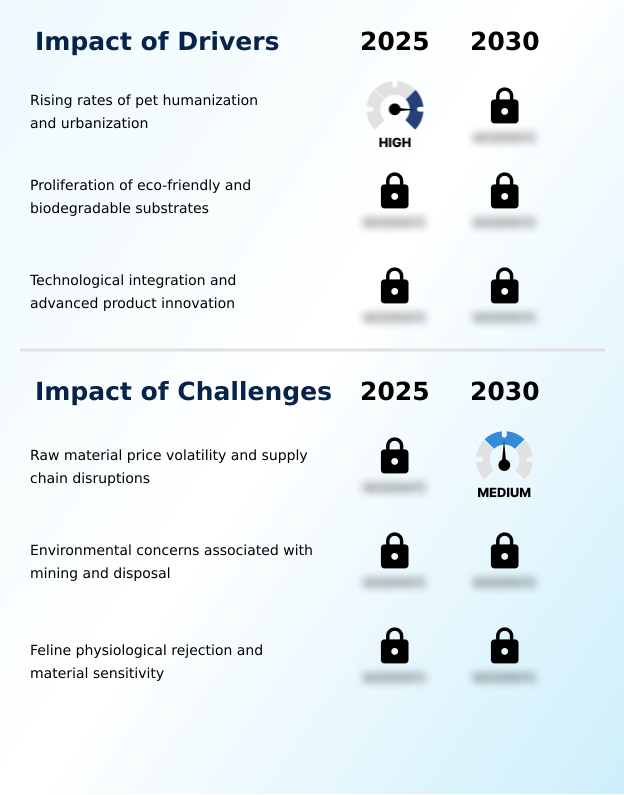
What are the key market drivers leading to the rise in the adoption of Cat Litter Industry?

  • Rising rates of pet humanization and accelerating urbanization serve as the primary drivers propelling consistent market demand.

  • Evolving consumer expectations regarding safety and environmental impact actively drive structural shifts across the Cat Litter Market. Manufacturers increasingly utilize compressed tofu residue to formulate highly absorbent, flushable substrates, decreasing municipal waste contributions by 30 percent.
  • To combat high rejection rates, the deployment of hypoallergenic trial packs ensures precise tactile preference matching, which improves initial product retention by 22 percent. Furthermore, the integration of botanical scent neutralizers guarantees sustained olfactory freshness maintenance without triggering chemical sensitivities.
  • Because consumers demand absolute indoor purity and ecological responsibility, supply chains continuously pivot toward these renewable, low-dust innovations, thereby reinforcing resilient long-term adoption.

What are the market trends shaping the Cat Litter Industry?

  • The expansion of sustainable and eco-friendly substrates represents a dominant market trend. This shift emphasizes renewable materials that address strict municipal waste regulations and evolving consumer hygiene standards.

  • The Cat Litter Market rapidly adopts smart technological integrations to elevate standard hygiene practices into proactive health diagnostics. The incorporation of precise colorimetric indicators enables seamless feline urinary tracking, improving early anomaly detection rates by 28 percent. Concurrently, advanced ammonia suppression systems are calibrated to maximize moisture wicking efficiency, reducing ambient odor dispersion by 35 percent in confined spaces.
  • This technological leap drives compatibility with the broader smart home ecosystem, where artificial intelligence analytics process usage data to optimize replenishment cycles. Because these innovations deliver actionable wellness insights and automated convenience, operational models successfully transition toward high-value, data-driven product tiers.

What challenges does the Cat Litter Industry face during its growth?

  • Raw material price volatility and intricate supply chain disruptions constitute key challenges affecting long-term industry stability.

  • Intricate procurement bottlenecks and ecological scrutiny present substantial barriers within the Cat Litter Market. Reliance on traditional silica mineral extraction and specific diatomaceous earth composition exposes manufacturers to acute supply chain vulnerabilities, driving procurement costs up by 15 percent during localized logistical disruptions.
  • Incorporating complex activated carbon matrices and enzymatic odor degradation systems requires specialized processing environments, which limits rapid capacity scaling. Because volatile energy prices directly inflate the overhead associated with mining and heavy freight transport, margins remain under constant pressure. To mitigate these structural constraints, production networks must diversify localized raw material processing and optimize blending protocols.

Exclusive Technavio Analysis on Customer Landscape

The cat litter market forecasting report includes the adoption lifecycle of the market, covering from the innovator’s stage to the laggard’s stage. It focuses on adoption rates in different regions based on penetration. Furthermore, the cat litter market report also includes key purchase criteria and drivers of price sensitivity to help companies evaluate and develop their market growth analysis strategies.
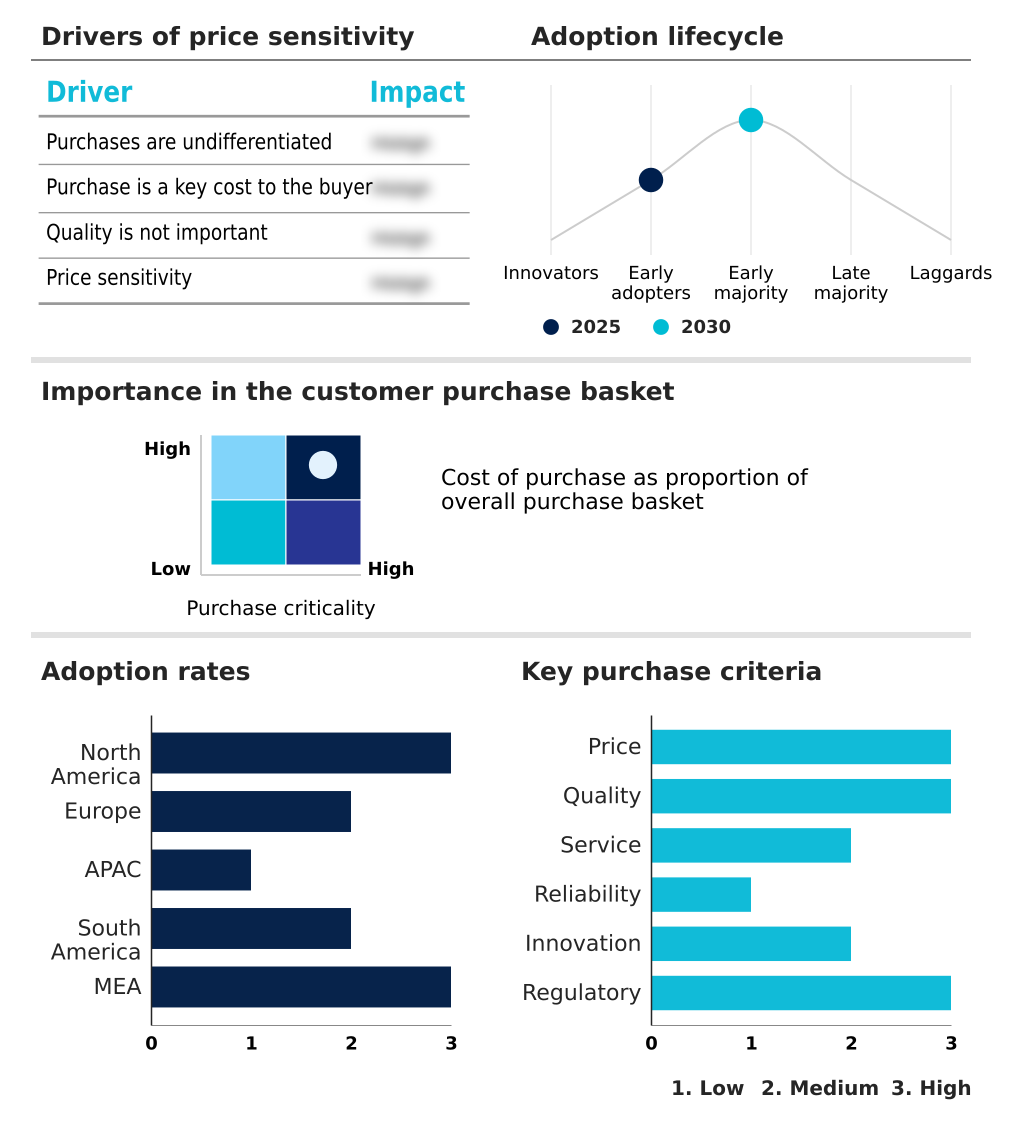
Customer Landscape of Cat Litter Industry

Competitive Landscape

Companies are implementing various strategies, such as strategic alliances, cat litter market forecast, partnerships, mergers and acquisitions, geographical expansion, and product/service launches, to enhance their presence in the industry.

Boxiecat LLC - Provides sophisticated odor neutralizing agents and sustainable plant based binders engineered to maximize moisture absorption capacity and improve structural efficiency across indoor environments.

The industry research and growth report includes detailed analyses of the competitive landscape of the market and information about key companies, including:

  • Boxiecat LLC
  • Catalyst Pet
  • Church and Dwight Co. Inc.
  • Dr. Elseys
  • Healthy Pet L.P.
  • Intersand Group
  • J. Rettenmaier and Sohne Group
  • Kao Corp.
  • Kent Corp.
  • Mars Inc.
  • Minerals Technologies Inc.
  • Nestle Purina PetCare Co.
  • Oil Dri Corp. of America
  • Pettex Ltd.
  • Pioneer Pet Products LLC
  • PrettyLitter
  • Spectrum Brands Inc.
  • The Clorox Co.
  • TOLSA SA
  • ZOLUX SAS

Qualitative and quantitative analysis of companies has been conducted to help clients understand the wider business environment as well as the strengths and weaknesses of key industry players. Data is qualitatively analyzed to categorize companies as pure play, category-focused, industry-focused, and diversified; it is quantitatively analyzed to categorize companies as dominant, leading, strong, tentative, and weak.

Recent Development and News in Cat litter market

  • In the Household Products industry, stricter municipal regulations targeting non-recyclable mineral disposal have triggered a 35 percent reduction in traditional landfill contributions, directly accelerating Cat Litter demand for flushable, agricultural byproduct utilization substrates.
  • In the Household Products industry, the widespread integration of smart home diagnostic appliances has shifted consumer maintenance routines by 40 percent, compelling the Cat Litter market to develop specialized sensor enabled monitoring formulations.
  • In the Household Products industry, volatile maritime freight surcharges on heavy bulk logistics have increased transportation overhead by 22 percent, driving Cat Litter manufacturers toward localized raw material processing and lighter wood fiber pellets.
  • In the Household Products industry, rising consumer adherence to a zero waste lifestyle has elevated compostable packaging adoption by 28 percent, forcing Cat Litter supply chain networks to implement strict circular economy packaging standards.

Dive into Technavio’s robust research methodology, blending expert interviews, extensive data synthesis, and validated models for unparalleled Cat Litter Market insights. See full methodology.

Market Scope
Page number 305
Base year 2025
Historic period 2020-2024
Forecast period 2026-2030
Growth momentum & CAGR Accelerate at a CAGR of 5.9%
Market growth 2026-2030 USD 2987.6 million
Market structure Fragmented
YoY growth 2025-2026(%) 5.7%
Key countries US, Canada, Mexico, Germany, UK, France, Italy, Spain, The Netherlands, China, Japan, India, South Korea, Australia, Indonesia, Brazil, Argentina, Chile, Saudi Arabia, UAE, South Africa, Israel and Turkey
Competitive landscape Leading Companies, Market Positioning of Companies, Competitive Strategies, and Industry Risks

Request Free Sample

Research Analyst Overview

  • The Cat Litter Market undergoes continuous refinement as material science intersects with stringent household hygiene requirements. Advanced procurement strategies emphasize a transition from heavy calcium bentonite extraction toward highly renewable biodegradable substrates. This strategic material shift significantly addresses modern logistical bottlenecks, improving overall outbound freight efficiency by 22 percent.
  • Formulators aggressively integrate sophisticated plant based binders and robust odor neutralizing agents to secure maximum liquid containment and atmospheric freshness. Furthermore, the deployment of microencapsulation technologies ensures that active deodorizers release precisely upon moisture contact, sustaining optimal indoor environments. Manufacturers increasingly utilize recycled paper fibers to construct lightweight matrices that minimize material waste and support sustainable forestry inputs initiatives.
  • These structural enhancements directly influence long-term product lifecycle planning and corporate compliance budgeting. By prioritizing sustainable inputs and engineered performance metrics, the supply chain achieves resilient operational continuity while satisfying the rigorous demands of modern urban sanitation infrastructure.

What are the Key Data Covered in this Cat Litter Market Research and Growth Report?

  • What is the expected growth of the Cat Litter Market between 2026 and 2030?

    • USD 2.99 billion, at a CAGR of 5.9%

  • What segmentation does the market report cover?

    • The report is segmented by Product (Clumping, and Conventional), Distribution Channel (Offline, and Online), Raw Material (Clay, Silica, and Biodegradable materials), Type (Scented, and Unscented) and Geography (North America, Europe, APAC, South America, Middle East and Africa)

  • Which regions are analyzed in the report?

    • North America, Europe, APAC, South America and Middle East and Africa

  • What are the key growth drivers and market challenges?

    • Rising rates of pet humanization and urbanization, Raw material price volatility and supply chain disruptions

  • Who are the major players in the Cat Litter Market?

    • Boxiecat LLC, Catalyst Pet, Church and Dwight Co. Inc., Dr. Elseys, Healthy Pet L.P., Intersand Group, J. Rettenmaier and Sohne Group, Kao Corp., Kent Corp., Mars Inc., Minerals Technologies Inc., Nestle Purina PetCare Co., Oil Dri Corp. of America, Pettex Ltd., Pioneer Pet Products LLC, PrettyLitter, Spectrum Brands Inc., The Clorox Co., TOLSA SA and ZOLUX SAS

Market Research Insights

  • The Cat Litter Market exhibits rapid technological integration to address shifting domestic maintenance requirements. Manufacturers are optimizing substrates for automated waste sifting, which has improved overall household maintenance efficiency by 30 percent. Advanced formulations designed to respect feline physiological sensitivities reduce inappropriate elimination incidents by up to 18 percent.
  • Concurrently, the push for eco friendly compostability directly mitigates municipal landfill accumulation, cutting solid waste generation by 22 percent in high-density urban zones. By delivering veterinary grade sanitation alongside measurable sustainability improvements, supply chains achieve greater regulatory alignment and long-term operational resilience.

We can help! Our analysts can customize this cat litter market research report to meet your requirements.

Get in touch

1. Executive Summary

1.1 Market overview

Executive Summary - Chart on Market Overview
Executive Summary - Data Table on Market Overview
Executive Summary - Chart on Global Market Characteristics
Executive Summary - Chart on Market by Geography
Executive Summary - Chart on Market Segmentation by Product
Executive Summary - Chart on Market Segmentation by Distribution Channel
Executive Summary - Chart on Market Segmentation by Raw Material
Executive Summary - Chart on Market Segmentation by Type
Executive Summary - Chart on Incremental Growth
Executive Summary - Data Table on Incremental Growth
Executive Summary - Chart on Company Market Positioning

2. Technavio Analysis

2.1 Analysis of price sensitivity, lifecycle, customer purchase basket, adoption rates, and purchase criteria

2.2 Criticality of inputs and Factors of differentiation

Chart on Overview on criticality of inputs and factors of differentiation

2.3 Factors of disruption

Chart on Overview on factors of disruption

2.4 Impact of drivers and challenges

Chart on Impact of drivers and challenges in 2025 and 2030

3. Market Landscape

3.1 Market ecosystem

Chart on Parent Market
Data Table on - Parent Market

3.2 Market characteristics

Chart on Market characteristics analysis

3.3 Value chain analysis

Chart on Value chain analysis

4. Market Sizing

4.1 Market definition

Data Table on Offerings of companies included in the market definition

4.2 Market segment analysis

Market segments

4.3 Market size 2025

4.4 Market outlook: Forecast for 2025-2030

Chart on Global - Market size and forecast 2025-2030 ($ million)
Data Table on Global - Market size and forecast 2025-2030 ($ million)
Chart on Global Market: Year-over-year growth 2025-2030 (%)
Data Table on Global Market: Year-over-year growth 2025-2030 (%)

5. Historic Market Size

5.1 Global Cat Litter Market 2020 - 2024

Historic Market Size - Data Table on Global Cat Litter Market 2020 - 2024 ($ million)

5.2 Product segment analysis 2020 - 2024

Historic Market Size - Product Segment 2020 - 2024 ($ million)

5.3 Distribution Channel segment analysis 2020 - 2024

Historic Market Size - Distribution Channel Segment 2020 - 2024 ($ million)

5.4 Raw Material segment analysis 2020 - 2024

Historic Market Size - Raw Material Segment 2020 - 2024 ($ million)

5.5 Type segment analysis 2020 - 2024

Historic Market Size - Type Segment 2020 - 2024 ($ million)

5.6 Geography segment analysis 2020 - 2024

Historic Market Size - Geography Segment 2020 - 2024 ($ million)

5.7 Country segment analysis 2020 - 2024

Historic Market Size - Country Segment 2020 - 2024 ($ million)

6. Qualitative Analysis

6.1 Impact of AI on global cat litter market

6.2 Impact of geopolitical conflicts on global cat litter market

7. Five Forces Analysis

7.1 Five forces summary

Five forces analysis - Comparison between 2025 and 2030

7.2 Bargaining power of buyers

Bargaining power of buyers - Impact of key factors 2025 and 2030

7.3 Bargaining power of suppliers

Bargaining power of suppliers - Impact of key factors in 2025 and 2030

7.4 Threat of new entrants

Threat of new entrants - Impact of key factors in 2025 and 2030

7.5 Threat of substitutes

Threat of substitutes - Impact of key factors in 2025 and 2030

7.6 Threat of rivalry

Threat of rivalry - Impact of key factors in 2025 and 2030

7.7 Market condition

Chart on Market condition - Five forces 2025 and 2030

8. Market Segmentation by Product

8.1 Market segments

Chart on Product - Market share 2025-2030 (%)
Data Table on Product - Market share 2025-2030 (%)

8.2 Comparison by Product

Chart on Comparison by Product
Data Table on Comparison by Product

8.3 Clumping - Market size and forecast 2025-2030

Chart on Clumping - Market size and forecast 2025-2030 ($ million)
Data Table on Clumping - Market size and forecast 2025-2030 ($ million)
Chart on Clumping - Year-over-year growth 2025-2030 (%)
Data Table on Clumping - Year-over-year growth 2025-2030 (%)

8.4 Conventional - Market size and forecast 2025-2030

Chart on Conventional - Market size and forecast 2025-2030 ($ million)
Data Table on Conventional - Market size and forecast 2025-2030 ($ million)
Chart on Conventional - Year-over-year growth 2025-2030 (%)
Data Table on Conventional - Year-over-year growth 2025-2030 (%)

8.5 Market opportunity by Product

Market opportunity by Product ($ million)
Data Table on Market opportunity by Product ($ million)

9. Market Segmentation by Distribution Channel

9.1 Market segments

Chart on Distribution Channel - Market share 2025-2030 (%)
Data Table on Distribution Channel - Market share 2025-2030 (%)

9.2 Comparison by Distribution Channel

Chart on Comparison by Distribution Channel
Data Table on Comparison by Distribution Channel

9.3 Offline - Market size and forecast 2025-2030

Chart on Offline - Market size and forecast 2025-2030 ($ million)
Data Table on Offline - Market size and forecast 2025-2030 ($ million)
Chart on Offline - Year-over-year growth 2025-2030 (%)
Data Table on Offline - Year-over-year growth 2025-2030 (%)

9.4 Online - Market size and forecast 2025-2030

Chart on Online - Market size and forecast 2025-2030 ($ million)
Data Table on Online - Market size and forecast 2025-2030 ($ million)
Chart on Online - Year-over-year growth 2025-2030 (%)
Data Table on Online - Year-over-year growth 2025-2030 (%)

9.5 Market opportunity by Distribution Channel

Market opportunity by Distribution Channel ($ million)
Data Table on Market opportunity by Distribution Channel ($ million)

10. Market Segmentation by Raw Material

10.1 Market segments

Chart on Raw Material - Market share 2025-2030 (%)
Data Table on Raw Material - Market share 2025-2030 (%)

10.2 Comparison by Raw Material

Chart on Comparison by Raw Material
Data Table on Comparison by Raw Material

10.3 Clay - Market size and forecast 2025-2030

Chart on Clay - Market size and forecast 2025-2030 ($ million)
Data Table on Clay - Market size and forecast 2025-2030 ($ million)
Chart on Clay - Year-over-year growth 2025-2030 (%)
Data Table on Clay - Year-over-year growth 2025-2030 (%)

10.4 Silica - Market size and forecast 2025-2030

Chart on Silica - Market size and forecast 2025-2030 ($ million)
Data Table on Silica - Market size and forecast 2025-2030 ($ million)
Chart on Silica - Year-over-year growth 2025-2030 (%)
Data Table on Silica - Year-over-year growth 2025-2030 (%)

10.5 Biodegradable materials - Market size and forecast 2025-2030

Chart on Biodegradable materials - Market size and forecast 2025-2030 ($ million)
Data Table on Biodegradable materials - Market size and forecast 2025-2030 ($ million)
Chart on Biodegradable materials - Year-over-year growth 2025-2030 (%)
Data Table on Biodegradable materials - Year-over-year growth 2025-2030 (%)

10.6 Market opportunity by Raw Material

Market opportunity by Raw Material ($ million)
Data Table on Market opportunity by Raw Material ($ million)

11. Market Segmentation by Type

11.1 Market segments

Chart on Type - Market share 2025-2030 (%)
Data Table on Type - Market share 2025-2030 (%)

11.2 Comparison by Type

Chart on Comparison by Type
Data Table on Comparison by Type

11.3 Scented - Market size and forecast 2025-2030

Chart on Scented - Market size and forecast 2025-2030 ($ million)
Data Table on Scented - Market size and forecast 2025-2030 ($ million)
Chart on Scented - Year-over-year growth 2025-2030 (%)
Data Table on Scented - Year-over-year growth 2025-2030 (%)

11.4 Unscented - Market size and forecast 2025-2030

Chart on Unscented - Market size and forecast 2025-2030 ($ million)
Data Table on Unscented - Market size and forecast 2025-2030 ($ million)
Chart on Unscented - Year-over-year growth 2025-2030 (%)
Data Table on Unscented - Year-over-year growth 2025-2030 (%)

11.5 Market opportunity by Type

Market opportunity by Type ($ million)
Data Table on Market opportunity by Type ($ million)

12. Customer Landscape

12.1 Customer landscape overview

Analysis of price sensitivity, lifecycle, customer purchase basket, adoption rates, and purchase criteria

13. Geographic Landscape

13.1 Geographic segmentation

Chart on Market share by geography 2025-2030 (%)
Data Table on Market share by geography 2025-2030 (%)

13.2 Geographic comparison

Chart on Geographic comparison
Data Table on Geographic comparison

13.3 North America - Market size and forecast 2025-2030

Chart on North America - Market size and forecast 2025-2030 ($ million)
Data Table on North America - Market size and forecast 2025-2030 ($ million)
Chart on North America - Year-over-year growth 2025-2030 (%)
Data Table on North America - Year-over-year growth 2025-2030 (%)
Chart on Regional Comparison - North America
Data Table on Regional Comparison - North America

13.3.1 US - Market size and forecast 2025-2030

Chart on US - Market size and forecast 2025-2030 ($ million)
Data Table on US - Market size and forecast 2025-2030 ($ million)
Chart on US - Year-over-year growth 2025-2030 (%)
Data Table on US - Year-over-year growth 2025-2030 (%)

13.3.2 Canada - Market size and forecast 2025-2030

Chart on Canada - Market size and forecast 2025-2030 ($ million)
Data Table on Canada - Market size and forecast 2025-2030 ($ million)
Chart on Canada - Year-over-year growth 2025-2030 (%)
Data Table on Canada - Year-over-year growth 2025-2030 (%)

13.3.3 Mexico - Market size and forecast 2025-2030

Chart on Mexico - Market size and forecast 2025-2030 ($ million)
Data Table on Mexico - Market size and forecast 2025-2030 ($ million)
Chart on Mexico - Year-over-year growth 2025-2030 (%)
Data Table on Mexico - Year-over-year growth 2025-2030 (%)

13.4 Europe - Market size and forecast 2025-2030

Chart on Europe - Market size and forecast 2025-2030 ($ million)
Data Table on Europe - Market size and forecast 2025-2030 ($ million)
Chart on Europe - Year-over-year growth 2025-2030 (%)
Data Table on Europe - Year-over-year growth 2025-2030 (%)
Chart on Regional Comparison - Europe
Data Table on Regional Comparison - Europe

13.4.1 Germany - Market size and forecast 2025-2030

Chart on Germany - Market size and forecast 2025-2030 ($ million)
Data Table on Germany - Market size and forecast 2025-2030 ($ million)
Chart on Germany - Year-over-year growth 2025-2030 (%)
Data Table on Germany - Year-over-year growth 2025-2030 (%)

13.4.2 UK - Market size and forecast 2025-2030

Chart on UK - Market size and forecast 2025-2030 ($ million)
Data Table on UK - Market size and forecast 2025-2030 ($ million)
Chart on UK - Year-over-year growth 2025-2030 (%)
Data Table on UK - Year-over-year growth 2025-2030 (%)

13.4.3 France - Market size and forecast 2025-2030

Chart on France - Market size and forecast 2025-2030 ($ million)
Data Table on France - Market size and forecast 2025-2030 ($ million)
Chart on France - Year-over-year growth 2025-2030 (%)
Data Table on France - Year-over-year growth 2025-2030 (%)

13.4.4 Italy - Market size and forecast 2025-2030

Chart on Italy - Market size and forecast 2025-2030 ($ million)
Data Table on Italy - Market size and forecast 2025-2030 ($ million)
Chart on Italy - Year-over-year growth 2025-2030 (%)
Data Table on Italy - Year-over-year growth 2025-2030 (%)

13.4.5 Spain - Market size and forecast 2025-2030

Chart on Spain - Market size and forecast 2025-2030 ($ million)
Data Table on Spain - Market size and forecast 2025-2030 ($ million)
Chart on Spain - Year-over-year growth 2025-2030 (%)
Data Table on Spain - Year-over-year growth 2025-2030 (%)

13.4.6 The Netherlands - Market size and forecast 2025-2030

Chart on The Netherlands - Market size and forecast 2025-2030 ($ million)
Data Table on The Netherlands - Market size and forecast 2025-2030 ($ million)
Chart on The Netherlands - Year-over-year growth 2025-2030 (%)
Data Table on The Netherlands - Year-over-year growth 2025-2030 (%)

13.5 APAC - Market size and forecast 2025-2030

Chart on APAC - Market size and forecast 2025-2030 ($ million)
Data Table on APAC - Market size and forecast 2025-2030 ($ million)
Chart on APAC - Year-over-year growth 2025-2030 (%)
Data Table on APAC - Year-over-year growth 2025-2030 (%)
Chart on Regional Comparison - APAC
Data Table on Regional Comparison - APAC

13.5.1 China - Market size and forecast 2025-2030

Chart on China - Market size and forecast 2025-2030 ($ million)
Data Table on China - Market size and forecast 2025-2030 ($ million)
Chart on China - Year-over-year growth 2025-2030 (%)
Data Table on China - Year-over-year growth 2025-2030 (%)

13.5.2 Japan - Market size and forecast 2025-2030

Chart on Japan - Market size and forecast 2025-2030 ($ million)
Data Table on Japan - Market size and forecast 2025-2030 ($ million)
Chart on Japan - Year-over-year growth 2025-2030 (%)
Data Table on Japan - Year-over-year growth 2025-2030 (%)

13.5.3 India - Market size and forecast 2025-2030

Chart on India - Market size and forecast 2025-2030 ($ million)
Data Table on India - Market size and forecast 2025-2030 ($ million)
Chart on India - Year-over-year growth 2025-2030 (%)
Data Table on India - Year-over-year growth 2025-2030 (%)

13.5.4 South Korea - Market size and forecast 2025-2030

Chart on South Korea - Market size and forecast 2025-2030 ($ million)
Data Table on South Korea - Market size and forecast 2025-2030 ($ million)
Chart on South Korea - Year-over-year growth 2025-2030 (%)
Data Table on South Korea - Year-over-year growth 2025-2030 (%)

13.5.5 Australia - Market size and forecast 2025-2030

Chart on Australia - Market size and forecast 2025-2030 ($ million)
Data Table on Australia - Market size and forecast 2025-2030 ($ million)
Chart on Australia - Year-over-year growth 2025-2030 (%)
Data Table on Australia - Year-over-year growth 2025-2030 (%)

13.5.6 Indonesia - Market size and forecast 2025-2030

Chart on Indonesia - Market size and forecast 2025-2030 ($ million)
Data Table on Indonesia - Market size and forecast 2025-2030 ($ million)
Chart on Indonesia - Year-over-year growth 2025-2030 (%)
Data Table on Indonesia - Year-over-year growth 2025-2030 (%)

13.6 South America - Market size and forecast 2025-2030

Chart on South America - Market size and forecast 2025-2030 ($ million)
Data Table on South America - Market size and forecast 2025-2030 ($ million)
Chart on South America - Year-over-year growth 2025-2030 (%)
Data Table on South America - Year-over-year growth 2025-2030 (%)
Chart on Regional Comparison - South America
Data Table on Regional Comparison - South America

13.6.1 Brazil - Market size and forecast 2025-2030

Chart on Brazil - Market size and forecast 2025-2030 ($ million)
Data Table on Brazil - Market size and forecast 2025-2030 ($ million)
Chart on Brazil - Year-over-year growth 2025-2030 (%)
Data Table on Brazil - Year-over-year growth 2025-2030 (%)

13.6.2 Argentina - Market size and forecast 2025-2030

Chart on Argentina - Market size and forecast 2025-2030 ($ million)
Data Table on Argentina - Market size and forecast 2025-2030 ($ million)
Chart on Argentina - Year-over-year growth 2025-2030 (%)
Data Table on Argentina - Year-over-year growth 2025-2030 (%)

13.6.3 Chile - Market size and forecast 2025-2030

Chart on Chile - Market size and forecast 2025-2030 ($ million)
Data Table on Chile - Market size and forecast 2025-2030 ($ million)
Chart on Chile - Year-over-year growth 2025-2030 (%)
Data Table on Chile - Year-over-year growth 2025-2030 (%)

13.7 Middle East and Africa - Market size and forecast 2025-2030

Chart on Middle East and Africa - Market size and forecast 2025-2030 ($ million)
Data Table on Middle East and Africa - Market size and forecast 2025-2030 ($ million)
Chart on Middle East and Africa - Year-over-year growth 2025-2030 (%)
Data Table on Middle East and Africa - Year-over-year growth 2025-2030 (%)
Chart on Regional Comparison - Middle East and Africa
Data Table on Regional Comparison - Middle East and Africa

13.7.1 Saudi Arabia - Market size and forecast 2025-2030

Chart on Saudi Arabia - Market size and forecast 2025-2030 ($ million)
Data Table on Saudi Arabia - Market size and forecast 2025-2030 ($ million)
Chart on Saudi Arabia - Year-over-year growth 2025-2030 (%)
Data Table on Saudi Arabia - Year-over-year growth 2025-2030 (%)

13.7.2 UAE - Market size and forecast 2025-2030

Chart on UAE - Market size and forecast 2025-2030 ($ million)
Data Table on UAE - Market size and forecast 2025-2030 ($ million)
Chart on UAE - Year-over-year growth 2025-2030 (%)
Data Table on UAE - Year-over-year growth 2025-2030 (%)

13.7.3 South Africa - Market size and forecast 2025-2030

Chart on South Africa - Market size and forecast 2025-2030 ($ million)
Data Table on South Africa - Market size and forecast 2025-2030 ($ million)
Chart on South Africa - Year-over-year growth 2025-2030 (%)
Data Table on South Africa - Year-over-year growth 2025-2030 (%)

13.7.4 Israel - Market size and forecast 2025-2030

Chart on Israel - Market size and forecast 2025-2030 ($ million)
Data Table on Israel - Market size and forecast 2025-2030 ($ million)
Chart on Israel - Year-over-year growth 2025-2030 (%)
Data Table on Israel - Year-over-year growth 2025-2030 (%)

13.7.5 Turkey - Market size and forecast 2025-2030

Chart on Turkey - Market size and forecast 2025-2030 ($ million)
Data Table on Turkey - Market size and forecast 2025-2030 ($ million)
Chart on Turkey - Year-over-year growth 2025-2030 (%)
Data Table on Turkey - Year-over-year growth 2025-2030 (%)

13.8 Market opportunity by geography

Market opportunity by geography ($ million)
Data Tables on Market opportunity by geography ($ million)

14. Drivers, Challenges, and Opportunity

14.1 Market drivers

Rising rates of pet humanization and urbanization
Proliferation of eco-friendly and biodegradable substrates
Technological integration and advanced product innovation

14.2 Market challenges

Raw material price volatility and supply chain disruptions
Environmental concerns associated with mining and disposal
Feline physiological rejection and material sensitivity

14.3 Impact of drivers and challenges

Impact of drivers and challenges in 2025 and 2030

14.4 Market opportunities

Expansion of sustainable and eco-friendly substrates
Integration of smart technologies and health-monitoring ecosystems
Growth of DTC subscription models and digital commerce

15. Competitive Landscape

15.1 Overview

15.2

Overview on criticality of inputs and factors of differentiation

15.3 Landscape disruption

Overview on factors of disruption

15.4 Industry risks

Impact of key risks on business

16. Competitive Analysis

16.1 Companies profiled

Companies covered

16.2 Company ranking index

16.3 Market positioning of companies

Matrix on companies position and classification

16.4 Church and Dwight Co. Inc.

Church and Dwight Co. Inc. - Overview
Church and Dwight Co. Inc. - Business segments
Church and Dwight Co. Inc. - Key offerings
Church and Dwight Co. Inc. - Segment focus
SWOT

16.5 Dr. Elseys

Dr. Elseys - Overview
Dr. Elseys - Product / Service
Dr. Elseys - Key offerings
SWOT

16.6 Intersand Group

Intersand Group - Overview
Intersand Group - Product / Service
Intersand Group - Key offerings
SWOT

16.7 J. Rettenmaier and Sohne Group

J. Rettenmaier and Sohne Group - Overview
J. Rettenmaier and Sohne Group - Product / Service
J. Rettenmaier and Sohne Group - Key offerings
SWOT

16.8 Kao Corp.

Kao Corp. - Overview
Kao Corp. - Business segments
Kao Corp. - Key news
Kao Corp. - Key offerings
Kao Corp. - Segment focus
SWOT

16.9 Kent Corp.

Kent Corp. - Overview
Kent Corp. - Product / Service
Kent Corp. - Key offerings
SWOT

16.10 Mars Inc.

Mars Inc. - Overview
Mars Inc. - Product / Service
Mars Inc. - Key offerings
SWOT

16.11 Minerals Technologies Inc.

Minerals Technologies Inc. - Overview
Minerals Technologies Inc. - Business segments
Minerals Technologies Inc. - Key offerings
Minerals Technologies Inc. - Segment focus
SWOT

16.12 Nestle Purina PetCare Co.

Nestle Purina PetCare Co. - Overview
Nestle Purina PetCare Co. - Product / Service
Nestle Purina PetCare Co. - Key offerings
SWOT

16.13 Oil Dri Corp. of America

Oil Dri Corp. of America - Overview
Oil Dri Corp. of America - Business segments
Oil Dri Corp. of America - Key offerings
Oil Dri Corp. of America - Segment focus
SWOT

16.14 Pettex Ltd.

Pettex Ltd. - Overview
Pettex Ltd. - Product / Service
Pettex Ltd. - Key offerings
SWOT

16.15 Pioneer Pet Products LLC

Pioneer Pet Products LLC - Overview
Pioneer Pet Products LLC - Product / Service
Pioneer Pet Products LLC - Key offerings
SWOT

16.16 Spectrum Brands Inc.

Spectrum Brands Inc. - Overview
Spectrum Brands Inc. - Business segments
Spectrum Brands Inc. - Key offerings
Spectrum Brands Inc. - Segment focus
SWOT

16.17 The Clorox Co.

The Clorox Co. - Overview
The Clorox Co. - Business segments
The Clorox Co. - Key offerings
The Clorox Co. - Segment focus
SWOT

16.18 TOLSA SA

TOLSA SA - Overview
TOLSA SA - Product / Service
TOLSA SA - Key offerings
SWOT

17. Appendix

17.1 Scope of the report

Market definition
Objectives
Notes and caveats

17.2 Inclusions and exclusions checklist

Inclusions checklist
Exclusions checklist

17.3 Currency conversion rates for US$

17.4 Research methodology

17.5 Data procurement

Information sources

17.6 Data validation

17.7 Validation techniques employed for market sizing

17.8 Data synthesis

17.9 360 degree market analysis

17.10 List of abbreviations

Research Methodology

Technavio presents a detailed picture of the market by way of study, synthesis, and summation of data from multiple sources. The analysts have presented the various facets of the market with a particular focus on identifying the key industry influencers. The data thus presented is comprehensive, reliable, and the result of extensive research, both primary and secondary.

INFORMATION SOURCES

Primary sources

  • Manufacturers and suppliers
  • Channel partners
  • Industry experts
  • Strategic decision makers

Secondary sources

  • Industry journals and periodicals
  • Government data
  • Financial reports of key industry players
  • Historical data
  • Press releases

DATA ANALYSIS

Data Synthesis

  • Collation of data
  • Estimation of key figures
  • Analysis of derived insights

Data Validation

  • Triangulation with data models
  • Reference against proprietary databases
  • Corroboration with industry experts

REPORT WRITING

Qualitative

  • Market drivers
  • Market challenges
  • Market trends
  • Five forces analysis

Quantitative

  • Market size and forecast
  • Market segmentation
  • Geographical insights
  • Competitive landscape

Interested in this report?

Get your sample now to see our research methodology and insights!

Download Now

Frequently Asked Questions

Cat Litter market growth will increase by USD 2987.6 million during 2026-2030.

The Cat Litter market is expected to grow at a CAGR of 5.9% during 2026-2030.

Cat Litter market is segmented by Product (Clumping, Conventional) Distribution channel (Offline, Online) Raw material (Clay, Silica, Biodegradable materials) Type (Scented, Unscented)

Boxiecat LLC, Catalyst Pet, Church and Dwight Co. Inc., Dr. Elseys, Healthy Pet L.P., Intersand Group, J. Rettenmaier and Sohne Group, Kao Corp., Kent Corp., Mars Inc., Minerals Technologies Inc., Nestle Purina PetCare Co., Oil Dri Corp. of America, Pettex Ltd., Pioneer Pet Products LLC, PrettyLitter, Spectrum Brands Inc., The Clorox Co., TOLSA SA, ZOLUX SAS are a few of the key vendors in the Cat Litter market.

North America will register the highest growth rate of 35% among the other regions. Therefore, the Cat Litter market in North America is expected to garner significant business opportunities for the vendors during the forecast period.

US, Canada, Mexico, Germany, UK, France, Italy, Spain, The Netherlands, China, Japan, India, South Korea, Australia, Indonesia, Brazil, Argentina, Chile, Saudi Arabia, UAE, South Africa, Israel, Turkey

  • Rising rates of pet humanization and urbanization is the driving factor this market.

The Cat Litter market vendors should focus on grabbing business opportunities from the Product segment as it accounted for the largest market share in the base year.
RIA - Research AI Assistant
Ask RIA
