
Central Fill Pharmacy Automation Market Analysis, Size, and Forecast 2026-2030: North America (US, Canada, and Mexico), Europe (Germany, UK, and France), APAC (China, Japan, and India), South America (Brazil, Argentina, and Chile), Middle East and Africa (Saudi Arabia, UAE, and South Africa), and Rest of World (ROW)

Central Fill Pharmacy Automation Market Analysis, Size, and Forecast 2026-2030:
North America (US, Canada, and Mexico), Europe (Germany, UK, and France), APAC (China, Japan, and India), South America (Brazil, Argentina, and Chile), Middle East and Africa (Saudi Arabia, UAE, and South Africa), and Rest of World (ROW)

Published: Oct 2026 291 Pages SKU: IRTNTR74964

Market Overview at a Glance

$915.46 Mn
Market Opportunity
15.4%
CAGR 2025 - 2030
41.7%
North America Growth
$484.49 Mn
Inpatient pharmacy segment 2024

Central Fill Pharmacy Automation Market Size 2026-2030

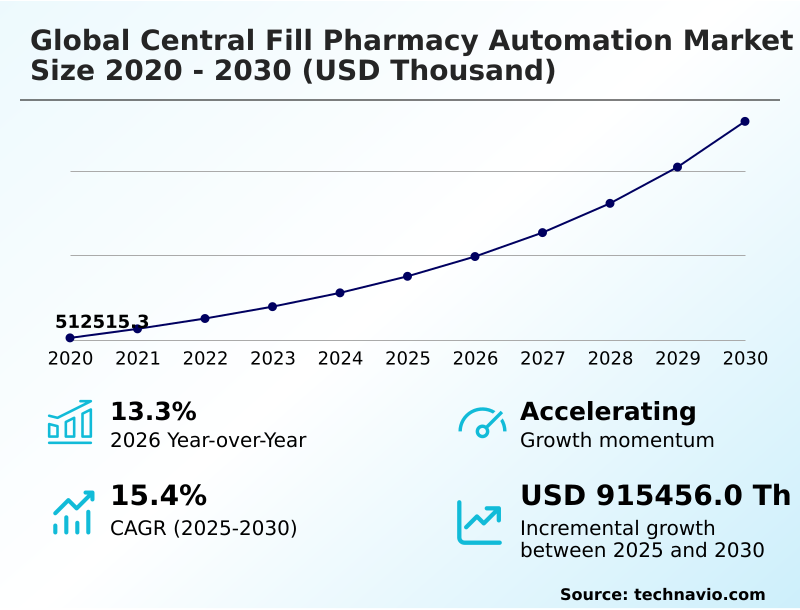
The central fill pharmacy automation market size is valued to increase by USD 915.46 million, at a CAGR of 15.4% from 2025 to 2030. Drivers addressing persistent pharmacy labor shortages will drive the central fill pharmacy automation market.

Major Market Trends & Insights

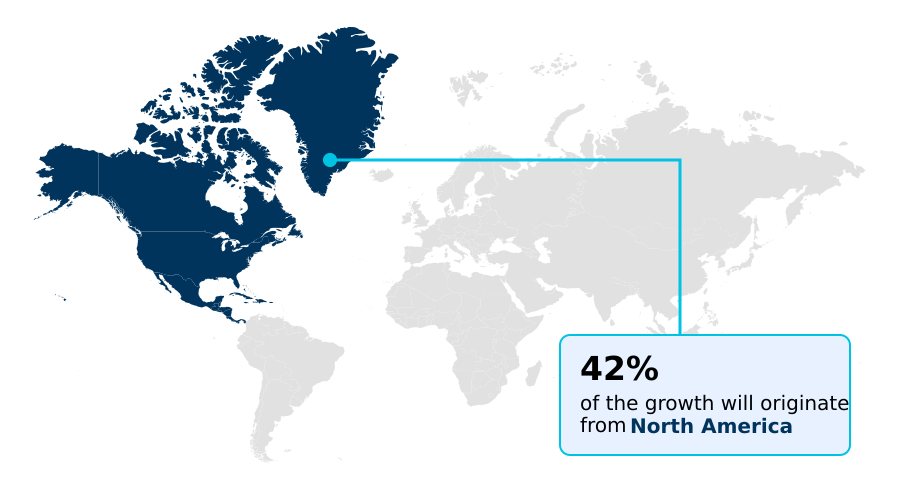
  • North America dominated the market and accounted for a 41.7% growth during the forecast period.
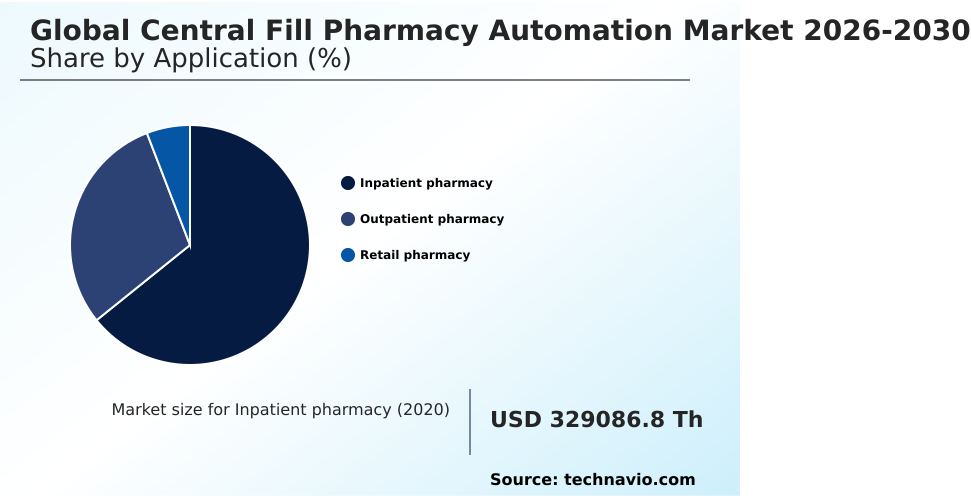
  • By Application - Inpatient pharmacy segment was valued at USD 484.49 million in 2024
  • By Type - Equipment segment accounted for the largest market revenue share in 2024

Market Size & Forecast

  • Market Opportunities:
  • Market Future Opportunities: USD 915.46 million
  • CAGR from 2025 to 2030 : 15.4%

Market Summary

  • The Central Fill Pharmacy Automation Market functions as a critical infrastructure layer for modern healthcare logistics, fundamentally altering how prescriptions are processed and distributed. Large-scale retail chains and hospital networks are aggressively transitioning from localized dispensing to centralized, industrial-scale fulfillment hubs.
  • In a practical supply chain scenario, a regional health system consolidated its prescription processing into a single automated facility, enabling clinical staff to redirect their focus toward patient counseling and therapy management. This strategic consolidation typically yields a 40% reduction in manual processing time, significantly optimizing labor utilization.
  • The acute scarcity of skilled pharmacy technicians acts as the primary driver accelerating this transition, forcing organizations to decouple prescription output from human headcount. Conversely, the substantial upfront capital expenditure required for facility retrofitting, robotic procurement, and software integration presents a formidable challenge, particularly for mid-sized operators struggling with compressed operating margins.
  • These automated hubs rely on sophisticated inventory management algorithms to minimize medication waste and ensure consistent stock availability. Consequently, high-volume automated fulfillment has evolved from an operational luxury to an absolute necessity for survival.

What will be the Size of the Central Fill Pharmacy Automation Market during the forecast period?
Get Key Insights on Market Forecast (PDF) Get Free Sample

How is the Central Fill Pharmacy Automation Market Segmented?

The central fill pharmacy automation industry research report provides comprehensive data (region-wise segment analysis), with forecasts and estimates in "USD thousand" for the period 2026-2030, as well as historical data from 2020-2024 for the following segments.

  • Application
    • Inpatient pharmacy
    • Outpatient pharmacy
    • Retail pharmacy
  • Type
    • Equipment
    • Services
  • Product type
    • Robotic dispensing systems
    • Automated medication storage systems
    • Barcode scanning systems
    • Others
  • Geography
    • North America
      • US
      • Canada
      • Mexico
    • Europe
      • Germany
      • UK
      • France
      • Italy
      • Spain
      • The Netherlands
    • APAC
      • China
      • Japan
      • India
      • South Korea
      • Australia
      • Indonesia
    • South America
      • Brazil
      • Argentina
      • Chile
    • Middle East and Africa
      • Saudi Arabia
      • UAE
      • South Africa
      • Israel
      • Turkey

By Application Insights

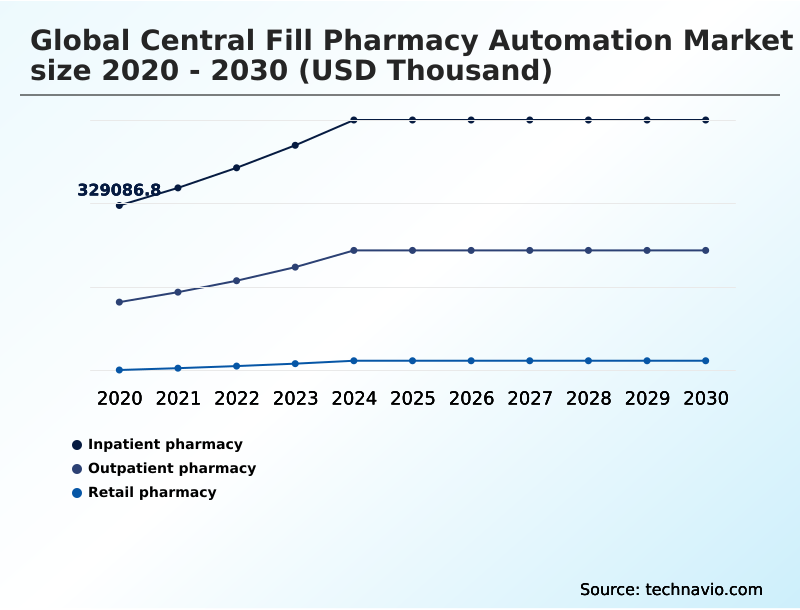
The inpatient pharmacy segment is estimated to witness significant growth during the forecast period.

Inpatient pharmacy environments operate as the critical nerve center for high-acuity medication administration. Hospitals are rapidly integrating sterile compounding robotics and vision-based inspection systems to decouple mechanical tasks from direct clinical care.

This transition mitigates workforce constraints while aligning with value-based care alignment frameworks. By leveraging cloud-based pharmacy analytics alongside IoT-enabled sensor networks, inpatient facilities achieve real-time inventory oversight, drastically minimizing stockouts of critical therapies.

The implementation of specialized sterile-handling protocols within these automated frameworks has demonstrably improved safety profiles, with medication error detection rates improving by an estimated 15% across early adopter networks.

Administrators also utilize advanced pharmacy management software to transition toward pay-per-script billing models, optimizing capital expenditures. Predictive hardware maintenance ensures continuous operation, allowing clinical pharmacists to prioritize patient outcomes over routine dispensing logistics.
Get Free Sample

The Inpatient pharmacy segment was valued at USD 484.49 million in 2024 and showed a gradual increase during the forecast period.
Get Free Sample

Regional Analysis

North America is estimated to contribute 41.7% to the growth of the global market during the forecast period.Technavio’s analysts have elaborately explained the regional trends and drivers that shape the market during the forecast period.
See How Central Fill Pharmacy Automation Market Demand is Rising in North America Get Free Sample

The Central Fill Pharmacy Automation landscape exhibits distinct regional variations driven by differing healthcare infrastructure priorities and labor availability.

North America leads the transition toward intelligent warehouse orchestration, achieving a 35% higher adoption rate of fully automated hubs compared to Europe due to severe technician shortages.

In contrast, European operators prioritize modular high-density storage retrieval systems to navigate stricter space constraints. The integration of automated sortation conveyors and secure medication tracking enables enterprise-wide distribution networks to function with unprecedented precision.

By deploying telepharmacy integration modules, organizations facilitate decentralized point-of-care delivery without sacrificing centralized efficiency. Furthermore, automated compliance packaging solutions are standardizing medication adherence programs across both regions.

Ultimately, pharmacist workflow optimization remains the universal objective, as industrial-scale automation yields a 25% reduction in fulfillment errors globally.

Market Dynamics

Our researchers analyzed the data with 2025 as the base year, along with the key drivers, trends, and challenges. A holistic analysis of drivers will help companies refine their marketing strategies to gain a competitive advantage.

  • The architectural framework of modern pharmaceutical distribution is undergoing a radical transformation, heavily reliant on automated high speed prescription dispensing systems to manage unprecedented prescription volumes. As labor constraints tighten, health systems are deploying robotic centralized pharmacy distribution systems to decouple operational throughput from human resource availability.
  • This centralization strategy allows organizations to process prescriptions at a scale that dwarfs traditional retail storefront capabilities, often achieving a 3-to-1 efficiency ratio when comparing centralized hubs to localized manual dispensing.
  • At the core of this operational pivot is the implementation of AI integrated barcode medication verification, which virtually eliminates human counting errors and ensures absolute compliance with stringent safety protocols. Supply chain managers are increasingly relying on cloud based pharmacy inventory analytics to orchestrate stock levels across vast geographical networks, predicting demand fluctuations and preventing costly stockouts of critical therapies.
  • Furthermore, the integration of modular robotic pill counting machinery provides facilities with the agility to scale their operations incrementally, aligning capital expenditure directly with volume growth. By shifting the bulk of fulfillment tasks to these sophisticated hubs, organizations can redirect clinical personnel toward high-value patient care initiatives, fundamentally redefining the economics of pharmacy operations.
  • This systemic evolution ensures that the delivery of life-saving medications remains resilient, accurate, and economically sustainable despite mounting external pressures.
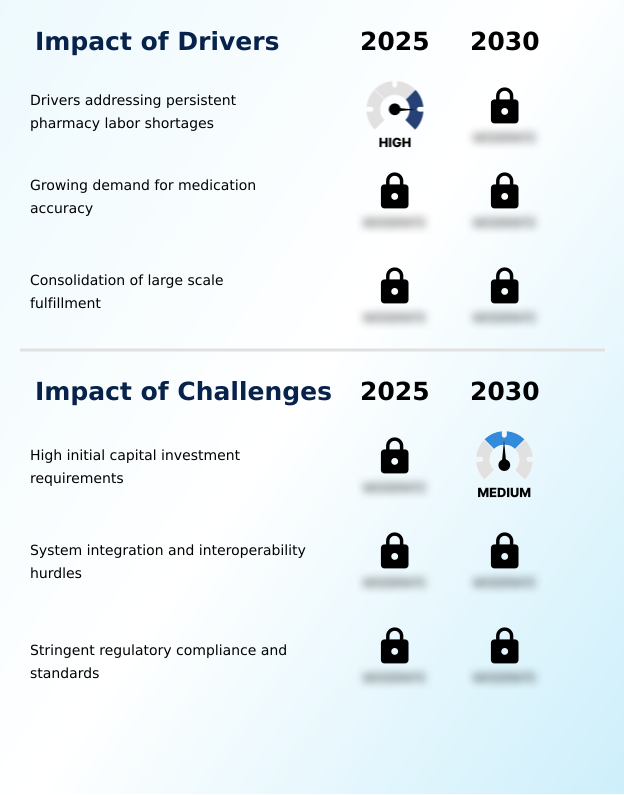
What are the key market drivers leading to the rise in the adoption of Central Fill Pharmacy Automation Industry?

  • The implementation of automated systems addressing persistent pharmacy labor shortages functions as the primary driver propelling sustained market expansion.

  • Severe workforce shortages are forcing healthcare networks to rethink pharmaceutical inventory management by heavily investing in automated pill counting and sorting technologies.
  • The pressing need for workforce burnout mitigation acts as a primary catalyst, pushing organizations to deploy robotic picking algorithms that operate continuously. By offloading mechanical tasks, pharmacies achieve a 25% improvement in prescription turnaround time.
  • The integration of medication compliance packaging machinery ensures accurate dosing for chronic care patients, effectively elevating dispensing accuracy metrics. Furthermore, utilizing pneumatic tube transport within these hubs streamlines internal logistics, resulting in a 15% operational overhead reduction.
  • These systems automatically generate comprehensive regulatory compliance audit trails, shielding organizations from liability while ensuring that high-speed fulfillment environments maintain uncompromised safety standards.

What are the market trends shaping the Central Fill Pharmacy Automation Industry?

  • The escalating demand for pharmacy workflow efficiency is emerging as a critical trend shaping the industry landscape. Organizations are prioritizing seamless operational throughput to mitigate manual processing bottlenecks and enhance service delivery.

  • The paradigm of pharmaceutical distribution is shifting decisively toward highly integrated robotic dispensing systems capable of autonomous operation. Driven by the critical need for patient adherence tracking and error elimination, organizations are constructing sophisticated centralized fulfillment hubs. This structural shift allows clinical pharmacy services and medication therapy management to expand rapidly, as repetitive tasks are removed from retail settings.
  • By deploying unit-dose packaging modules alongside advanced barcode verification technology, facilities report a 22% improvement in medication dispensing accuracy. This technological adoption enables high-volume prescription processing without proportional increases in human headcount. The establishment of a resilient pharmaceutical logistics infrastructure ensures that complex therapies reach patients reliably.
  • Consequently, automated medication storage systems optimize floor space utilization by up to 30%, directly enhancing the operational capacity of regional distribution networks while maintaining rigorous quality control standards.

What challenges does the Central Fill Pharmacy Automation Industry face during its growth?

  • High initial capital investment requirements for sophisticated robotic infrastructure pose a significant challenge constraining widespread adoption among smaller organizations.

  • The transition to centralized automation is severely constrained by the complex integration of prescription routing software with legacy hospital networks. Achieving seamless cross-facility data synchronization requires substantial structural overhauls, often delaying deployment timelines by up to 20% and hindering immediate medication error reduction goals.
  • Furthermore, managing specialty drug cold-chain handling within high-speed robotic environments introduces rigorous climate-control dependencies that complicate facility design. To maintain continuous operational resilience, organizations must invest heavily in modular hardware scalability, which strains initial capital budgets. While automated labeling systems and predictive inventory forecasting modules are essential for maximizing prescription fulfillment throughput, their implementation demands extensive staff retraining.
  • These systemic hurdles result in a 15% increase in upfront integration costs, forcing mid-sized pharmacy chains to carefully evaluate the financial feasibility of adopting comprehensive high-acuity care coordination infrastructure.

Exclusive Technavio Analysis on Customer Landscape

The central fill pharmacy automation market forecasting report includes the adoption lifecycle of the market, covering from the innovator’s stage to the laggard’s stage. It focuses on adoption rates in different regions based on penetration. Furthermore, the central fill pharmacy automation market report also includes key purchase criteria and drivers of price sensitivity to help companies evaluate and develop their market growth analysis strategies.
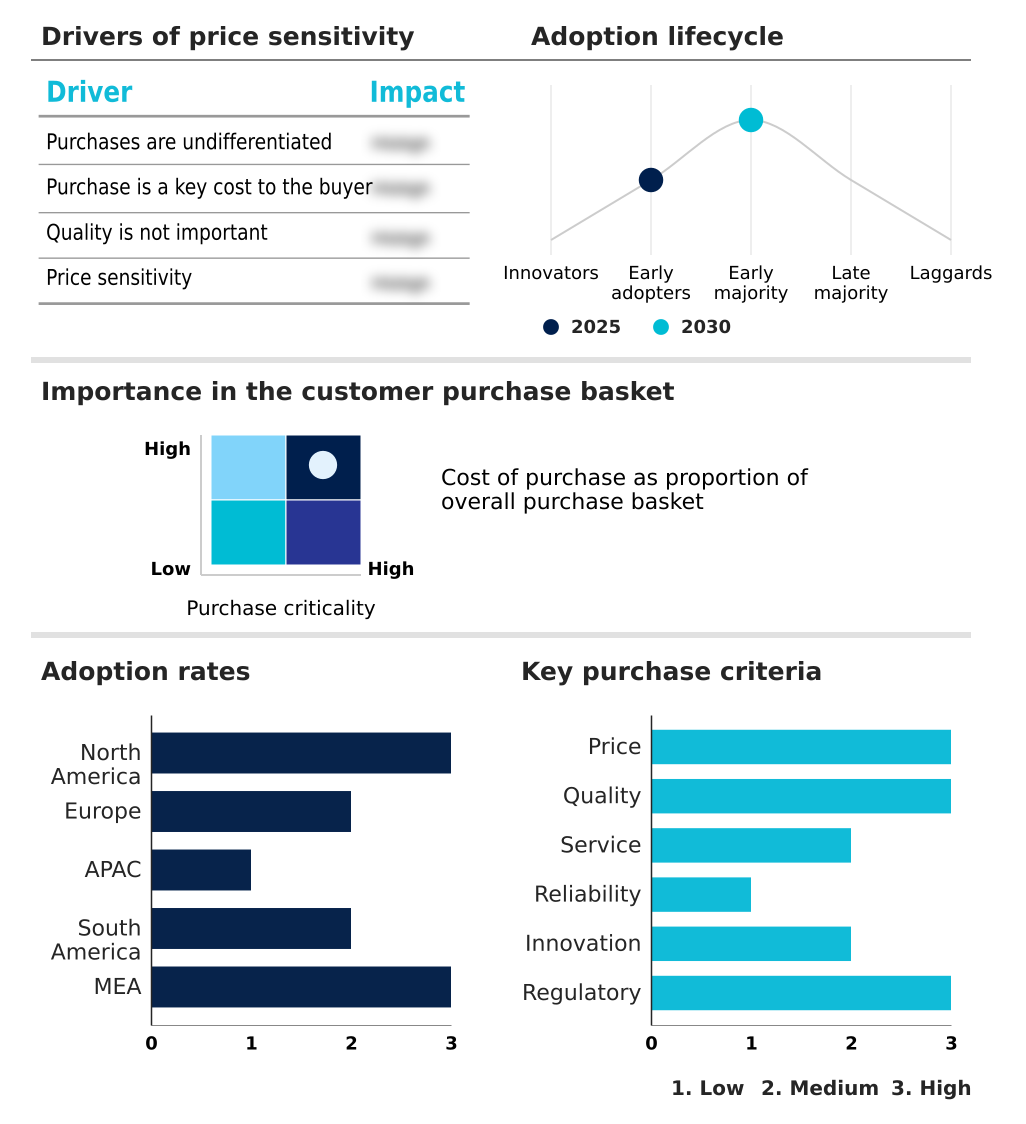
Customer Landscape of Central Fill Pharmacy Automation Industry

Competitive Landscape

Companies are implementing various strategies, such as strategic alliances, central fill pharmacy automation market forecast, partnerships, mergers and acquisitions, geographical expansion, and product/service launches, to enhance their presence in the industry.

Baxter International Inc. - The company delivers advanced robotic systems supporting automated medication preparation, dispensing, and inventory control to enhance the precision and operational efficiency of centralized prescription fulfillment facilities.

The industry research and growth report includes detailed analyses of the competitive landscape of the market and information about key companies, including:

  • Baxter International Inc.
  • Becton Dickinson and Co.
  • Capsa Healthcare LLC
  • Cornerstone Automation Systems
  • Gollmann Kommissioniersysteme
  • Innovation Associates
  • KNAPP AG
  • KUKA AG
  • McKesson Corp.
  • Omnicell Inc.
  • Pearson Medical Technologies LLC
  • Quality Manufacturing Systems
  • RoboPharma
  • Rxsafe LLC
  • ScriptPro LLC
  • Sinteco
  • Swisslog Healthcare AG
  • Takazono Corp
  • Tension Packaging and Automation
  • YUYAMA Co. Ltd.

Qualitative and quantitative analysis of companies has been conducted to help clients understand the wider business environment as well as the strengths and weaknesses of key industry players. Data is qualitatively analyzed to categorize companies as pure play, category-focused, industry-focused, and diversified; it is quantitatively analyzed to categorize companies as dominant, leading, strong, tentative, and weak.

Recent Development and News in Central fill pharmacy automation market

  • In the Health Care Technology industry, the implementation of the Drug Supply Chain Security Act mandated advanced track-and-trace interoperability, directly impacting Central Fill Pharmacy Automation demand by accelerating the adoption of high-speed barcode scanning systems that improve compliance accuracy by up to 25%.
  • The shift toward cloud-based workflow interoperability in enterprise health networks facilitated seamless data exchange across multi-site facilities, increasing the deployment of automated fulfillment infrastructure capable of processing over 50,000 prescriptions daily across the United States.
  • Advancements in AI-driven robotic vision algorithms optimized the handling of diverse packaging formats, significantly reducing mechanical sorting errors and driving a 15% increase in the throughput capacity of automated dispensing hubs in APAC.
  • Stringent data privacy regulations including GDPR prompted the development of secure, on-premise edge computing modules within medical logistics software, enabling high-volume centralized facilities in the UK and Germany to maintain continuous operation while ensuring strict patient data protection.

Dive into Technavio’s robust research methodology, blending expert interviews, extensive data synthesis, and validated models for unparalleled Central Fill Pharmacy Automation Market insights. See full methodology.

Market Scope
Page number 291
Base year 2025
Historic period 2020-2024
Forecast period 2026-2030
Growth momentum & CAGR Accelerate at a CAGR of 15.4%
Market growth 2026-2030 USD 915456.0 thousand
Market structure Fragmented
YoY growth 2025-2026(%) 13.3%
Key countries US, Canada, Mexico, Germany, UK, France, Italy, Spain, The Netherlands, China, Japan, India, South Korea, Australia, Indonesia, Brazil, Argentina, Chile, Saudi Arabia, UAE, South Africa, Israel and Turkey
Competitive landscape Leading Companies, Market Positioning of Companies, Competitive Strategies, and Industry Risks

Request Free Sample

Research Analyst Overview

  • The Central Fill Pharmacy Automation sector is fundamentally reshaping the operational blueprints of major healthcare networks. Executives are increasingly treating pharmaceutical inventory management not merely as a logistical necessity, but as a core component of enterprise risk mitigation and compliance strategy. The rapid integration of sophisticated robotic dispensing systems allows organizations to decouple prescription throughput from volatile labor markets.
  • By transitioning to automated medication storage frameworks, boardroom leaders can enforce standardized safety protocols across diverse retail portfolios. This strategic pivot typically yields a 30% reduction in workflow bottlenecks, significantly enhancing overall service reliability. The deployment of barcode verification technology ensures absolute precision in medication sorting, directly addressing stringent regulatory mandates for patient safety.
  • Concurrently, investments in automated pill counting and pneumatic tube transport mechanisms streamline the physical movement of drugs within massive fulfillment centers. These targeted technological upgrades empower organizations to maintain continuous operational resilience, transforming backend logistics into a distinct competitive advantage while optimizing long-term capital allocation strategies.

What are the Key Data Covered in this Central Fill Pharmacy Automation Market Research and Growth Report?

  • What is the expected growth of the Central Fill Pharmacy Automation Market between 2026 and 2030?

    • USD 915.46 million, at a CAGR of 15.4%

  • What segmentation does the market report cover?

    • The report is segmented by Application (Inpatient pharmacy, Outpatient pharmacy, and Retail pharmacy), Type (Equipment, and Services), Product Type (Robotic dispensing systems, Automated medication storage systems, Barcode scanning systems, and Others) and Geography (North America, Europe, APAC, South America, Middle East and Africa)

  • Which regions are analyzed in the report?

    • North America, Europe, APAC, South America and Middle East and Africa

  • What are the key growth drivers and market challenges?

    • Drivers addressing persistent pharmacy labor shortages, High initial capital investment requirements

  • Who are the major players in the Central Fill Pharmacy Automation Market?

    • Baxter International Inc., Becton Dickinson and Co., Capsa Healthcare LLC, Cornerstone Automation Systems, Gollmann Kommissioniersysteme, Innovation Associates, KNAPP AG, KUKA AG, McKesson Corp., Omnicell Inc., Pearson Medical Technologies LLC, Quality Manufacturing Systems, RoboPharma, Rxsafe LLC, ScriptPro LLC, Sinteco, Swisslog Healthcare AG, Takazono Corp, Tension Packaging and Automation and YUYAMA Co. Ltd.

Market Research Insights

  • The Central Fill Pharmacy Automation Market is transforming healthcare logistics by replacing manual dispensing with high-efficiency centralized fulfillment hubs. This evolution is driven by the necessity to optimize prescription turnaround time and mitigate operational bottlenecks. Facilities leveraging industrial-scale automation report up to a 30% improvement in processing speed, drastically enhancing dispensing accuracy metrics.
  • By automating repetitive tasks, organizations achieve significant operational overhead reduction while facilitating robust medication therapy management initiatives. Furthermore, the integration of enterprise-wide distribution networks allows pharmacies to synchronize inventory data seamlessly. These systemic upgrades enable a 20% decrease in inventory holding costs, ensuring continuous product availability while empowering clinical staff to focus on direct patient care.

We can help! Our analysts can customize this central fill pharmacy automation market research report to meet your requirements.

Get in touch

1. Executive Summary

1.1 Market overview

Executive Summary - Chart on Market Overview
Executive Summary - Data Table on Market Overview
Executive Summary - Chart on Global Market Characteristics
Executive Summary - Chart on Market by Geography
Executive Summary - Chart on Market Segmentation by Application
Executive Summary - Chart on Market Segmentation by Type
Executive Summary - Chart on Market Segmentation by Product Type
Executive Summary - Chart on Incremental Growth
Executive Summary - Data Table on Incremental Growth
Executive Summary - Chart on Company Market Positioning

2. Technavio Analysis

2.1 Analysis of price sensitivity, lifecycle, customer purchase basket, adoption rates, and purchase criteria

2.2 Criticality of inputs and Factors of differentiation

Chart on Overview on criticality of inputs and factors of differentiation

2.3 Factors of disruption

Chart on Overview on factors of disruption

2.4 Impact of drivers and challenges

Chart on Impact of drivers and challenges in 2025 and 2030

3. Market Landscape

3.1 Market ecosystem

Chart on Parent Market
Data Table on - Parent Market

3.2 Market characteristics

Chart on Market characteristics analysis

3.3 Value chain analysis

Chart on Value chain analysis

4. Market Sizing

4.1 Market definition

Data Table on Offerings of companies included in the market definition

4.2 Market segment analysis

Market segments

4.3 Market size 2025

4.4 Market outlook: Forecast for 2025-2030

Chart on Global - Market size and forecast 2025-2030 ($ thousand)
Data Table on Global - Market size and forecast 2025-2030 ($ thousand)
Chart on Global Market: Year-over-year growth 2025-2030 (%)
Data Table on Global Market: Year-over-year growth 2025-2030 (%)

5. Historic Market Size

5.1 Global Central Fill Pharmacy Automation Market 2020 - 2024

Historic Market Size - Data Table on Global Central Fill Pharmacy Automation Market 2020 - 2024 ($ thousand)

5.2 Application segment analysis 2020 - 2024

Historic Market Size - Application Segment 2020 - 2024 ($ thousand)

5.3 Type segment analysis 2020 - 2024

Historic Market Size - Type Segment 2020 - 2024 ($ thousand)

5.4 Product Type segment analysis 2020 - 2024

Historic Market Size - Product Type Segment 2020 - 2024 ($ thousand)

5.5 Geography segment analysis 2020 - 2024

Historic Market Size - Geography Segment 2020 - 2024 ($ thousand)

5.6 Country segment analysis 2020 - 2024

Historic Market Size - Country Segment 2020 - 2024 ($ thousand)

6. Qualitative Analysis

6.1 Impact of AI on Global Central Fill Pharmacy Automation Market

6.2 Impact of geopolitical conflicts on Global Central Fill Pharmacy Automation Market

7. Five Forces Analysis

7.1 Five forces summary

Five forces analysis - Comparison between 2025 and 2030

7.2 Bargaining power of buyers

Bargaining power of buyers - Impact of key factors 2025 and 2030

7.3 Bargaining power of suppliers

Bargaining power of suppliers - Impact of key factors in 2025 and 2030

7.4 Threat of new entrants

Threat of new entrants - Impact of key factors in 2025 and 2030

7.5 Threat of substitutes

Threat of substitutes - Impact of key factors in 2025 and 2030

7.6 Threat of rivalry

Threat of rivalry - Impact of key factors in 2025 and 2030

7.7 Market condition

Chart on Market condition - Five forces 2025 and 2030

8. Market Segmentation by Application

8.1 Market segments

Chart on Application - Market share 2025-2030 (%)
Data Table on Application - Market share 2025-2030 (%)

8.2 Comparison by Application

Chart on Comparison by Application
Data Table on Comparison by Application

8.3 Inpatient pharmacy - Market size and forecast 2025-2030

Chart on Inpatient pharmacy - Market size and forecast 2025-2030 ($ thousand)
Data Table on Inpatient pharmacy - Market size and forecast 2025-2030 ($ thousand)
Chart on Inpatient pharmacy - Year-over-year growth 2025-2030 (%)
Data Table on Inpatient pharmacy - Year-over-year growth 2025-2030 (%)

8.4 Outpatient pharmacy - Market size and forecast 2025-2030

Chart on Outpatient pharmacy - Market size and forecast 2025-2030 ($ thousand)
Data Table on Outpatient pharmacy - Market size and forecast 2025-2030 ($ thousand)
Chart on Outpatient pharmacy - Year-over-year growth 2025-2030 (%)
Data Table on Outpatient pharmacy - Year-over-year growth 2025-2030 (%)

8.5 Retail pharmacy - Market size and forecast 2025-2030

Chart on Retail pharmacy - Market size and forecast 2025-2030 ($ thousand)
Data Table on Retail pharmacy - Market size and forecast 2025-2030 ($ thousand)
Chart on Retail pharmacy - Year-over-year growth 2025-2030 (%)
Data Table on Retail pharmacy - Year-over-year growth 2025-2030 (%)

8.6 Market opportunity by Application

Market opportunity by Application ($ thousand)
Data Table on Market opportunity by Application ($ thousand)

9. Market Segmentation by Type

9.1 Market segments

Chart on Type - Market share 2025-2030 (%)
Data Table on Type - Market share 2025-2030 (%)

9.2 Comparison by Type

Chart on Comparison by Type
Data Table on Comparison by Type

9.3 Equipment - Market size and forecast 2025-2030

Chart on Equipment - Market size and forecast 2025-2030 ($ thousand)
Data Table on Equipment - Market size and forecast 2025-2030 ($ thousand)
Chart on Equipment - Year-over-year growth 2025-2030 (%)
Data Table on Equipment - Year-over-year growth 2025-2030 (%)

9.4 Services - Market size and forecast 2025-2030

Chart on Services - Market size and forecast 2025-2030 ($ thousand)
Data Table on Services - Market size and forecast 2025-2030 ($ thousand)
Chart on Services - Year-over-year growth 2025-2030 (%)
Data Table on Services - Year-over-year growth 2025-2030 (%)

9.5 Market opportunity by Type

Market opportunity by Type ($ thousand)
Data Table on Market opportunity by Type ($ thousand)

10. Market Segmentation by Product Type

10.1 Market segments

Chart on Product Type - Market share 2025-2030 (%)
Data Table on Product Type - Market share 2025-2030 (%)

10.2 Comparison by Product Type

Chart on Comparison by Product Type
Data Table on Comparison by Product Type

10.3 Robotic dispensing systems - Market size and forecast 2025-2030

Chart on Robotic dispensing systems - Market size and forecast 2025-2030 ($ thousand)
Data Table on Robotic dispensing systems - Market size and forecast 2025-2030 ($ thousand)
Chart on Robotic dispensing systems - Year-over-year growth 2025-2030 (%)
Data Table on Robotic dispensing systems - Year-over-year growth 2025-2030 (%)

10.4 Automated medication storage systems - Market size and forecast 2025-2030

Chart on Automated medication storage systems - Market size and forecast 2025-2030 ($ thousand)
Data Table on Automated medication storage systems - Market size and forecast 2025-2030 ($ thousand)
Chart on Automated medication storage systems - Year-over-year growth 2025-2030 (%)
Data Table on Automated medication storage systems - Year-over-year growth 2025-2030 (%)

10.5 Barcode scanning systems - Market size and forecast 2025-2030

Chart on Barcode scanning systems - Market size and forecast 2025-2030 ($ thousand)
Data Table on Barcode scanning systems - Market size and forecast 2025-2030 ($ thousand)
Chart on Barcode scanning systems - Year-over-year growth 2025-2030 (%)
Data Table on Barcode scanning systems - Year-over-year growth 2025-2030 (%)

10.6 Others - Market size and forecast 2025-2030

Chart on Others - Market size and forecast 2025-2030 ($ thousand)
Data Table on Others - Market size and forecast 2025-2030 ($ thousand)
Chart on Others - Year-over-year growth 2025-2030 (%)
Data Table on Others - Year-over-year growth 2025-2030 (%)

10.7 Market opportunity by Product Type

Market opportunity by Product Type ($ thousand)
Data Table on Market opportunity by Product Type ($ thousand)

11. Customer Landscape

11.1 Customer landscape overview

Analysis of price sensitivity, lifecycle, customer purchase basket, adoption rates, and purchase criteria

12. Geographic Landscape

12.1 Geographic segmentation

Chart on Market share by geography 2025-2030 (%)
Data Table on Market share by geography 2025-2030 (%)

12.2 Geographic comparison

Chart on Geographic comparison
Data Table on Geographic comparison

12.3 North America - Market size and forecast 2025-2030

Chart on North America - Market size and forecast 2025-2030 ($ thousand)
Data Table on North America - Market size and forecast 2025-2030 ($ thousand)
Chart on North America - Year-over-year growth 2025-2030 (%)
Data Table on North America - Year-over-year growth 2025-2030 (%)
Chart on Regional Comparison - North America
Data Table on Regional Comparison - North America

12.3.1 US - Market size and forecast 2025-2030

Chart on US - Market size and forecast 2025-2030 ($ thousand)
Data Table on US - Market size and forecast 2025-2030 ($ thousand)
Chart on US - Year-over-year growth 2025-2030 (%)
Data Table on US - Year-over-year growth 2025-2030 (%)

12.3.2 Canada - Market size and forecast 2025-2030

Chart on Canada - Market size and forecast 2025-2030 ($ thousand)
Data Table on Canada - Market size and forecast 2025-2030 ($ thousand)
Chart on Canada - Year-over-year growth 2025-2030 (%)
Data Table on Canada - Year-over-year growth 2025-2030 (%)

12.3.3 Mexico - Market size and forecast 2025-2030

Chart on Mexico - Market size and forecast 2025-2030 ($ thousand)
Data Table on Mexico - Market size and forecast 2025-2030 ($ thousand)
Chart on Mexico - Year-over-year growth 2025-2030 (%)
Data Table on Mexico - Year-over-year growth 2025-2030 (%)

12.4 Europe - Market size and forecast 2025-2030

Chart on Europe - Market size and forecast 2025-2030 ($ thousand)
Data Table on Europe - Market size and forecast 2025-2030 ($ thousand)
Chart on Europe - Year-over-year growth 2025-2030 (%)
Data Table on Europe - Year-over-year growth 2025-2030 (%)
Chart on Regional Comparison - Europe
Data Table on Regional Comparison - Europe

12.4.1 Germany - Market size and forecast 2025-2030

Chart on Germany - Market size and forecast 2025-2030 ($ thousand)
Data Table on Germany - Market size and forecast 2025-2030 ($ thousand)
Chart on Germany - Year-over-year growth 2025-2030 (%)
Data Table on Germany - Year-over-year growth 2025-2030 (%)

12.4.2 UK - Market size and forecast 2025-2030

Chart on UK - Market size and forecast 2025-2030 ($ thousand)
Data Table on UK - Market size and forecast 2025-2030 ($ thousand)
Chart on UK - Year-over-year growth 2025-2030 (%)
Data Table on UK - Year-over-year growth 2025-2030 (%)

12.4.3 France - Market size and forecast 2025-2030

Chart on France - Market size and forecast 2025-2030 ($ thousand)
Data Table on France - Market size and forecast 2025-2030 ($ thousand)
Chart on France - Year-over-year growth 2025-2030 (%)
Data Table on France - Year-over-year growth 2025-2030 (%)

12.4.4 Italy - Market size and forecast 2025-2030

Chart on Italy - Market size and forecast 2025-2030 ($ thousand)
Data Table on Italy - Market size and forecast 2025-2030 ($ thousand)
Chart on Italy - Year-over-year growth 2025-2030 (%)
Data Table on Italy - Year-over-year growth 2025-2030 (%)

12.4.5 Spain - Market size and forecast 2025-2030

Chart on Spain - Market size and forecast 2025-2030 ($ thousand)
Data Table on Spain - Market size and forecast 2025-2030 ($ thousand)
Chart on Spain - Year-over-year growth 2025-2030 (%)
Data Table on Spain - Year-over-year growth 2025-2030 (%)

12.4.6 The Netherlands - Market size and forecast 2025-2030

Chart on The Netherlands - Market size and forecast 2025-2030 ($ thousand)
Data Table on The Netherlands - Market size and forecast 2025-2030 ($ thousand)
Chart on The Netherlands - Year-over-year growth 2025-2030 (%)
Data Table on The Netherlands - Year-over-year growth 2025-2030 (%)

12.5 APAC - Market size and forecast 2025-2030

Chart on APAC - Market size and forecast 2025-2030 ($ thousand)
Data Table on APAC - Market size and forecast 2025-2030 ($ thousand)
Chart on APAC - Year-over-year growth 2025-2030 (%)
Data Table on APAC - Year-over-year growth 2025-2030 (%)
Chart on Regional Comparison - APAC
Data Table on Regional Comparison - APAC

12.5.1 China - Market size and forecast 2025-2030

Chart on China - Market size and forecast 2025-2030 ($ thousand)
Data Table on China - Market size and forecast 2025-2030 ($ thousand)
Chart on China - Year-over-year growth 2025-2030 (%)
Data Table on China - Year-over-year growth 2025-2030 (%)

12.5.2 Japan - Market size and forecast 2025-2030

Chart on Japan - Market size and forecast 2025-2030 ($ thousand)
Data Table on Japan - Market size and forecast 2025-2030 ($ thousand)
Chart on Japan - Year-over-year growth 2025-2030 (%)
Data Table on Japan - Year-over-year growth 2025-2030 (%)

12.5.3 India - Market size and forecast 2025-2030

Chart on India - Market size and forecast 2025-2030 ($ thousand)
Data Table on India - Market size and forecast 2025-2030 ($ thousand)
Chart on India - Year-over-year growth 2025-2030 (%)
Data Table on India - Year-over-year growth 2025-2030 (%)

12.5.4 South Korea - Market size and forecast 2025-2030

Chart on South Korea - Market size and forecast 2025-2030 ($ thousand)
Data Table on South Korea - Market size and forecast 2025-2030 ($ thousand)
Chart on South Korea - Year-over-year growth 2025-2030 (%)
Data Table on South Korea - Year-over-year growth 2025-2030 (%)

12.5.5 Australia - Market size and forecast 2025-2030

Chart on Australia - Market size and forecast 2025-2030 ($ thousand)
Data Table on Australia - Market size and forecast 2025-2030 ($ thousand)
Chart on Australia - Year-over-year growth 2025-2030 (%)
Data Table on Australia - Year-over-year growth 2025-2030 (%)

12.5.6 Indonesia - Market size and forecast 2025-2030

Chart on Indonesia - Market size and forecast 2025-2030 ($ thousand)
Data Table on Indonesia - Market size and forecast 2025-2030 ($ thousand)
Chart on Indonesia - Year-over-year growth 2025-2030 (%)
Data Table on Indonesia - Year-over-year growth 2025-2030 (%)

12.6 South America - Market size and forecast 2025-2030

Chart on South America - Market size and forecast 2025-2030 ($ thousand)
Data Table on South America - Market size and forecast 2025-2030 ($ thousand)
Chart on South America - Year-over-year growth 2025-2030 (%)
Data Table on South America - Year-over-year growth 2025-2030 (%)
Chart on Regional Comparison - South America
Data Table on Regional Comparison - South America

12.6.1 Brazil - Market size and forecast 2025-2030

Chart on Brazil - Market size and forecast 2025-2030 ($ thousand)
Data Table on Brazil - Market size and forecast 2025-2030 ($ thousand)
Chart on Brazil - Year-over-year growth 2025-2030 (%)
Data Table on Brazil - Year-over-year growth 2025-2030 (%)

12.6.2 Argentina - Market size and forecast 2025-2030

Chart on Argentina - Market size and forecast 2025-2030 ($ thousand)
Data Table on Argentina - Market size and forecast 2025-2030 ($ thousand)
Chart on Argentina - Year-over-year growth 2025-2030 (%)
Data Table on Argentina - Year-over-year growth 2025-2030 (%)

12.6.3 Chile - Market size and forecast 2025-2030

Chart on Chile - Market size and forecast 2025-2030 ($ thousand)
Data Table on Chile - Market size and forecast 2025-2030 ($ thousand)
Chart on Chile - Year-over-year growth 2025-2030 (%)
Data Table on Chile - Year-over-year growth 2025-2030 (%)

12.7 Middle East and Africa - Market size and forecast 2025-2030

Chart on Middle East and Africa - Market size and forecast 2025-2030 ($ thousand)
Data Table on Middle East and Africa - Market size and forecast 2025-2030 ($ thousand)
Chart on Middle East and Africa - Year-over-year growth 2025-2030 (%)
Data Table on Middle East and Africa - Year-over-year growth 2025-2030 (%)
Chart on Regional Comparison - Middle East and Africa
Data Table on Regional Comparison - Middle East and Africa

12.7.1 Saudi Arabia - Market size and forecast 2025-2030

Chart on Saudi Arabia - Market size and forecast 2025-2030 ($ thousand)
Data Table on Saudi Arabia - Market size and forecast 2025-2030 ($ thousand)
Chart on Saudi Arabia - Year-over-year growth 2025-2030 (%)
Data Table on Saudi Arabia - Year-over-year growth 2025-2030 (%)

12.7.2 UAE - Market size and forecast 2025-2030

Chart on UAE - Market size and forecast 2025-2030 ($ thousand)
Data Table on UAE - Market size and forecast 2025-2030 ($ thousand)
Chart on UAE - Year-over-year growth 2025-2030 (%)
Data Table on UAE - Year-over-year growth 2025-2030 (%)

12.7.3 South Africa - Market size and forecast 2025-2030

Chart on South Africa - Market size and forecast 2025-2030 ($ thousand)
Data Table on South Africa - Market size and forecast 2025-2030 ($ thousand)
Chart on South Africa - Year-over-year growth 2025-2030 (%)
Data Table on South Africa - Year-over-year growth 2025-2030 (%)

12.7.4 Israel - Market size and forecast 2025-2030

Chart on Israel - Market size and forecast 2025-2030 ($ thousand)
Data Table on Israel - Market size and forecast 2025-2030 ($ thousand)
Chart on Israel - Year-over-year growth 2025-2030 (%)
Data Table on Israel - Year-over-year growth 2025-2030 (%)

12.7.5 Turkey - Market size and forecast 2025-2030

Chart on Turkey - Market size and forecast 2025-2030 ($ thousand)
Data Table on Turkey - Market size and forecast 2025-2030 ($ thousand)
Chart on Turkey - Year-over-year growth 2025-2030 (%)
Data Table on Turkey - Year-over-year growth 2025-2030 (%)

12.8 Market opportunity by geography

Market opportunity by geography ($ thousand)
Data Tables on Market opportunity by geography ($ thousand)

13. Drivers, Challenges, and Opportunity

13.1 Market drivers

Drivers addressing persistent pharmacy labor shortages
Growing demand for medication accuracy
Consolidation of large scale fulfillment

13.2 Market challenges

High initial capital investment requirements
System integration and interoperability hurdles
Stringent regulatory compliance and standards

13.3 Impact of drivers and challenges

Impact of drivers and challenges in 2025 and 2030

13.4 Market opportunities

Increasing pharmacy workflow efficiency demands
Rising demand for specialty drugs
Integration of artificial intelligence analytics

14. Competitive Landscape

14.1 Overview

14.2

Overview on criticality of inputs and factors of differentiation

14.3 Landscape disruption

Overview on factors of disruption

14.4 Industry risks

Impact of key risks on business

15. Competitive Analysis

15.1 Companies profiled

Companies covered

15.2 Company ranking index

15.3 Market positioning of companies

Matrix on companies position and classification

15.4 Baxter International Inc.

Baxter International Inc. - Overview
Baxter International Inc. - Business segments
Baxter International Inc. - Key offerings
Baxter International Inc. - Segment focus
SWOT

15.5 Becton Dickinson and Co.

Becton Dickinson and Co. - Overview
Becton Dickinson and Co. - Business segments
Becton Dickinson and Co. - Key news
Becton Dickinson and Co. - Key offerings
Becton Dickinson and Co. - Segment focus
SWOT

15.6 Capsa Healthcare LLC

Capsa Healthcare LLC - Overview
Capsa Healthcare LLC - Product / Service
Capsa Healthcare LLC - Key offerings
SWOT

15.7 Cornerstone Automation Systems

Cornerstone Automation Systems - Overview
Cornerstone Automation Systems - Product / Service
Cornerstone Automation Systems - Key offerings
SWOT

15.8 Innovation Associates

Innovation Associates - Overview
Innovation Associates - Product / Service
Innovation Associates - Key offerings
SWOT

15.9 KNAPP AG

KNAPP AG - Overview
KNAPP AG - Product / Service
KNAPP AG - Key offerings
SWOT

15.10 KUKA AG

KUKA AG - Overview
KUKA AG - Product / Service
KUKA AG - Key offerings
SWOT

15.11 McKesson Corp.

McKesson Corp. - Overview
McKesson Corp. - Business segments
McKesson Corp. - Key offerings
McKesson Corp. - Segment focus
SWOT

15.12 Omnicell Inc.

Omnicell Inc. - Overview
Omnicell Inc. - Product / Service
Omnicell Inc. - Key offerings
SWOT

15.13 RoboPharma

RoboPharma - Overview
RoboPharma - Product / Service
RoboPharma - Key offerings
SWOT

15.14 Rxsafe LLC

Rxsafe LLC - Overview
Rxsafe LLC - Product / Service
Rxsafe LLC - Key offerings
SWOT

15.15 ScriptPro LLC

ScriptPro LLC - Overview
ScriptPro LLC - Product / Service
ScriptPro LLC - Key offerings
SWOT

15.16 Swisslog Healthcare AG

Swisslog Healthcare AG - Overview
Swisslog Healthcare AG - Product / Service
Swisslog Healthcare AG - Key offerings
SWOT

15.17 Takazono Corp

Takazono Corp - Overview
Takazono Corp - Product / Service
Takazono Corp - Key offerings
SWOT

15.18 YUYAMA Co. Ltd.

YUYAMA Co. Ltd. - Overview
YUYAMA Co. Ltd. - Product / Service
YUYAMA Co. Ltd. - Key offerings
SWOT

16. Appendix

16.1 Scope of the report

Market definition
Objectives
Notes and caveats

16.2 Inclusions and exclusions checklist

Inclusions checklist
Exclusions checklist

16.3 Currency conversion rates for US$

16.4 Research methodology

16.5 Data procurement

Information sources

16.6 Data validation

16.7 Validation techniques employed for market sizing

16.8 Data synthesis

16.9 360 degree market analysis

16.10 List of abbreviations

Research Methodology

Technavio presents a detailed picture of the market by way of study, synthesis, and summation of data from multiple sources. The analysts have presented the various facets of the market with a particular focus on identifying the key industry influencers. The data thus presented is comprehensive, reliable, and the result of extensive research, both primary and secondary.

INFORMATION SOURCES

Primary sources

  • Manufacturers and suppliers
  • Channel partners
  • Industry experts
  • Strategic decision makers

Secondary sources

  • Industry journals and periodicals
  • Government data
  • Financial reports of key industry players
  • Historical data
  • Press releases

DATA ANALYSIS

Data Synthesis

  • Collation of data
  • Estimation of key figures
  • Analysis of derived insights

Data Validation

  • Triangulation with data models
  • Reference against proprietary databases
  • Corroboration with industry experts

REPORT WRITING

Qualitative

  • Market drivers
  • Market challenges
  • Market trends
  • Five forces analysis

Quantitative

  • Market size and forecast
  • Market segmentation
  • Geographical insights
  • Competitive landscape

Interested in this report?

Get your sample now to see our research methodology and insights!

Download Now

Frequently Asked Questions

Central Fill Pharmacy Automation market growth will increase by USD 915456.0 thousand thousand during 2026-2030.

The Central Fill Pharmacy Automation market is expected to grow at a CAGR of 15.4% during 2026-2030.

Central Fill Pharmacy Automation market is segmented by Application (Inpatient pharmacy, Outpatient pharmacy, Retail pharmacy) Type (Equipment, Services) Product type (Robotic dispensing systems, Automated medication storage systems, Barcode scanning systems, Others)

Baxter International Inc., Becton Dickinson and Co., Capsa Healthcare LLC, Cornerstone Automation Systems, Gollmann Kommissioniersysteme, Innovation Associates, KNAPP AG, KUKA AG, McKesson Corp., Omnicell Inc., Pearson Medical Technologies LLC, Quality Manufacturing Systems, RoboPharma, Rxsafe LLC, ScriptPro LLC, Sinteco, Swisslog Healthcare AG, Takazono Corp, Tension Packaging and Automation, YUYAMA Co. Ltd. are a few of the key vendors in the Central Fill Pharmacy Automation market.

North America will register the highest growth rate of 41.7% among the other regions. Therefore, the Central Fill Pharmacy Automation market in North America is expected to garner significant business opportunities for the vendors during the forecast period.

US, Canada, Mexico, Germany, UK, France, Italy, Spain, The Netherlands, China, Japan, India, South Korea, Australia, Indonesia, Brazil, Argentina, Chile, Saudi Arabia, UAE, South Africa, Israel, Turkey

  • Drivers addressing persistent pharmacy labor shortages is the driving factor this market.

The Central Fill Pharmacy Automation market vendors should focus on grabbing business opportunities from the Application segment as it accounted for the largest market share in the base year.
RIA - Research AI Assistant
Ask RIA
