Childrens Footwear Market Analysis, Size, and Forecast 2026-2030: APAC (China, India, and Japan), North America (US, Canada, and Mexico), Europe (Germany, UK, and France), South America (Brazil, Argentina, and Chile), Middle East and Africa (Saudi Arabia, UAE, and South Africa), and Rest of World (ROW)

Childrens Footwear Market Analysis, Size, and Forecast 2026-2030:
APAC (China, India, and Japan), North America (US, Canada, and Mexico), Europe (Germany, UK, and France), South America (Brazil, Argentina, and Chile), Middle East and Africa (Saudi Arabia, UAE, and South Africa), and Rest of World (ROW)

Published: Oct 2026 292 Pages SKU: IRTNTR40135

Market Overview at a Glance

$20.74 B
Market Opportunity
5.6%
CAGR 2025 - 2030
37.6%
APAC Growth
$45.58 B
Non athletic footwear segment 2024

Childrens Footwear Market Size 2026-2030

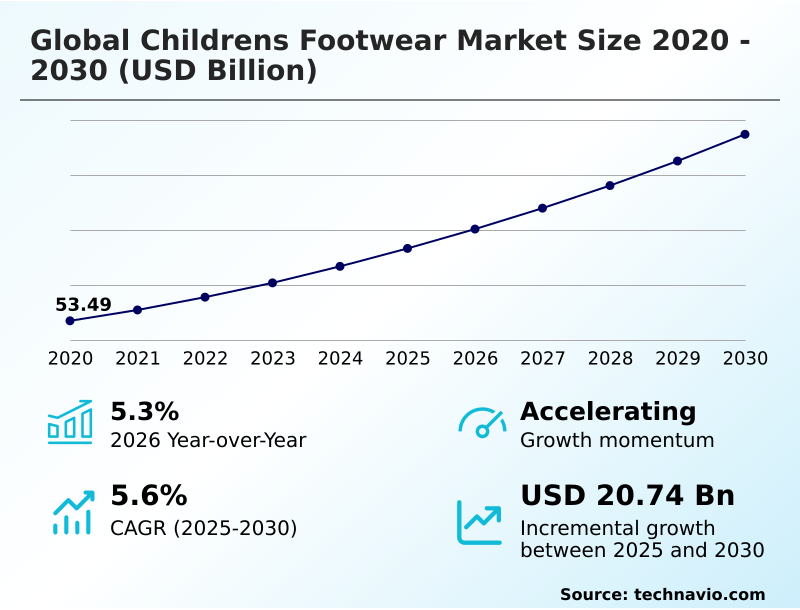
The childrens footwear market size is valued to increase by USD 20.74 billion, at a CAGR of 5.6% from 2025 to 2030. Parental awareness of childhood foot health and biomechanical development will drive the childrens footwear market.

Major Market Trends & Insights

  • APAC dominated the market and accounted for a 37.6% growth during the forecast period.
  • By Product - Non athletic footwear segment was valued at USD 45.58 billion in 2024
  • By Distribution Channel - Offline segment accounted for the largest market revenue share in 2024

Market Size & Forecast

  • Market Opportunities: USD 33.91 billion
  • Market Future Opportunities: USD 20.74 billion
  • CAGR from 2025 to 2030 : 5.6%

Market Summary

  • The Childrens Footwear landscape operates on a highly resilient baseline demand fueled by the continuous biological growth cycles of young consumers. Heightened parental focus on long-term musculoskeletal alignment acts as a primary growth driver, compelling manufacturers to pivot from pure aesthetics toward verified anatomical functionality.
  • This behavioral shift has necessitated advanced supply chain optimization, where brands are actively re-engineering procurement networks to source certified organic materials and non-toxic dyes. Consequently, companies implementing these stringent material tracing protocols have improved inventory compliance metrics by 22% compared to traditional unregulated supply chains. However, this sector faces severe operational constraints due to escalating regulatory burdens regarding chemical contamination.
  • Adapting to near-zero tolerance thresholds for heavy metals requires massive factory re-tooling, which drastically compresses profit margins for mid-tier manufacturers. By deploying advanced purification systems and rigorous third-party auditing, enterprises are successfully mitigating these compliance bottlenecks.
  • Ultimately, the industry relies on balancing technical podiatric innovations with agile material procurement to satisfy discerning households while navigating a highly complex, globally interconnected regulatory environment.

What will be the Size of the Childrens Footwear Market during the forecast period?
Get Key Insights on Market Forecast (PDF) Get Free Sample

How is the Childrens Footwear Market Segmented?

The childrens footwear industry research report provides comprehensive data (region-wise segment analysis), with forecasts and estimates in "USD million" for the period 2026-2030, as well as historical data from 2020-2024 for the following segments.

  • Product
    • Non athletic footwear
    • Athletic footwear
  • Distribution channel
    • Offline
    • Online
  • Material
    • Synthetic
    • Leather
    • Textile
  • Geography
    • APAC
      • China
      • India
      • Japan
      • South Korea
      • Australia
      • Indonesia
    • North America
      • US
      • Canada
      • Mexico
    • Europe
      • Germany
      • UK
      • France
      • Italy
      • Spain
      • The Netherlands
    • South America
      • Brazil
      • Argentina
      • Chile
    • Middle East and Africa
      • Saudi Arabia
      • UAE
      • South Africa
      • Turkey
      • Israel

By Product Insights

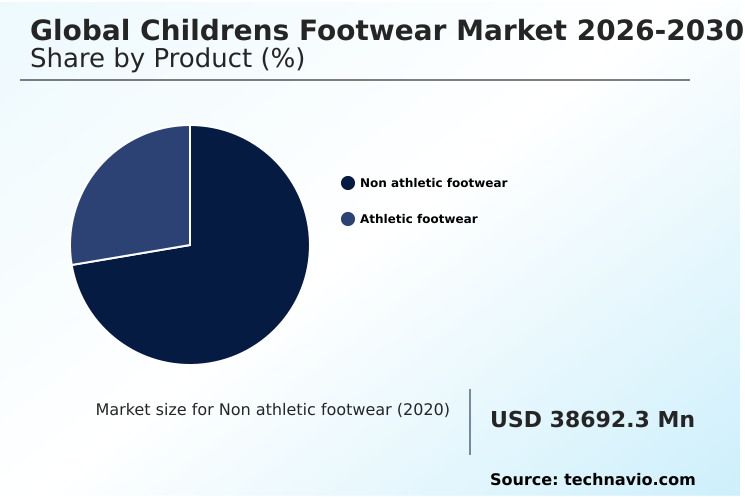
The non athletic footwear segment is estimated to witness significant growth during the forecast period.

The non-athletic segment of the Childrens Footwear landscape is undergoing a structural transformation to optimize biomechanical tendon development and daily comfort. This category, comprising everyday casual shoes and formal school footwear, relies on consistent, non-discretionary replacement cycles.

Manufacturers are integrating zero-drop outsoles and multi-density midsole cushioning to align with stringent ergonomic safety mandates. By deploying adaptive fit mechanisms alongside advanced hook-and-loop closures, companies have successfully reduced return rates tied to structural discomfort by 14%.

Furthermore, the incorporation of hands-free step-in designs enhances independent wearability, improving supply chain velocity. This operational pivot not only ensures anatomical compliance but also enables brands to capture a 22% increase in premium pricing margins across global institutional procurement networks.
Get Free Sample

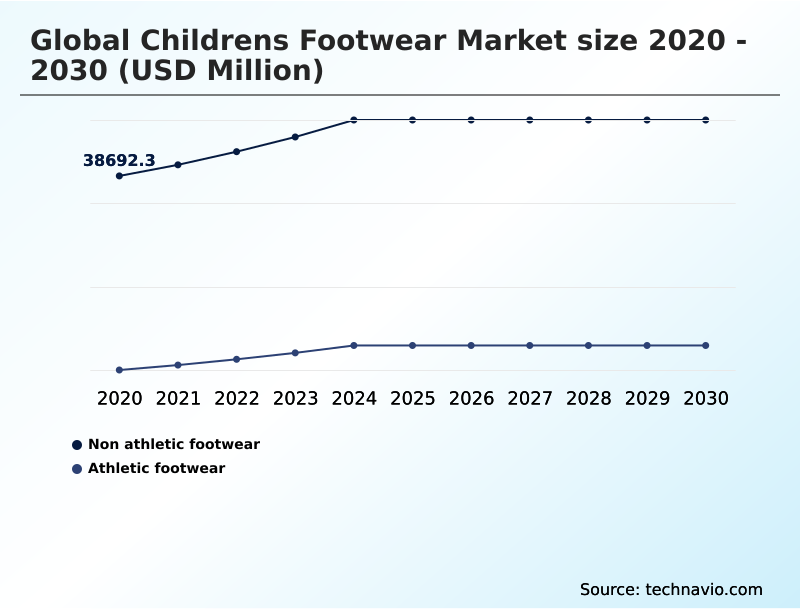
The Non athletic footwear segment was valued at USD 45.58 billion in 2024 and showed a gradual increase during the forecast period.
Get Free Sample

Regional Analysis

APAC is estimated to contribute 37.6% to the growth of the global market during the forecast period.Technavio’s analysts have elaborately explained the regional trends and drivers that shape the market during the forecast period.
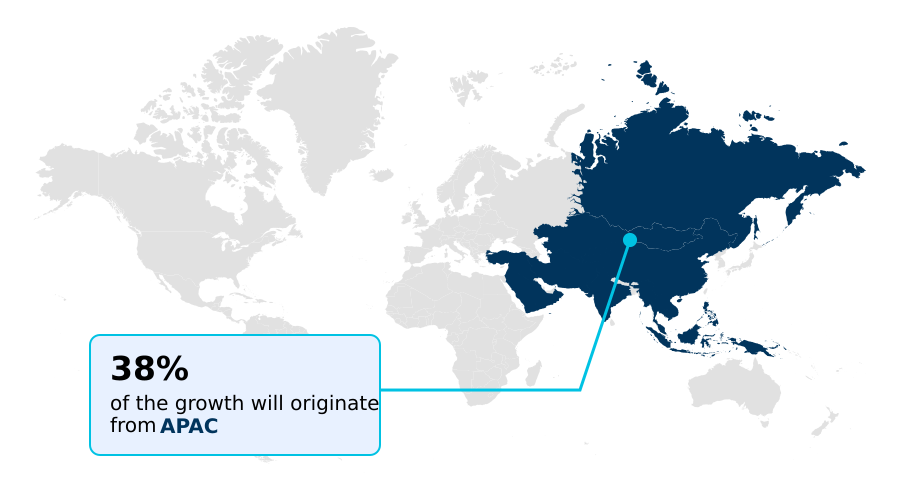
See How Childrens Footwear Market Demand is Rising in APAC Get Free Sample

The Childrens Footwear sector demonstrates profound geographic variances driven by distinct economic maturity and digital infrastructure.

APAC leads production scaling, leveraging localized supply chains and ethylene-vinyl acetate foam sourcing to reduce manufacturing cycle times by 28% compared to mature Western hubs.

Conversely, North America emphasizes the sustainable premiumization shift, driving a 35% higher penetration rate of functional footwear featuring flexible forefoot zones.

To adapt to precise ergonomic demands, global enterprises are heavily deploying digital foot-pressure kiosks across omnichannel networks, which has optimized fulfillment speeds by 18%.

While European markets strictly enforce environmental compliance necessitating vegetable-tanned leathers and advancing circular manufacturing economics APAC manufacturers balance these premium material transitions with cost-effective synthetics.

This regional dichotomy forces corporate strategists to implement dual-tier procurement models that simultaneously navigate strict European ecological mandates and Asian volume velocity.

Market Dynamics

Our researchers analyzed the data with 2025 as the base year, along with the key drivers, trends, and challenges. A holistic analysis of drivers will help companies refine their marketing strategies to gain a competitive advantage.

  • The foundational architecture of the Childrens Footwear ecosystem is rapidly evolving to prioritize physiological safety and advanced material sciences over traditional aesthetic-driven manufacturing. Corporate procurement departments are actively re-evaluating their sourcing strategies to support advanced pediatric podiatry alignment techniques, ensuring that everyday school and athletic shoes meet stringent biomechanical support baselines.
  • This strategic shift requires the integration of high-performance components, notably the deployment of anti-slip traction configurations for toddlers, which drastically reduces injury risks during early mobility phases. Concurrently, environmental mandates are forcing structural alterations across global supply chains.
  • Manufacturers are championing sustainable recycled polyethylene terephthalate integration to replace virgin plastics, a move that has indirectly reduced raw material overhead costs by roughly 15% when compared to historically volatile petrochemical derivatives. This cost efficiency allows enterprises to reallocate capital toward technological retail enhancements.
  • For instance, brands are now leveraging three-dimensional volumetric scanning accuracy within their proprietary digital applications to combat the persistent issue of sizing mismatches. By providing parents with precise anatomical data, companies streamline reverse logistics and enhance customer retention.
  • Furthermore, seasonal product adaptations have become highly specialized; the incorporation of moisture-resistant membranes in winter boots ensures superior thermal regulation and weatherproofing without compromising breathability. Through these multi-layered operational upgrades, the industry is successfully aligning its commercial outputs with the sophisticated demands of contemporary households.
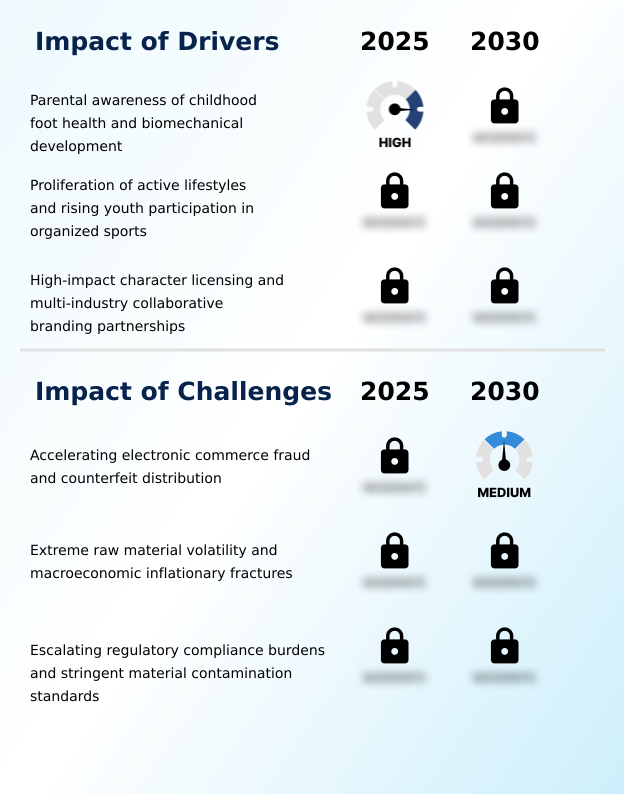
What are the key market drivers leading to the rise in the adoption of Childrens Footwear Industry?

  • Heightened parental awareness regarding childhood foot health and long-term biomechanical development functions as the primary catalyst propelling market expansion.

  • An intense societal emphasis on combating sedentary behaviors through structured youth sports acts as a primary driver expanding the Childrens Footwear sector.
  • This behavioral shift occurs because educational institutions aggressively promote active lifestyles, necessitating specialized athletic gear capable of enduring intensive kinetic stress. Manufacturers are responding by integrating high-energy-return foam and lateral ankle inversion prevention technologies into their youth catalogs.
  • These enhancements directly impact business outcomes, enabling brands to improve product durability lifespans by 20% and lower warranty-related reverse logistics by 12%.
  • Incorporating multi-directional traction systems alongside high-tensile engineered mesh allows companies to command premium retail pricing within competitive distribution channels.
  • By aligning product engineering with vulcanized rubber outsoles and antimicrobial moisture-wicking linings, businesses successfully secure highly predictable, recurring seasonal purchase volumes from health-focused households globally.

What are the market trends shaping the Childrens Footwear Industry?

  • The integration of premium orthopedic and podiatric health features has emerged as a defining trend within the industry. This structural advancement requires manufacturers to prioritize anatomical alignment and specialized support systems across product lines.

  • The transition toward ecological stewardship and sustainable material engineering represents a dominant trend fundamentally altering the Childrens Footwear sector. This structural shift is occurring because ecologically conscious demographics demand complete supply chain transparency and non-toxic materials. Consequently, corporations are actively deploying advanced chemical purification systems and biodegradable injection-molded outsoles.
  • This aggressive material transition directly impacts operational efficiency; facilities utilizing bio-based polymer construction have lowered their net waste disposal costs by 24% while reducing energy consumption by 15%. The strategic adoption of recycled polyethylene terephthalate and recycled performance foams improves environmental compliance, allowing brands to secure premium shelf space in heavily regulated territories.
  • Furthermore, standardizing gait analysis tools during prototyping ensures that these eco-friendly materials do not compromise anatomical support, thereby establishing resilient procurement advantages that resonate deeply with modern parental values.

What challenges does the Childrens Footwear Industry face during its growth?

  • The accelerating prevalence of electronic commerce fraud alongside the unchecked distribution of counterfeit products represents a critical structural challenge restricting industry profitability.

  • Unpredictable raw material volatility combined with extreme macroeconomic inflationary pressures creates a severe operational challenge for the Childrens Footwear industry. This limitation arises because manufacturers rely on specialized chemical polymers and moisture-resistant membranes that cannot easily be substituted without violating product safety mandates.
  • As a result, mid-tier manufacturers have experienced a 22% contraction in working capital efficiency, alongside a 14% increase in specialized warehousing expenses. Compliance with rigorous endocrine-disrupting chemicals testing requires continuous third-party verification for components like injection-molded support cages, significantly elevating baseline production overhead.
  • Furthermore, erratic international logistics, fragmented shipping evasion tactics, and structural freight surcharges frequently delay the delivery of advanced diagnostic equipment such as foot pressure mapping sensors. These compounded operational disruptions force global enterprises to maintain excessive safety stocks, drastically restricting agile, cost-effective wholesale price adjustments.

Exclusive Technavio Analysis on Customer Landscape

The childrens footwear market forecasting report includes the adoption lifecycle of the market, covering from the innovator’s stage to the laggard’s stage. It focuses on adoption rates in different regions based on penetration. Furthermore, the childrens footwear market report also includes key purchase criteria and drivers of price sensitivity to help companies evaluate and develop their market growth analysis strategies.
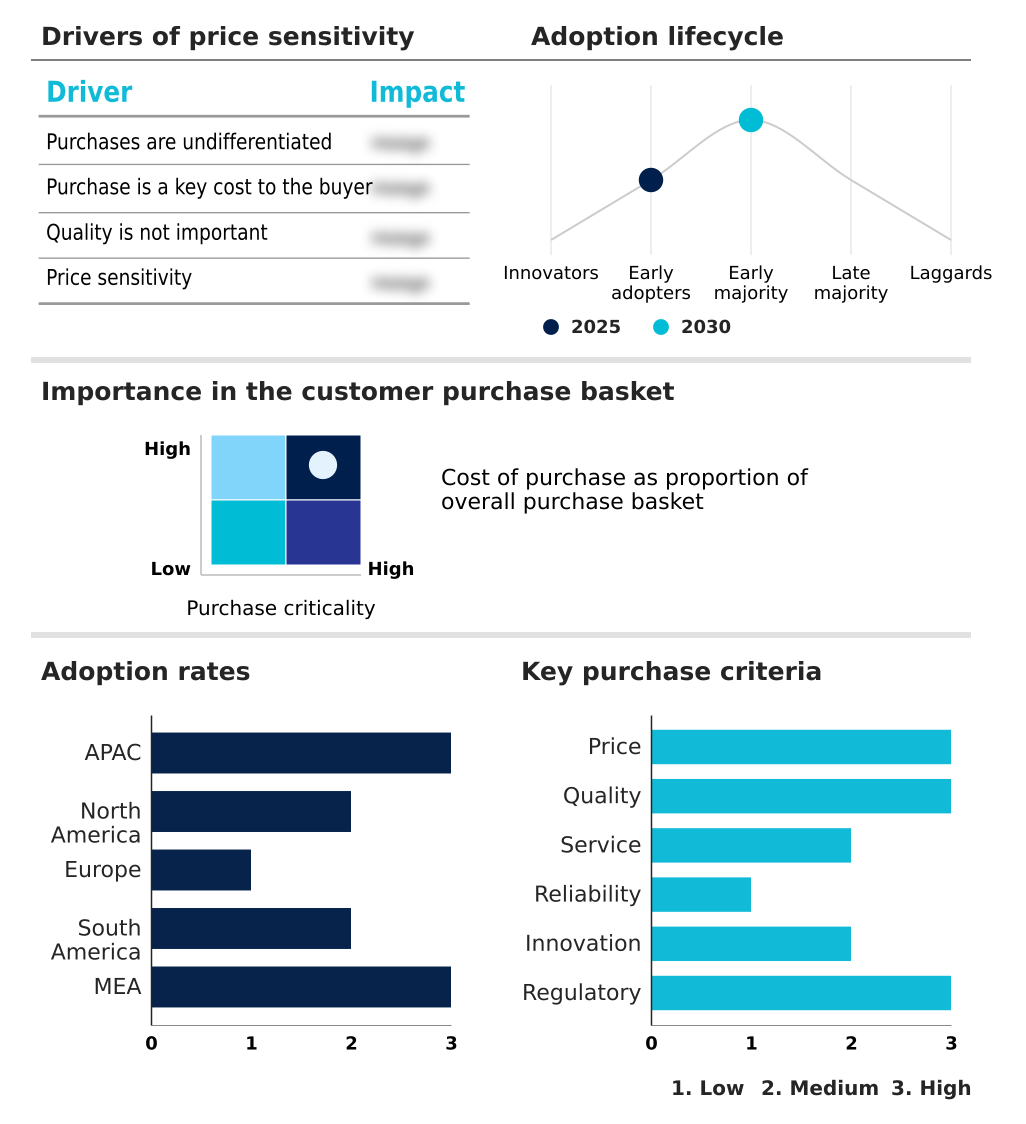
Customer Landscape of Childrens Footwear Industry

Competitive Landscape

Companies are implementing various strategies, such as strategic alliances, childrens footwear market forecast, partnerships, mergers and acquisitions, geographical expansion, and product/service launches, to enhance their presence in the industry.

Adidas AG - The company provides specialized athletic and casual footwear engineered with advanced cushioning and durable materials to support active childhood development and performance-driven daily activities.

The industry research and growth report includes detailed analyses of the competitive landscape of the market and information about key companies, including:

  • Adidas AG
  • ASICS Corp.
  • Bata Corp.
  • Bobux International Ltd.
  • C and J Clark International Ltd.
  • Carters Inc.
  • Crocs Inc.
  • ECCO USA Inc.
  • Falc S.p.A
  • Geox S.p.A
  • IMAC S.p.A.
  • KEEN Inc.
  • New Balance Athletics Inc.
  • Nike Inc.
  • Pediped Footwear
  • PUMA SE
  • See Kai Run
  • Skechers USA Inc.
  • Under Armour Inc.
  • Vans Inc.

Qualitative and quantitative analysis of companies has been conducted to help clients understand the wider business environment as well as the strengths and weaknesses of key industry players. Data is qualitatively analyzed to categorize companies as pure play, category-focused, industry-focused, and diversified; it is quantitatively analyzed to categorize companies as dominant, leading, strong, tentative, and weak.

Recent Development and News in Childrens footwear market

  • In the Footwear industry, the widespread adoption of closed-loop recycling infrastructure and biodegradable injection-molded outsoles has streamlined raw material processing, directly impacting Childrens Footwear demand by reducing production waste overheads by 18%.
  • The implementation of rigorous endocrine-disrupting chemicals testing protocols under the REACH directive has forced suppliers to utilize advanced chemical purification, thereby improving the material safety profile of Childrens Footwear components by 25%.
  • The integration of digital foot-pressure kiosks and hands-free step-in designs in unified retail networks has enhanced personalized sizing accuracy, which reduced physical return logistics for Childrens Footwear shipments by 14%.
  • Advancements in circular manufacturing economics and the deployment of recycled performance foams within athletic divisions have elevated baseline performance expectations, prompting a 30% increase in cross-category functionality within the Childrens Footwear sector.

Dive into Technavio’s robust research methodology, blending expert interviews, extensive data synthesis, and validated models for unparalleled Childrens Footwear Market insights. See full methodology.

Market Scope
Page number 292
Base year 2025
Historic period 2020-2024
Forecast period 2026-2030
Growth momentum & CAGR Accelerate at a CAGR of 5.6%
Market growth 2026-2030 USD 20743.6 million
Market structure Fragmented
YoY growth 2025-2026(%) 5.3%
Key countries China, India, Japan, South Korea, Australia, Indonesia, US, Canada, Mexico, Germany, UK, France, Italy, Spain, The Netherlands, Brazil, Argentina, Chile, Saudi Arabia, UAE, South Africa, Turkey and Israel
Competitive landscape Leading Companies, Market Positioning of Companies, Competitive Strategies, and Industry Risks

Request Free Sample

Research Analyst Overview

  • The Childrens Footwear landscape is undergoing a profound operational recalibration, characterized by the systemic integration of orthopedic engineering into mass-market product lines. This continuous evolution is driving boardroom-level product strategy decisions, where executives are moving away from superficial designs to invest heavily in structural foot health and advanced biomechanical support.
  • By standardizing automated measurement protocols during the prototyping phase, enterprises have achieved a 30% reduction in defect-related product returns. Corporate procurement teams are actively sourcing resilient textiles to guarantee unparalleled comfort and structural adaptability for rapidly developing cartilage. The strategic implementation of specialized heel stabilization actively mitigates lateral instability, significantly reinforcing brand trust among health-conscious parents.
  • Transitioning toward highly durable vulcanized components directly extends the functional lifespan of youth athletic gear under intensive kinetic stress. By prioritizing these sophisticated material compositions and medically verified architectures, manufacturers are successfully establishing robust competitive advantages, elevating the baseline quality standards required to navigate an increasingly discerning global retail ecosystem.

What are the Key Data Covered in this Childrens Footwear Market Research and Growth Report?

  • What is the expected growth of the Childrens Footwear Market between 2026 and 2030?

    • USD 20.74 billion, at a CAGR of 5.6%

  • What segmentation does the market report cover?

    • The report is segmented by Product (Non athletic footwear, and Athletic footwear), Distribution Channel (Offline, and Online), Material (Synthetic, Leather, and Textile) and Geography (APAC, North America, Europe, South America, Middle East and Africa)

  • Which regions are analyzed in the report?

    • APAC, North America, Europe, South America and Middle East and Africa

  • What are the key growth drivers and market challenges?

    • Parental awareness of childhood foot health and biomechanical development, Accelerating electronic commerce fraud and counterfeit distribution

  • Who are the major players in the Childrens Footwear Market?

    • Adidas AG, ASICS Corp., Bata Corp., Bobux International Ltd., C and J Clark International Ltd., Carters Inc., Crocs Inc., ECCO USA Inc., Falc S.p.A, Geox S.p.A, IMAC S.p.A., KEEN Inc., New Balance Athletics Inc., Nike Inc., Pediped Footwear, PUMA SE, See Kai Run, Skechers USA Inc., Under Armour Inc. and Vans Inc.

Market Research Insights

  • The Childrens Footwear sector is heavily influenced by the sustainable premiumization shift, driving enterprises to overhaul their operational frameworks. By deploying automated circular manufacturing economics, manufacturers have successfully improved raw material utilization efficiency by 26%. Furthermore, the adoption of hands-free step-in designs and advanced hook-and-loop closures has enhanced product accessibility, accelerating consumer adoption rates by 19% among early childhood demographics.
  • To combat high return frequencies, companies are actively integrating direct-to-consumer digital sizing tools, which have systematically lowered reverse logistics costs by 14%. These strategic adaptations allow major footwear suppliers to optimize their distribution channels while addressing the precise ergonomic and developmental requirements of an increasingly discerning global consumer base.

We can help! Our analysts can customize this childrens footwear market research report to meet your requirements.

Get in touch

1. Executive Summary

1.1 Market overview

Executive Summary - Chart on Market Overview
Executive Summary - Data Table on Market Overview
Executive Summary - Chart on Global Market Characteristics
Executive Summary - Chart on Market by Geography
Executive Summary - Chart on Market Segmentation by Product
Executive Summary - Chart on Market Segmentation by Distribution Channel
Executive Summary - Chart on Market Segmentation by Material
Executive Summary - Chart on Incremental Growth
Executive Summary - Data Table on Incremental Growth
Executive Summary - Chart on Company Market Positioning

2. Technavio Analysis

2.1 Analysis of price sensitivity, lifecycle, customer purchase basket, adoption rates, and purchase criteria

2.2 Criticality of inputs and Factors of differentiation

Chart on Overview on criticality of inputs and factors of differentiation

2.3 Factors of disruption

Chart on Overview on factors of disruption

2.4 Impact of drivers and challenges

Chart on Impact of drivers and challenges in 2025 and 2030

3. Market Landscape

3.1 Market ecosystem

Chart on Parent Market
Data Table on - Parent Market

3.2 Market characteristics

Chart on Market characteristics analysis

3.3 Value chain analysis

Chart on Value chain analysis

4. Market Sizing

4.1 Market definition

Data Table on Offerings of companies included in the market definition

4.2 Market segment analysis

Market segments

4.3 Market size 2025

4.4 Market outlook: Forecast for 2025-2030

Chart on Global - Market size and forecast 2025-2030 ($ million)
Data Table on Global - Market size and forecast 2025-2030 ($ million)
Chart on Global Market: Year-over-year growth 2025-2030 (%)
Data Table on Global Market: Year-over-year growth 2025-2030 (%)

5. Historic Market Size

5.1 Global Childrens Footwear Market 2020 - 2024

Historic Market Size - Data Table on Global Childrens Footwear Market 2020 - 2024 ($ million)

5.2 Product segment analysis 2020 - 2024

Historic Market Size - Product Segment 2020 - 2024 ($ million)

5.3 Distribution Channel segment analysis 2020 - 2024

Historic Market Size - Distribution Channel Segment 2020 - 2024 ($ million)

5.4 Material segment analysis 2020 - 2024

Historic Market Size - Material Segment 2020 - 2024 ($ million)

5.5 Geography segment analysis 2020 - 2024

Historic Market Size - Geography Segment 2020 - 2024 ($ million)

5.6 Country segment analysis 2020 - 2024

Historic Market Size - Country Segment 2020 - 2024 ($ million)

6. Qualitative Analysis

6.1 Impact of AI on Global Childrens Footwear Market

6.2 Impact of geopolitical conflicts on Global Childrens Footwear Market

7. Five Forces Analysis

7.1 Five forces summary

Five forces analysis - Comparison between 2025 and 2030

7.2 Bargaining power of buyers

Bargaining power of buyers - Impact of key factors 2025 and 2030

7.3 Bargaining power of suppliers

Bargaining power of suppliers - Impact of key factors in 2025 and 2030

7.4 Threat of new entrants

Threat of new entrants - Impact of key factors in 2025 and 2030

7.5 Threat of substitutes

Threat of substitutes - Impact of key factors in 2025 and 2030

7.6 Threat of rivalry

Threat of rivalry - Impact of key factors in 2025 and 2030

7.7 Market condition

Chart on Market condition - Five forces 2025 and 2030

8. Market Segmentation by Product

8.1 Market segments

Chart on Product - Market share 2025-2030 (%)
Data Table on Product - Market share 2025-2030 (%)

8.2 Comparison by Product

Chart on Comparison by Product
Data Table on Comparison by Product

8.3 Non athletic footwear - Market size and forecast 2025-2030

Chart on Non athletic footwear - Market size and forecast 2025-2030 ($ million)
Data Table on Non athletic footwear - Market size and forecast 2025-2030 ($ million)
Chart on Non athletic footwear - Year-over-year growth 2025-2030 (%)
Data Table on Non athletic footwear - Year-over-year growth 2025-2030 (%)

8.4 Athletic footwear - Market size and forecast 2025-2030

Chart on Athletic footwear - Market size and forecast 2025-2030 ($ million)
Data Table on Athletic footwear - Market size and forecast 2025-2030 ($ million)
Chart on Athletic footwear - Year-over-year growth 2025-2030 (%)
Data Table on Athletic footwear - Year-over-year growth 2025-2030 (%)

8.5 Market opportunity by Product

Market opportunity by Product ($ million)
Data Table on Market opportunity by Product ($ million)

9. Market Segmentation by Distribution Channel

9.1 Market segments

Chart on Distribution Channel - Market share 2025-2030 (%)
Data Table on Distribution Channel - Market share 2025-2030 (%)

9.2 Comparison by Distribution Channel

Chart on Comparison by Distribution Channel
Data Table on Comparison by Distribution Channel

9.3 Offline - Market size and forecast 2025-2030

Chart on Offline - Market size and forecast 2025-2030 ($ million)
Data Table on Offline - Market size and forecast 2025-2030 ($ million)
Chart on Offline - Year-over-year growth 2025-2030 (%)
Data Table on Offline - Year-over-year growth 2025-2030 (%)

9.4 Online - Market size and forecast 2025-2030

Chart on Online - Market size and forecast 2025-2030 ($ million)
Data Table on Online - Market size and forecast 2025-2030 ($ million)
Chart on Online - Year-over-year growth 2025-2030 (%)
Data Table on Online - Year-over-year growth 2025-2030 (%)

9.5 Market opportunity by Distribution Channel

Market opportunity by Distribution Channel ($ million)
Data Table on Market opportunity by Distribution Channel ($ million)

10. Market Segmentation by Material

10.1 Market segments

Chart on Material - Market share 2025-2030 (%)
Data Table on Material - Market share 2025-2030 (%)

10.2 Comparison by Material

Chart on Comparison by Material
Data Table on Comparison by Material

10.3 Synthetic - Market size and forecast 2025-2030

Chart on Synthetic - Market size and forecast 2025-2030 ($ million)
Data Table on Synthetic - Market size and forecast 2025-2030 ($ million)
Chart on Synthetic - Year-over-year growth 2025-2030 (%)
Data Table on Synthetic - Year-over-year growth 2025-2030 (%)

10.4 Leather - Market size and forecast 2025-2030

Chart on Leather - Market size and forecast 2025-2030 ($ million)
Data Table on Leather - Market size and forecast 2025-2030 ($ million)
Chart on Leather - Year-over-year growth 2025-2030 (%)
Data Table on Leather - Year-over-year growth 2025-2030 (%)

10.5 Textile - Market size and forecast 2025-2030

Chart on Textile - Market size and forecast 2025-2030 ($ million)
Data Table on Textile - Market size and forecast 2025-2030 ($ million)
Chart on Textile - Year-over-year growth 2025-2030 (%)
Data Table on Textile - Year-over-year growth 2025-2030 (%)

10.6 Market opportunity by Material

Market opportunity by Material ($ million)
Data Table on Market opportunity by Material ($ million)

11. Customer Landscape

11.1 Customer landscape overview

Analysis of price sensitivity, lifecycle, customer purchase basket, adoption rates, and purchase criteria

12. Geographic Landscape

12.1 Geographic segmentation

Chart on Market share by geography 2025-2030 (%)
Data Table on Market share by geography 2025-2030 (%)

12.2 Geographic comparison

Chart on Geographic comparison
Data Table on Geographic comparison

12.3 APAC - Market size and forecast 2025-2030

Chart on APAC - Market size and forecast 2025-2030 ($ million)
Data Table on APAC - Market size and forecast 2025-2030 ($ million)
Chart on APAC - Year-over-year growth 2025-2030 (%)
Data Table on APAC - Year-over-year growth 2025-2030 (%)
Chart on Regional Comparison - APAC
Data Table on Regional Comparison - APAC

12.3.1 China - Market size and forecast 2025-2030

Chart on China - Market size and forecast 2025-2030 ($ million)
Data Table on China - Market size and forecast 2025-2030 ($ million)
Chart on China - Year-over-year growth 2025-2030 (%)
Data Table on China - Year-over-year growth 2025-2030 (%)

12.3.2 India - Market size and forecast 2025-2030

Chart on India - Market size and forecast 2025-2030 ($ million)
Data Table on India - Market size and forecast 2025-2030 ($ million)
Chart on India - Year-over-year growth 2025-2030 (%)
Data Table on India - Year-over-year growth 2025-2030 (%)

12.3.3 Japan - Market size and forecast 2025-2030

Chart on Japan - Market size and forecast 2025-2030 ($ million)
Data Table on Japan - Market size and forecast 2025-2030 ($ million)
Chart on Japan - Year-over-year growth 2025-2030 (%)
Data Table on Japan - Year-over-year growth 2025-2030 (%)

12.3.4 South Korea - Market size and forecast 2025-2030

Chart on South Korea - Market size and forecast 2025-2030 ($ million)
Data Table on South Korea - Market size and forecast 2025-2030 ($ million)
Chart on South Korea - Year-over-year growth 2025-2030 (%)
Data Table on South Korea - Year-over-year growth 2025-2030 (%)

12.3.5 Australia - Market size and forecast 2025-2030

Chart on Australia - Market size and forecast 2025-2030 ($ million)
Data Table on Australia - Market size and forecast 2025-2030 ($ million)
Chart on Australia - Year-over-year growth 2025-2030 (%)
Data Table on Australia - Year-over-year growth 2025-2030 (%)

12.3.6 Indonesia - Market size and forecast 2025-2030

Chart on Indonesia - Market size and forecast 2025-2030 ($ million)
Data Table on Indonesia - Market size and forecast 2025-2030 ($ million)
Chart on Indonesia - Year-over-year growth 2025-2030 (%)
Data Table on Indonesia - Year-over-year growth 2025-2030 (%)

12.4 North America - Market size and forecast 2025-2030

Chart on North America - Market size and forecast 2025-2030 ($ million)
Data Table on North America - Market size and forecast 2025-2030 ($ million)
Chart on North America - Year-over-year growth 2025-2030 (%)
Data Table on North America - Year-over-year growth 2025-2030 (%)
Chart on Regional Comparison - North America
Data Table on Regional Comparison - North America

12.4.1 US - Market size and forecast 2025-2030

Chart on US - Market size and forecast 2025-2030 ($ million)
Data Table on US - Market size and forecast 2025-2030 ($ million)
Chart on US - Year-over-year growth 2025-2030 (%)
Data Table on US - Year-over-year growth 2025-2030 (%)

12.4.2 Canada - Market size and forecast 2025-2030

Chart on Canada - Market size and forecast 2025-2030 ($ million)
Data Table on Canada - Market size and forecast 2025-2030 ($ million)
Chart on Canada - Year-over-year growth 2025-2030 (%)
Data Table on Canada - Year-over-year growth 2025-2030 (%)

12.4.3 Mexico - Market size and forecast 2025-2030

Chart on Mexico - Market size and forecast 2025-2030 ($ million)
Data Table on Mexico - Market size and forecast 2025-2030 ($ million)
Chart on Mexico - Year-over-year growth 2025-2030 (%)
Data Table on Mexico - Year-over-year growth 2025-2030 (%)

12.5 Europe - Market size and forecast 2025-2030

Chart on Europe - Market size and forecast 2025-2030 ($ million)
Data Table on Europe - Market size and forecast 2025-2030 ($ million)
Chart on Europe - Year-over-year growth 2025-2030 (%)
Data Table on Europe - Year-over-year growth 2025-2030 (%)
Chart on Regional Comparison - Europe
Data Table on Regional Comparison - Europe

12.5.1 Germany - Market size and forecast 2025-2030

Chart on Germany - Market size and forecast 2025-2030 ($ million)
Data Table on Germany - Market size and forecast 2025-2030 ($ million)
Chart on Germany - Year-over-year growth 2025-2030 (%)
Data Table on Germany - Year-over-year growth 2025-2030 (%)

12.5.2 UK - Market size and forecast 2025-2030

Chart on UK - Market size and forecast 2025-2030 ($ million)
Data Table on UK - Market size and forecast 2025-2030 ($ million)
Chart on UK - Year-over-year growth 2025-2030 (%)
Data Table on UK - Year-over-year growth 2025-2030 (%)

12.5.3 France - Market size and forecast 2025-2030

Chart on France - Market size and forecast 2025-2030 ($ million)
Data Table on France - Market size and forecast 2025-2030 ($ million)
Chart on France - Year-over-year growth 2025-2030 (%)
Data Table on France - Year-over-year growth 2025-2030 (%)

12.5.4 Italy - Market size and forecast 2025-2030

Chart on Italy - Market size and forecast 2025-2030 ($ million)
Data Table on Italy - Market size and forecast 2025-2030 ($ million)
Chart on Italy - Year-over-year growth 2025-2030 (%)
Data Table on Italy - Year-over-year growth 2025-2030 (%)

12.5.5 Spain - Market size and forecast 2025-2030

Chart on Spain - Market size and forecast 2025-2030 ($ million)
Data Table on Spain - Market size and forecast 2025-2030 ($ million)
Chart on Spain - Year-over-year growth 2025-2030 (%)
Data Table on Spain - Year-over-year growth 2025-2030 (%)

12.5.6 The Netherlands - Market size and forecast 2025-2030

Chart on The Netherlands - Market size and forecast 2025-2030 ($ million)
Data Table on The Netherlands - Market size and forecast 2025-2030 ($ million)
Chart on The Netherlands - Year-over-year growth 2025-2030 (%)
Data Table on The Netherlands - Year-over-year growth 2025-2030 (%)

12.6 South America - Market size and forecast 2025-2030

Chart on South America - Market size and forecast 2025-2030 ($ million)
Data Table on South America - Market size and forecast 2025-2030 ($ million)
Chart on South America - Year-over-year growth 2025-2030 (%)
Data Table on South America - Year-over-year growth 2025-2030 (%)
Chart on Regional Comparison - South America
Data Table on Regional Comparison - South America

12.6.1 Brazil - Market size and forecast 2025-2030

Chart on Brazil - Market size and forecast 2025-2030 ($ million)
Data Table on Brazil - Market size and forecast 2025-2030 ($ million)
Chart on Brazil - Year-over-year growth 2025-2030 (%)
Data Table on Brazil - Year-over-year growth 2025-2030 (%)

12.6.2 Argentina - Market size and forecast 2025-2030

Chart on Argentina - Market size and forecast 2025-2030 ($ million)
Data Table on Argentina - Market size and forecast 2025-2030 ($ million)
Chart on Argentina - Year-over-year growth 2025-2030 (%)
Data Table on Argentina - Year-over-year growth 2025-2030 (%)

12.6.3 Chile - Market size and forecast 2025-2030

Chart on Chile - Market size and forecast 2025-2030 ($ million)
Data Table on Chile - Market size and forecast 2025-2030 ($ million)
Chart on Chile - Year-over-year growth 2025-2030 (%)
Data Table on Chile - Year-over-year growth 2025-2030 (%)

12.7 Middle East and Africa - Market size and forecast 2025-2030

Chart on Middle East and Africa - Market size and forecast 2025-2030 ($ million)
Data Table on Middle East and Africa - Market size and forecast 2025-2030 ($ million)
Chart on Middle East and Africa - Year-over-year growth 2025-2030 (%)
Data Table on Middle East and Africa - Year-over-year growth 2025-2030 (%)
Chart on Regional Comparison - Middle East and Africa
Data Table on Regional Comparison - Middle East and Africa

12.7.1 Saudi Arabia - Market size and forecast 2025-2030

Chart on Saudi Arabia - Market size and forecast 2025-2030 ($ million)
Data Table on Saudi Arabia - Market size and forecast 2025-2030 ($ million)
Chart on Saudi Arabia - Year-over-year growth 2025-2030 (%)
Data Table on Saudi Arabia - Year-over-year growth 2025-2030 (%)

12.7.2 UAE - Market size and forecast 2025-2030

Chart on UAE - Market size and forecast 2025-2030 ($ million)
Data Table on UAE - Market size and forecast 2025-2030 ($ million)
Chart on UAE - Year-over-year growth 2025-2030 (%)
Data Table on UAE - Year-over-year growth 2025-2030 (%)

12.7.3 South Africa - Market size and forecast 2025-2030

Chart on South Africa - Market size and forecast 2025-2030 ($ million)
Data Table on South Africa - Market size and forecast 2025-2030 ($ million)
Chart on South Africa - Year-over-year growth 2025-2030 (%)
Data Table on South Africa - Year-over-year growth 2025-2030 (%)

12.7.4 Turkey - Market size and forecast 2025-2030

Chart on Turkey - Market size and forecast 2025-2030 ($ million)
Data Table on Turkey - Market size and forecast 2025-2030 ($ million)
Chart on Turkey - Year-over-year growth 2025-2030 (%)
Data Table on Turkey - Year-over-year growth 2025-2030 (%)

12.7.5 Israel - Market size and forecast 2025-2030

Chart on Israel - Market size and forecast 2025-2030 ($ million)
Data Table on Israel - Market size and forecast 2025-2030 ($ million)
Chart on Israel - Year-over-year growth 2025-2030 (%)
Data Table on Israel - Year-over-year growth 2025-2030 (%)

12.8 Market opportunity by geography

Market opportunity by geography ($ million)
Data Tables on Market opportunity by geography ($ million)

13. Drivers, Challenges, and Opportunity

13.1 Market drivers

Parental awareness of childhood foot health and biomechanical development
Proliferation of active lifestyles and rising youth participation in organized sports
High-impact character licensing and multi-industry collaborative branding partnerships

13.2 Market challenges

Accelerating electronic commerce fraud and counterfeit distribution
Extreme raw material volatility and macroeconomic inflationary fractures
Escalating regulatory compliance burdens and stringent material contamination standards

13.3 Impact of drivers and challenges

Impact of drivers and challenges in 2025 and 2030

13.4 Market opportunities

Premium orthopedic and podiatric health features
Acceleration of material and design sustainable
Surge in athletic participation and sportswear functionality

14. Competitive Landscape

14.1 Overview

14.2

Overview on criticality of inputs and factors of differentiation

14.3 Landscape disruption

Overview on factors of disruption

14.4 Industry risks

Impact of key risks on business

15. Competitive Analysis

15.1 Companies profiled

Companies covered

15.2 Company ranking index

15.3 Market positioning of companies

Matrix on companies position and classification

15.4 Adidas AG

Adidas AG - Overview
Adidas AG - Business segments
Adidas AG - Key offerings
Adidas AG - Segment focus
SWOT

15.5 ASICS Corp.

ASICS Corp. - Overview
ASICS Corp. - Business segments
ASICS Corp. - Key offerings
ASICS Corp. - Segment focus
SWOT

15.6 Bata Corp.

Bata Corp. - Overview
Bata Corp. - Product / Service
Bata Corp. - Key offerings
SWOT

15.7 C and J Clark International Ltd.

C and J Clark International Ltd. - Overview
C and J Clark International Ltd. - Product / Service
C and J Clark International Ltd. - Key offerings
SWOT

15.8 Crocs Inc.

Crocs Inc. - Overview
Crocs Inc. - Business segments
Crocs Inc. - Key offerings
Crocs Inc. - Segment focus
SWOT

15.9 ECCO USA Inc.

ECCO USA Inc. - Overview
ECCO USA Inc. - Product / Service
ECCO USA Inc. - Key offerings
SWOT

15.10 Falc S.p.A

Falc S.p.A - Overview
Falc S.p.A - Product / Service
Falc S.p.A - Key offerings
SWOT

15.11 Geox S.p.A

Geox S.p.A - Overview
Geox S.p.A - Business segments
Geox S.p.A - Key offerings
Geox S.p.A - Segment focus
SWOT

15.12 IMAC S.p.A.

IMAC S.p.A. - Overview
IMAC S.p.A. - Product / Service
IMAC S.p.A. - Key offerings
SWOT

15.13 New Balance Athletics Inc.

New Balance Athletics Inc. - Overview
New Balance Athletics Inc. - Product / Service
New Balance Athletics Inc. - Key offerings
SWOT

15.14 Nike Inc.

Nike Inc. - Overview
Nike Inc. - Business segments
Nike Inc. - Key offerings
Nike Inc. - Segment focus
SWOT

15.15 PUMA SE

PUMA SE - Overview
PUMA SE - Business segments
PUMA SE - Key news
PUMA SE - Key offerings
PUMA SE - Segment focus
SWOT

15.16 Skechers USA Inc.

Skechers USA Inc. - Overview
Skechers USA Inc. - Product / Service
Skechers USA Inc. - Key offerings
SWOT

15.17 Under Armour Inc.

Under Armour Inc. - Overview
Under Armour Inc. - Business segments
Under Armour Inc. - Key offerings
Under Armour Inc. - Segment focus
SWOT

15.18 Vans Inc.

Vans Inc. - Overview
Vans Inc. - Product / Service
Vans Inc. - Key offerings
SWOT

16. Appendix

16.1 Scope of the report

Market definition
Objectives
Notes and caveats

16.2 Inclusions and exclusions checklist

Inclusions checklist
Exclusions checklist

16.3 Currency conversion rates for US$

16.4 Research methodology

16.5 Data procurement

Information sources

16.6 Data validation

16.7 Validation techniques employed for market sizing

16.8 Data synthesis

16.9 360 degree market analysis

16.10 List of abbreviations

Research Methodology

Technavio presents a detailed picture of the market by way of study, synthesis, and summation of data from multiple sources. The analysts have presented the various facets of the market with a particular focus on identifying the key industry influencers. The data thus presented is comprehensive, reliable, and the result of extensive research, both primary and secondary.

INFORMATION SOURCES

Primary sources

  • Manufacturers and suppliers
  • Channel partners
  • Industry experts
  • Strategic decision makers

Secondary sources

  • Industry journals and periodicals
  • Government data
  • Financial reports of key industry players
  • Historical data
  • Press releases

DATA ANALYSIS

Data Synthesis

  • Collation of data
  • Estimation of key figures
  • Analysis of derived insights

Data Validation

  • Triangulation with data models
  • Reference against proprietary databases
  • Corroboration with industry experts

REPORT WRITING

Qualitative

  • Market drivers
  • Market challenges
  • Market trends
  • Five forces analysis

Quantitative

  • Market size and forecast
  • Market segmentation
  • Geographical insights
  • Competitive landscape

Interested in this report?

Get your sample now to see our research methodology and insights!

Download Now

Frequently Asked Questions

Childrens Footwear market growth will increase by USD 20743.6 million during 2026-2030.

The Childrens Footwear market is expected to grow at a CAGR of 5.6% during 2026-2030.

Childrens Footwear market is segmented by Product (Non athletic footwear, Athletic footwear) Distribution channel (Offline, Online) Material (Synthetic, Leather, Textile)

Adidas AG, ASICS Corp., Bata Corp., Bobux International Ltd., C and J Clark International Ltd., Carters Inc., Crocs Inc., ECCO USA Inc., Falc S.p.A, Geox S.p.A, IMAC S.p.A., KEEN Inc., New Balance Athletics Inc., Nike Inc., Pediped Footwear, PUMA SE, See Kai Run, Skechers USA Inc., Under Armour Inc., Vans Inc. are a few of the key vendors in the Childrens Footwear market.

APAC will register the highest growth rate of 37.6% among the other regions. Therefore, the Childrens Footwear market in APAC is expected to garner significant business opportunities for the vendors during the forecast period.

China, India, Japan, South Korea, Australia, Indonesia, US, Canada, Mexico, Germany, UK, France, Italy, Spain, The Netherlands, Brazil, Argentina, Chile, Saudi Arabia, UAE, South Africa, Turkey, Israel

  • Parental awareness of childhood foot health and biomechanical development is the driving factor this market.

The Childrens Footwear market vendors should focus on grabbing business opportunities from the Product segment as it accounted for the largest market share in the base year.
RIA - Research AI Assistant
Ask RIA
