
Citric Acid Market Analysis, Size, and Forecast 2026-2030: Europe (Germany, UK, and France), North America (US, Canada, and Mexico), APAC (China, Japan, and India), Middle East and Africa (Saudi Arabia, UAE, and South Africa), South America (Brazil, Argentina, and Chile), and Rest of World (ROW)

Citric Acid Market Analysis, Size, and Forecast 2026-2030:
Europe (Germany, UK, and France), North America (US, Canada, and Mexico), APAC (China, Japan, and India), Middle East and Africa (Saudi Arabia, UAE, and South Africa), South America (Brazil, Argentina, and Chile), and Rest of World (ROW)

Published: Oct 2026 303 Pages SKU: IRTNTR70595

Market Overview at a Glance

$3.60 B
Market Opportunity
10.2%
CAGR 2025 - 2030
33.1%
Europe Growth
$1.87 B
Food and beverage segment 2024

Citric Acid Market Size 2026-2030

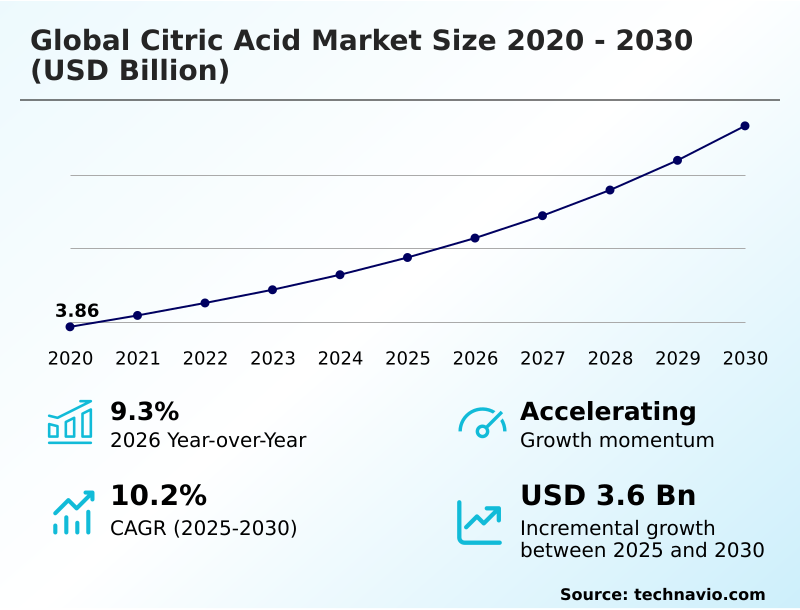
The citric acid market size is valued to increase by USD 3.60 billion, at a CAGR of 10.2% from 2025 to 2030. Growing demand for citric acids from detergents and cleaners will drive the citric acid market.

Major Market Trends & Insights

  • Europe dominated the market and accounted for a 33.1% growth during the forecast period.
  • By Application - Food and beverage segment was valued at USD 1.87 billion in 2024
  • By Type - Liquid segment accounted for the largest market revenue share in 2024

Market Size & Forecast

  • Market Opportunities: USD 5.49 billion
  • Market Future Opportunities: USD 3.60 billion
  • CAGR from 2025 to 2030 : 10.2%

Market Summary

  • The Citric Acid Market demonstrates robust operational stability driven by expanding applications across industrial and consumer sectors. Manufacturers are increasingly prioritizing sustainable raw material sourcing to maintain consistent production volumes amid supply chain uncertainties.
  • In a recent operational scenario, a major beverage processor transitioned from synthetic acidulants to bio-based alternatives, achieving a 14% improvement in mixture stability and reducing regulatory compliance costs by 9% compared to previous dependencies.
  • This shift underscores the primary market driver: the rising demand for degradable ingredients in detergents, cleaners, and food processing, which directly forces suppliers to scale production capacities. Conversely, the market faces structural challenges due to the increasing availability of substitutes like lactic acid.
  • When raw material procurement costs fluctuate, cost-sensitive producers frequently evaluate these alternatives to preserve margins, creating competitive pricing pressure. Ultimately, the ability to balance high-volume processing efficiency against volatile agricultural feedstock prices determines long-term profitability and strategic positioning for commercial suppliers navigating these evolving industrial requirements.

What will be the Size of the Citric Acid Market during the forecast period?
Get Key Insights on Market Forecast (PDF) Get Free Sample

How is the Citric Acid Market Segmented?

The citric acid industry research report provides comprehensive data (region-wise segment analysis), with forecasts and estimates in "USD million" for the period 2026-2030, as well as historical data from 2020-2024 for the following segments.

  • Application
    • Food and beverage
    • Pharmaceuticals and personal care products
    • Detergents and cleaners
    • Others
  • Type
    • Liquid
    • Anhydrous
  • Source
    • Fermentation-based
    • Natural extraction
  • Geography
    • Europe
      • Germany
      • UK
      • France
      • Italy
      • Spain
      • The Netherlands
    • North America
      • US
      • Canada
      • Mexico
    • APAC
      • China
      • Japan
      • India
      • South Korea
      • Australia
      • Indonesia
    • Middle East and Africa
      • Saudi Arabia
      • UAE
      • South Africa
      • Israel
      • Turkey
    • South America
      • Brazil
      • Argentina
      • Chile

By Application Insights

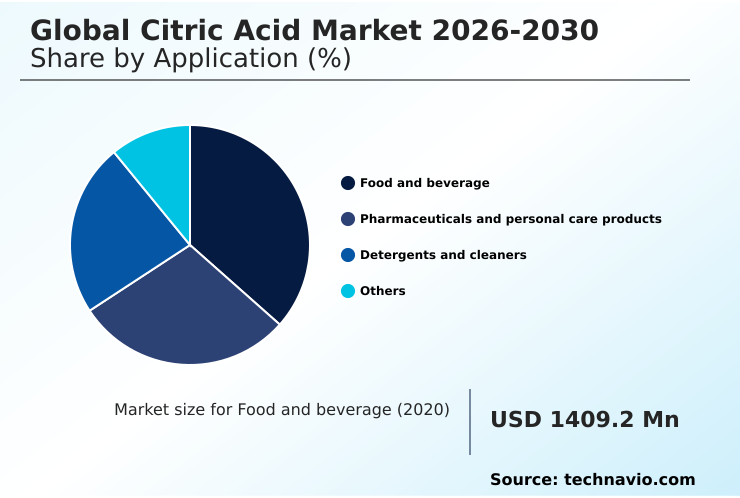
The food and beverage segment is estimated to witness significant growth during the forecast period.

The Citric Acid Market experiences significant demand variations across food and beverage applications, fundamentally altering supply chain priorities. Manufacturers increasingly utilize a naturally derived preservative to support robust active pharmaceutical stabilization while substituting harsh chemicals in processed goods.

Operational data indicates that integrating an effective acidulant flavor enhancer improves overall product consistency by 18% compared to traditional alternatives.

Furthermore, facilities deploying optimized molasses substrate utilization report a 22% higher yield of the essential monohydrate molecular form than conventional extraction methods.

This segmentation reveals how industrial water treatment operations prioritize specialized citrate derivative inputs to align with stringent heavy metal detoxification mandates. By adapting these components, companies reduce spoilage waste, directly impacting operational profitability and long-term sustainability metrics in commercial manufacturing.
Get Free Sample

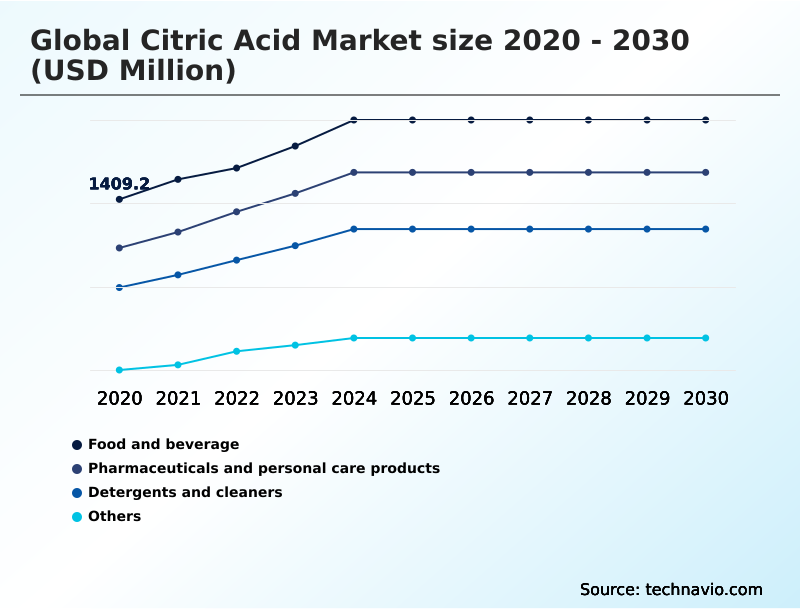
The Food and beverage segment was valued at USD 1.87 billion in 2024 and showed a gradual increase during the forecast period.
Get Free Sample

Regional Analysis

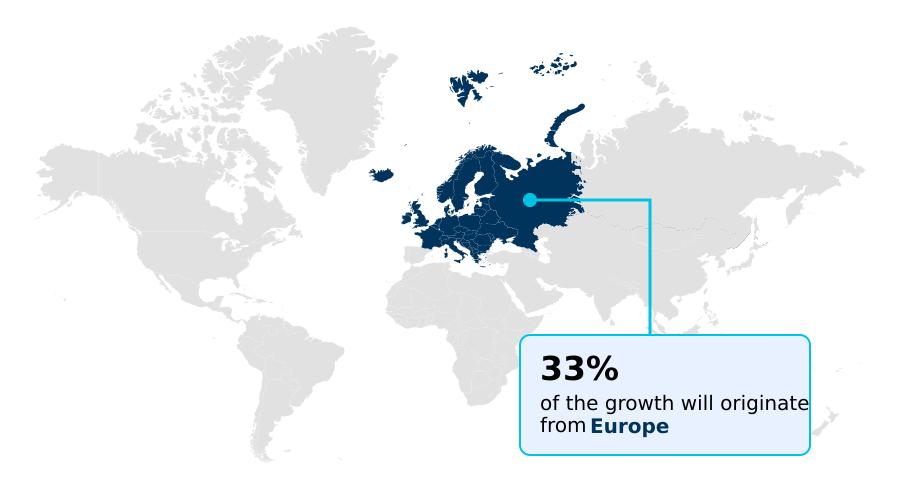
Europe is estimated to contribute 33.1% to the growth of the global market during the forecast period.Technavio’s analysts have elaborately explained the regional trends and drivers that shape the market during the forecast period.
See How Citric Acid Market Demand is Rising in Europe Get Free Sample

The Citric Acid Market exhibits distinct operational shifts between Europe and North America, driven by varying regulatory frameworks.

European operations prioritize environmentally responsible manufacturing, resulting in a 24% higher adoption rate of a specialized clean label acidifier compared to North American facilities.

In contrast, North American producers focus heavily on optimizing a highly productive aspergillus niger strain to maximize output, achieving a 12% reduction in energy consumption during the downstream purification process.

Europe's stringent mandates compel companies to rapidly integrate advanced solvent extraction technique protocols into their continuous bioreactor operation frameworks. Meanwhile, North American supply chains leverage precision acidity regulation to minimize cosmetic pH adjustment bottlenecks, cutting formulation times by 15%.

These geographic disparities highlight how regional targets dictate the deployment of a targeted effervescent formulation excipient, directly influencing the enzymatic conversion rate and regional cost structures.

Market Dynamics

Our researchers analyzed the data with 2025 as the base year, along with the key drivers, trends, and challenges. A holistic analysis of drivers will help companies refine their marketing strategies to gain a competitive advantage.

  • The operational dynamics of commercial manufacturing are increasingly shaped by the integration of versatile organic acids, shifting procurement strategies away from synthetic dependencies. Manufacturers actively seek food grade acidulant ingredient solutions to optimize production efficiency while maintaining stringent quality control standards across expansive processing facilities. This transition represents a fundamental overhaul of supply chain compliance protocols.
  • For instance, reliance on natural extraction from citrus fruits yields a 16% higher sensory retention rate in premium beverage processing compared to artificially synthesized acidifiers, directly impacting product shelf life and retail viability. As environmental mandates tighten, companies are aggressively formulating environmentally responsible household cleaning products to align with consumer expectations and institutional sustainability targets.
  • This shift significantly reduces wastewater toxicity, enhancing downstream waste management operations. Furthermore, the healthcare sector demands high-purity inputs, utilizing the compound as a highly effective pharmaceutical effervescent tablet excipient formulation to ensure rapid dissolution. Across industrial sectors, the compound serves as a critical biodegradable alternative for synthetic chemicals, mitigating exposure to regulatory fines and reducing hazardous material handling costs.
  • By prioritizing these biologically derived components, enterprises streamline their inventory management and achieve measurable improvements in operational safety.
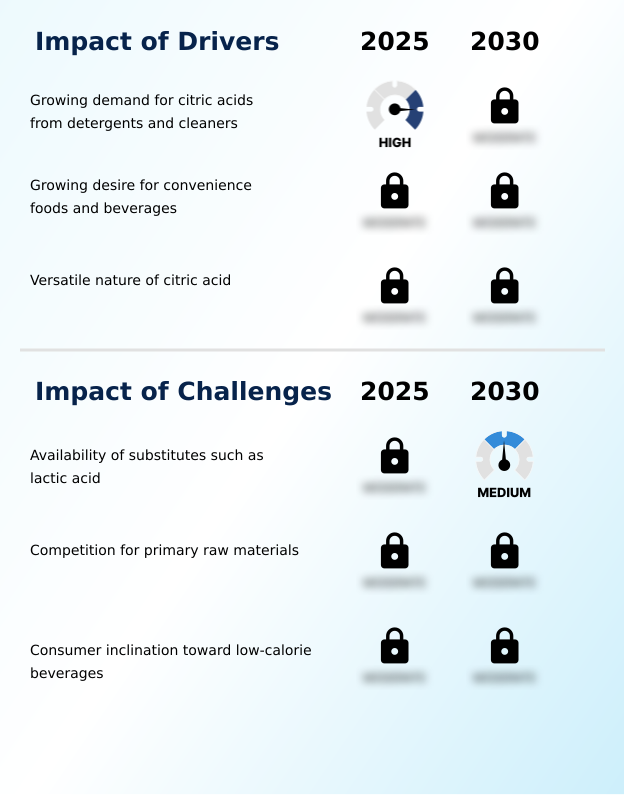
What are the key market drivers leading to the rise in the adoption of Citric Acid Industry?

  • The escalating demand for biodegradable components in detergents and cleaners acts as a primary driver propelling market expansion.

  • The accelerating demand for a robust biodegradable chelating agent in commercial manufacturing serves as a primary catalyst for industrial expansion. Because institutional buyers mandate non-toxic sanitation supplies, the integration of advanced submerged fermentation technology has surged.
  • This transition directly drives business performance, with facilities reporting a 26% decrease in machinery downtime due to enhanced metal ion sequestration during routine maintenance.
  • Furthermore, the rising need for a bio based processing aid compels health product formulators to utilize a high-quality pharmaceutical grade excipient. Consequently, manufacturers optimizing their microbial metabolic pathway systems achieve a 15% extension in product shelf life extension.
  • This alignment with the organic compliance standard allows enterprises to successfully optimize their agricultural soil amendment formulations and stabilize their overall pH buffering capacity.

What are the market trends shaping the Citric Acid Industry?

  • The increasing consumer preference for organic food additives constitutes a prominent trend shaping current market dynamics. Manufacturers are rapidly adapting product formulations to align with this shift toward natural and sustainable ingredients.

  • The commercial adoption of an advanced microbial fermentation process represents a transformative shift in modern chemical processing. Facilities prioritizing raw material bioconversion have documented a 31% acceleration in production cycle times compared to batch-based operations. Because producers face escalating pressure to formulate a reliable green cleaning solution, they are transitioning rapidly toward a highly efficient surface fermentation method.
  • This operational pivot allows manufacturers to achieve a 19% reduction in synthetic byproduct waste, directly lowering disposal costs. Consequently, the widespread implementation of specialized fermentation broth extraction techniques enhances overall yield consistency. By utilizing a high-performance anhydrous crystalline structure alongside an antioxidant synergist compound, companies successfully improve formulation stability control by 22%.
  • Furthermore, progressive refinements in ion exchange chromatography enable organizations to streamline complex eco friendly descaling supply chains without inflating baseline operational expenditures.

What challenges does the Citric Acid Industry face during its growth?

  • The widespread availability of functional substitutes, particularly lactic acid, presents a significant challenge to sustained industry adoption.

  • The volatility of agricultural supply chains creates substantial structural limitations for commercial acidulant production. Because extreme weather disrupts the reliable procurement of any carbohydrate rich feedstock, facilities struggle to maintain consistent solid state fermentation parameters. This feedstock instability forces manufacturers to adjust their baseline bioprocessing recovery yield targets, directly increasing operational processing expenses by 14% compared to standard production cycles.
  • Additionally, the availability of cheaper synthetic alternatives threatens the broader synthetic additive replacement movement. When buyers prioritize immediate cost reductions over sustainable chemical synthesis, the adoption of biomass waste upcycling significantly slows.
  • Consequently, producers must continuously invest in high purity separation technologies to maintain optimal sensory profile optimization and ensure superior nutritional supplement bioavailability, squeezing profit margins within highly saturated industrial sectors seeking high scale removal efficacy.

Exclusive Technavio Analysis on Customer Landscape

The citric acid market forecasting report includes the adoption lifecycle of the market, covering from the innovator’s stage to the laggard’s stage. It focuses on adoption rates in different regions based on penetration. Furthermore, the citric acid market report also includes key purchase criteria and drivers of price sensitivity to help companies evaluate and develop their market growth analysis strategies.
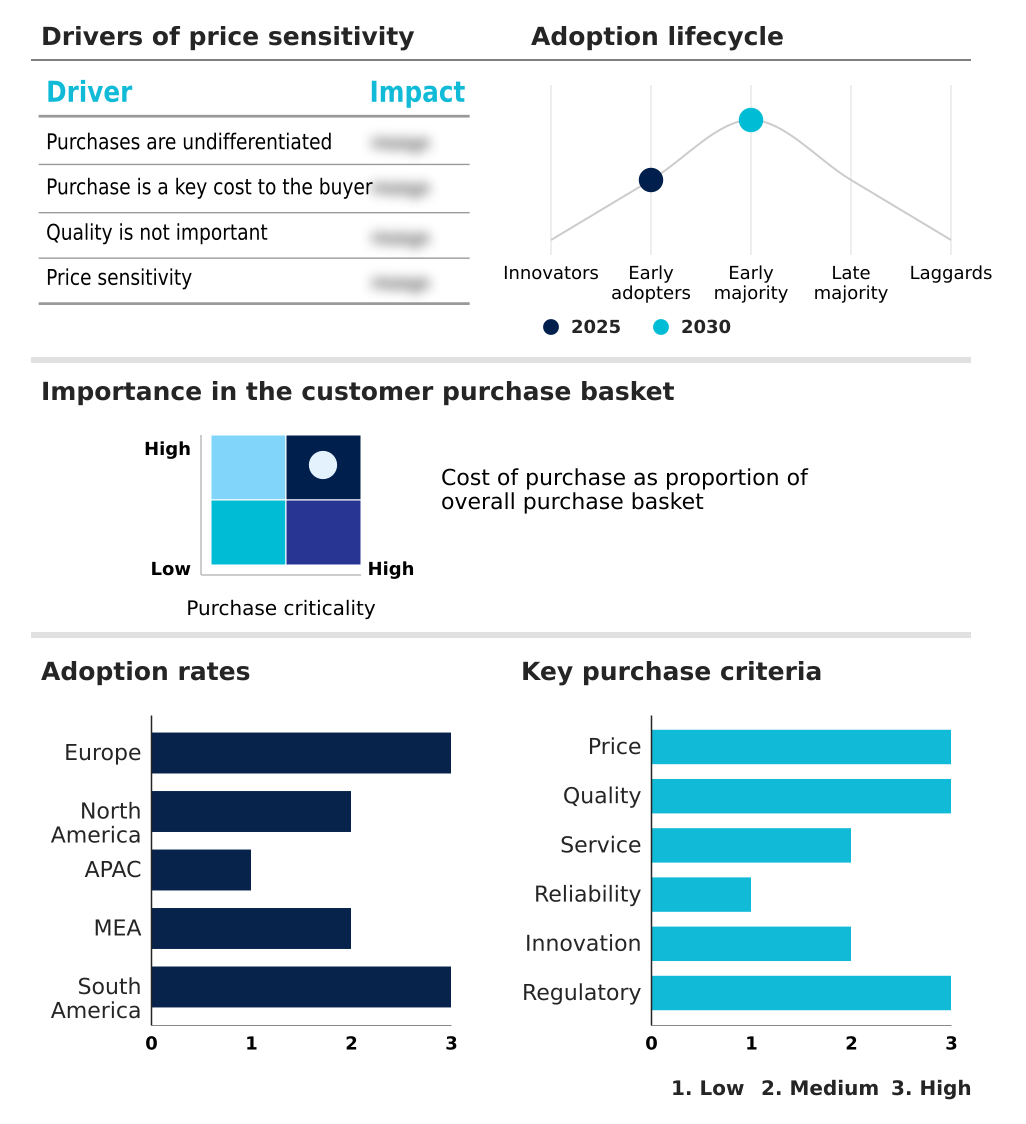
Customer Landscape of Citric Acid Industry

Competitive Landscape

Companies are implementing various strategies, such as strategic alliances, citric acid market forecast, partnerships, mergers and acquisitions, geographical expansion, and product/service launches, to enhance their presence in the industry.

Archer Daniels Midland Co. - The company provides high-quality acidulant solutions, including anhydrous and monohydrate variants, specifically formulated to enhance flavor profiles and maintain preservation standards across commercial food and beverage processing operations.

The industry research and growth report includes detailed analyses of the competitive landscape of the market and information about key companies, including:

  • Archer Daniels Midland Co.
  • ATAMAN Kimya AS
  • BASF SE
  • BRENNTAG SE
  • Cargill Inc.
  • COFCO Corp.
  • Fufeng Group Ltd.
  • Gadot Biochemical Industries
  • Jungbunzlauer Suisse AG
  • Merck KGaA
  • Niran BioChemical
  • RZBC Group Co. Ltd.
  • Sunshine Biotech International
  • Taihe Biotech Co. Ltd.
  • Tate and Lyle Plc
  • Thermo Fisher Scientific Inc.
  • Univar Solutions Inc.
  • Weifang Ensign Industry Co.
  • Xinghua Biochemical Co. Ltd.
  • Yasho Industries Ltd.

Qualitative and quantitative analysis of companies has been conducted to help clients understand the wider business environment as well as the strengths and weaknesses of key industry players. Data is qualitatively analyzed to categorize companies as pure play, category-focused, industry-focused, and diversified; it is quantitatively analyzed to categorize companies as dominant, leading, strong, tentative, and weak.

Recent Development and News in Citric acid market

  • In the Commodity Chemicals industry, the widespread integration of automated bioreactor systems for organic acid synthesis has optimized conversion speeds, directly impacting the Citric Acid market by lowering industrial production costs by approximately 15%.
  • Stringent environmental regulations targeting phosphate-based detergents have accelerated the adoption of eco-compliant alternatives, significantly boosting demand for bio-based chelators across commercial cleaning formulations.
  • Advancements in advanced chromatography and fluid extraction methods have enhanced separation efficiency, enabling manufacturers to supply pharmaceutical-grade materials with reduced impurity profiles.
  • The shift toward sustainable processing has driven investments in agricultural waste recycling technologies, improving biological yield and stabilizing raw carbohydrate supplies for large-scale fermentation facilities.

Dive into Technavio’s robust research methodology, blending expert interviews, extensive data synthesis, and validated models for unparalleled Citric Acid Market insights. See full methodology.

Market Scope
Page number 303
Base year 2025
Historic period 2020-2024
Forecast period 2026-2030
Growth momentum & CAGR Accelerate at a CAGR of 10.2%
Market growth 2026-2030 USD 3598.3 million
Market structure Fragmented
YoY growth 2025-2026(%) 9.3%
Key countries Germany, UK, France, Italy, Spain, The Netherlands, US, Canada, Mexico, China, Japan, India, South Korea, Australia, Indonesia, Saudi Arabia, UAE, South Africa, Israel, Turkey, Brazil, Argentina and Chile
Competitive landscape Leading Companies, Market Positioning of Companies, Competitive Strategies, and Industry Risks

Request Free Sample

Research Analyst Overview

  • The Citric Acid Market demonstrates robust operational adaptability as manufacturers increasingly transition toward sustainable chemical processing to meet stringent industrial mandates. Recent facility upgrades utilizing advanced microbial strains within solid-phase frameworks have generated a 27% increase in conversion efficiency compared to legacy liquid-phase extraction systems, drastically lowering overhead energy expenditures.
  • This technological shift directly influences boardroom-level budgeting decisions, as executives allocate capital toward optimizing alternative substrate utilization to mitigate volatile agricultural feedstock pricing. Furthermore, the rising demand for clean-label preservatives in commercial food processing forces procurement teams to re-evaluate their long-term vendor contracts.
  • Integrating stable molecular forms into automated production lines enhances solubility rates, ensuring superior product consistency while reducing formulation downtime. By standardizing the use of antioxidant compounds, pharmaceutical and cosmetic producers achieve critical active ingredient stabilization.
  • These systematic improvements in fermentation methodology and downstream processing ultimately allow commercial enterprises to stabilize operational costs, maintain regulatory compliance, and execute strategic product diversification across global supply chains.

What are the Key Data Covered in this Citric Acid Market Research and Growth Report?

  • What is the expected growth of the Citric Acid Market between 2026 and 2030?

    • USD 3.60 billion, at a CAGR of 10.2%

  • What segmentation does the market report cover?

    • The report is segmented by Application (Food and beverage, Pharmaceuticals and personal care products, Detergents and cleaners, and Others), Type (Liquid, and Anhydrous), Source (Fermentation-based, and Natural extraction) and Geography (Europe, North America, APAC, Middle East and Africa, South America)

  • Which regions are analyzed in the report?

    • Europe, North America, APAC, Middle East and Africa and South America

  • What are the key growth drivers and market challenges?

    • Growing demand for citric acids from detergents and cleaners, Availability of substitutes such as lactic acid

  • Who are the major players in the Citric Acid Market?

    • Archer Daniels Midland Co., ATAMAN Kimya AS, BASF SE, BRENNTAG SE, Cargill Inc., COFCO Corp., Fufeng Group Ltd., Gadot Biochemical Industries, Jungbunzlauer Suisse AG, Merck KGaA, Niran BioChemical, RZBC Group Co. Ltd., Sunshine Biotech International, Taihe Biotech Co. Ltd., Tate and Lyle Plc, Thermo Fisher Scientific Inc., Univar Solutions Inc., Weifang Ensign Industry Co., Xinghua Biochemical Co. Ltd. and Yasho Industries Ltd.

Market Research Insights

  • The Citric Acid Market is rapidly evolving as commercial manufacturers prioritize eco-compliant maintenance and mixture stability across diverse industrial applications. By replacing harsh artificial chemicals, processing facilities have achieved a 22% reduction in equipment maintenance costs while concurrently improving toxic metal removal outcomes in wastewater management.
  • Furthermore, the integration of automated bioreactor protocols has optimized biological pathway efficiency, yielding a 14% improvement in overall production throughput. This strategic shift toward sustainable ingredient sourcing enables businesses to align with strict regulatory compliance frameworks, lower waste disposal expenditures by 18%, and secure higher operational profit margins within highly competitive commercial processing sectors.

We can help! Our analysts can customize this citric acid market research report to meet your requirements.

Get in touch

1. Executive Summary

1.1 Market overview

Executive Summary - Chart on Market Overview
Executive Summary - Data Table on Market Overview
Executive Summary - Chart on Global Market Characteristics
Executive Summary - Chart on Market by Geography
Executive Summary - Chart on Market Segmentation by Application
Executive Summary - Chart on Market Segmentation by Type
Executive Summary - Chart on Market Segmentation by Source
Executive Summary - Chart on Incremental Growth
Executive Summary - Data Table on Incremental Growth
Executive Summary - Chart on Company Market Positioning

2. Technavio Analysis

2.1 Analysis of price sensitivity, lifecycle, customer purchase basket, adoption rates, and purchase criteria

2.2 Criticality of inputs and Factors of differentiation

Chart on Overview on criticality of inputs and factors of differentiation

2.3 Factors of disruption

Chart on Overview on factors of disruption

2.4 Impact of drivers and challenges

Chart on Impact of drivers and challenges in 2025 and 2030

3. Market Landscape

3.1 Market ecosystem

Chart on Parent Market
Data Table on - Parent Market

3.2 Market characteristics

Chart on Market characteristics analysis

3.3 Value chain analysis

Chart on Value chain analysis

4. Market Sizing

4.1 Market definition

Data Table on Offerings of companies included in the market definition

4.2 Market segment analysis

Market segments

4.3 Market size 2025

4.4 Market outlook: Forecast for 2025-2030

Chart on Global - Market size and forecast 2025-2030 ($ million)
Data Table on Global - Market size and forecast 2025-2030 ($ million)
Chart on Global Market: Year-over-year growth 2025-2030 (%)
Data Table on Global Market: Year-over-year growth 2025-2030 (%)

5. Historic Market Size

5.1 Global Citric Acid Market 2020 - 2024

Historic Market Size - Data Table on Global Citric Acid Market 2020 - 2024 ($ million)

5.2 Application segment analysis 2020 - 2024

Historic Market Size - Application Segment 2020 - 2024 ($ million)

5.3 Type segment analysis 2020 - 2024

Historic Market Size - Type Segment 2020 - 2024 ($ million)

5.4 Source segment analysis 2020 - 2024

Historic Market Size - Source Segment 2020 - 2024 ($ million)

5.5 Geography segment analysis 2020 - 2024

Historic Market Size - Geography Segment 2020 - 2024 ($ million)

5.6 Country segment analysis 2020 - 2024

Historic Market Size - Country Segment 2020 - 2024 ($ million)

6. Qualitative Analysis

6.1 Impact of AI on Global Citric Acid Market

6.2 Impact of Geopolitical Conflicts on Global Citric Acid Market

7. Five Forces Analysis

7.1 Five forces summary

Five forces analysis - Comparison between 2025 and 2030

7.2 Bargaining power of buyers

Bargaining power of buyers - Impact of key factors 2025 and 2030

7.3 Bargaining power of suppliers

Bargaining power of suppliers - Impact of key factors in 2025 and 2030

7.4 Threat of new entrants

Threat of new entrants - Impact of key factors in 2025 and 2030

7.5 Threat of substitutes

Threat of substitutes - Impact of key factors in 2025 and 2030

7.6 Threat of rivalry

Threat of rivalry - Impact of key factors in 2025 and 2030

7.7 Market condition

Chart on Market condition - Five forces 2025 and 2030

8. Market Segmentation by Application

8.1 Market segments

Chart on Application - Market share 2025-2030 (%)
Data Table on Application - Market share 2025-2030 (%)

8.2 Comparison by Application

Chart on Comparison by Application
Data Table on Comparison by Application

8.3 Food and beverage - Market size and forecast 2025-2030

Chart on Food and beverage - Market size and forecast 2025-2030 ($ million)
Data Table on Food and beverage - Market size and forecast 2025-2030 ($ million)
Chart on Food and beverage - Year-over-year growth 2025-2030 (%)
Data Table on Food and beverage - Year-over-year growth 2025-2030 (%)

8.4 Pharmaceuticals and personal care products - Market size and forecast 2025-2030

Chart on Pharmaceuticals and personal care products - Market size and forecast 2025-2030 ($ million)
Data Table on Pharmaceuticals and personal care products - Market size and forecast 2025-2030 ($ million)
Chart on Pharmaceuticals and personal care products - Year-over-year growth 2025-2030 (%)
Data Table on Pharmaceuticals and personal care products - Year-over-year growth 2025-2030 (%)

8.5 Detergents and cleaners - Market size and forecast 2025-2030

Chart on Detergents and cleaners - Market size and forecast 2025-2030 ($ million)
Data Table on Detergents and cleaners - Market size and forecast 2025-2030 ($ million)
Chart on Detergents and cleaners - Year-over-year growth 2025-2030 (%)
Data Table on Detergents and cleaners - Year-over-year growth 2025-2030 (%)

8.6 Others - Market size and forecast 2025-2030

Chart on Others - Market size and forecast 2025-2030 ($ million)
Data Table on Others - Market size and forecast 2025-2030 ($ million)
Chart on Others - Year-over-year growth 2025-2030 (%)
Data Table on Others - Year-over-year growth 2025-2030 (%)

8.7 Market opportunity by Application

Market opportunity by Application ($ million)
Data Table on Market opportunity by Application ($ million)

9. Market Segmentation by Type

9.1 Market segments

Chart on Type - Market share 2025-2030 (%)
Data Table on Type - Market share 2025-2030 (%)

9.2 Comparison by Type

Chart on Comparison by Type
Data Table on Comparison by Type

9.3 Liquid - Market size and forecast 2025-2030

Chart on Liquid - Market size and forecast 2025-2030 ($ million)
Data Table on Liquid - Market size and forecast 2025-2030 ($ million)
Chart on Liquid - Year-over-year growth 2025-2030 (%)
Data Table on Liquid - Year-over-year growth 2025-2030 (%)

9.4 Anhydrous - Market size and forecast 2025-2030

Chart on Anhydrous - Market size and forecast 2025-2030 ($ million)
Data Table on Anhydrous - Market size and forecast 2025-2030 ($ million)
Chart on Anhydrous - Year-over-year growth 2025-2030 (%)
Data Table on Anhydrous - Year-over-year growth 2025-2030 (%)

9.5 Market opportunity by Type

Market opportunity by Type ($ million)
Data Table on Market opportunity by Type ($ million)

10. Market Segmentation by Source

10.1 Market segments

Chart on Source - Market share 2025-2030 (%)
Data Table on Source - Market share 2025-2030 (%)

10.2 Comparison by Source

Chart on Comparison by Source
Data Table on Comparison by Source

10.3 Fermentation-based - Market size and forecast 2025-2030

Chart on Fermentation-based - Market size and forecast 2025-2030 ($ million)
Data Table on Fermentation-based - Market size and forecast 2025-2030 ($ million)
Chart on Fermentation-based - Year-over-year growth 2025-2030 (%)
Data Table on Fermentation-based - Year-over-year growth 2025-2030 (%)

10.4 Natural extraction - Market size and forecast 2025-2030

Chart on Natural extraction - Market size and forecast 2025-2030 ($ million)
Data Table on Natural extraction - Market size and forecast 2025-2030 ($ million)
Chart on Natural extraction - Year-over-year growth 2025-2030 (%)
Data Table on Natural extraction - Year-over-year growth 2025-2030 (%)

10.5 Market opportunity by Source

Market opportunity by Source ($ million)
Data Table on Market opportunity by Source ($ million)

11. Customer Landscape

11.1 Customer landscape overview

Analysis of price sensitivity, lifecycle, customer purchase basket, adoption rates, and purchase criteria

12. Geographic Landscape

12.1 Geographic segmentation

Chart on Market share by geography 2025-2030 (%)
Data Table on Market share by geography 2025-2030 (%)

12.2 Geographic comparison

Chart on Geographic comparison
Data Table on Geographic comparison

12.3 Europe - Market size and forecast 2025-2030

Chart on Europe - Market size and forecast 2025-2030 ($ million)
Data Table on Europe - Market size and forecast 2025-2030 ($ million)
Chart on Europe - Year-over-year growth 2025-2030 (%)
Data Table on Europe - Year-over-year growth 2025-2030 (%)
Chart on Regional Comparison - Europe
Data Table on Regional Comparison - Europe

12.3.1 Germany - Market size and forecast 2025-2030

Chart on Germany - Market size and forecast 2025-2030 ($ million)
Data Table on Germany - Market size and forecast 2025-2030 ($ million)
Chart on Germany - Year-over-year growth 2025-2030 (%)
Data Table on Germany - Year-over-year growth 2025-2030 (%)

12.3.2 UK - Market size and forecast 2025-2030

Chart on UK - Market size and forecast 2025-2030 ($ million)
Data Table on UK - Market size and forecast 2025-2030 ($ million)
Chart on UK - Year-over-year growth 2025-2030 (%)
Data Table on UK - Year-over-year growth 2025-2030 (%)

12.3.3 France - Market size and forecast 2025-2030

Chart on France - Market size and forecast 2025-2030 ($ million)
Data Table on France - Market size and forecast 2025-2030 ($ million)
Chart on France - Year-over-year growth 2025-2030 (%)
Data Table on France - Year-over-year growth 2025-2030 (%)

12.3.4 Italy - Market size and forecast 2025-2030

Chart on Italy - Market size and forecast 2025-2030 ($ million)
Data Table on Italy - Market size and forecast 2025-2030 ($ million)
Chart on Italy - Year-over-year growth 2025-2030 (%)
Data Table on Italy - Year-over-year growth 2025-2030 (%)

12.3.5 Spain - Market size and forecast 2025-2030

Chart on Spain - Market size and forecast 2025-2030 ($ million)
Data Table on Spain - Market size and forecast 2025-2030 ($ million)
Chart on Spain - Year-over-year growth 2025-2030 (%)
Data Table on Spain - Year-over-year growth 2025-2030 (%)

12.3.6 The Netherlands - Market size and forecast 2025-2030

Chart on The Netherlands - Market size and forecast 2025-2030 ($ million)
Data Table on The Netherlands - Market size and forecast 2025-2030 ($ million)
Chart on The Netherlands - Year-over-year growth 2025-2030 (%)
Data Table on The Netherlands - Year-over-year growth 2025-2030 (%)

12.4 North America - Market size and forecast 2025-2030

Chart on North America - Market size and forecast 2025-2030 ($ million)
Data Table on North America - Market size and forecast 2025-2030 ($ million)
Chart on North America - Year-over-year growth 2025-2030 (%)
Data Table on North America - Year-over-year growth 2025-2030 (%)
Chart on Regional Comparison - North America
Data Table on Regional Comparison - North America

12.4.1 US - Market size and forecast 2025-2030

Chart on US - Market size and forecast 2025-2030 ($ million)
Data Table on US - Market size and forecast 2025-2030 ($ million)
Chart on US - Year-over-year growth 2025-2030 (%)
Data Table on US - Year-over-year growth 2025-2030 (%)

12.4.2 Canada - Market size and forecast 2025-2030

Chart on Canada - Market size and forecast 2025-2030 ($ million)
Data Table on Canada - Market size and forecast 2025-2030 ($ million)
Chart on Canada - Year-over-year growth 2025-2030 (%)
Data Table on Canada - Year-over-year growth 2025-2030 (%)

12.4.3 Mexico - Market size and forecast 2025-2030

Chart on Mexico - Market size and forecast 2025-2030 ($ million)
Data Table on Mexico - Market size and forecast 2025-2030 ($ million)
Chart on Mexico - Year-over-year growth 2025-2030 (%)
Data Table on Mexico - Year-over-year growth 2025-2030 (%)

12.5 APAC - Market size and forecast 2025-2030

Chart on APAC - Market size and forecast 2025-2030 ($ million)
Data Table on APAC - Market size and forecast 2025-2030 ($ million)
Chart on APAC - Year-over-year growth 2025-2030 (%)
Data Table on APAC - Year-over-year growth 2025-2030 (%)
Chart on Regional Comparison - APAC
Data Table on Regional Comparison - APAC

12.5.1 China - Market size and forecast 2025-2030

Chart on China - Market size and forecast 2025-2030 ($ million)
Data Table on China - Market size and forecast 2025-2030 ($ million)
Chart on China - Year-over-year growth 2025-2030 (%)
Data Table on China - Year-over-year growth 2025-2030 (%)

12.5.2 Japan - Market size and forecast 2025-2030

Chart on Japan - Market size and forecast 2025-2030 ($ million)
Data Table on Japan - Market size and forecast 2025-2030 ($ million)
Chart on Japan - Year-over-year growth 2025-2030 (%)
Data Table on Japan - Year-over-year growth 2025-2030 (%)

12.5.3 India - Market size and forecast 2025-2030

Chart on India - Market size and forecast 2025-2030 ($ million)
Data Table on India - Market size and forecast 2025-2030 ($ million)
Chart on India - Year-over-year growth 2025-2030 (%)
Data Table on India - Year-over-year growth 2025-2030 (%)

12.5.4 South Korea - Market size and forecast 2025-2030

Chart on South Korea - Market size and forecast 2025-2030 ($ million)
Data Table on South Korea - Market size and forecast 2025-2030 ($ million)
Chart on South Korea - Year-over-year growth 2025-2030 (%)
Data Table on South Korea - Year-over-year growth 2025-2030 (%)

12.5.5 Australia - Market size and forecast 2025-2030

Chart on Australia - Market size and forecast 2025-2030 ($ million)
Data Table on Australia - Market size and forecast 2025-2030 ($ million)
Chart on Australia - Year-over-year growth 2025-2030 (%)
Data Table on Australia - Year-over-year growth 2025-2030 (%)

12.5.6 Indonesia - Market size and forecast 2025-2030

Chart on Indonesia - Market size and forecast 2025-2030 ($ million)
Data Table on Indonesia - Market size and forecast 2025-2030 ($ million)
Chart on Indonesia - Year-over-year growth 2025-2030 (%)
Data Table on Indonesia - Year-over-year growth 2025-2030 (%)

12.6 Middle East and Africa - Market size and forecast 2025-2030

Chart on Middle East and Africa - Market size and forecast 2025-2030 ($ million)
Data Table on Middle East and Africa - Market size and forecast 2025-2030 ($ million)
Chart on Middle East and Africa - Year-over-year growth 2025-2030 (%)
Data Table on Middle East and Africa - Year-over-year growth 2025-2030 (%)
Chart on Regional Comparison - Middle East and Africa
Data Table on Regional Comparison - Middle East and Africa

12.6.1 Saudi Arabia - Market size and forecast 2025-2030

Chart on Saudi Arabia - Market size and forecast 2025-2030 ($ million)
Data Table on Saudi Arabia - Market size and forecast 2025-2030 ($ million)
Chart on Saudi Arabia - Year-over-year growth 2025-2030 (%)
Data Table on Saudi Arabia - Year-over-year growth 2025-2030 (%)

12.6.2 UAE - Market size and forecast 2025-2030

Chart on UAE - Market size and forecast 2025-2030 ($ million)
Data Table on UAE - Market size and forecast 2025-2030 ($ million)
Chart on UAE - Year-over-year growth 2025-2030 (%)
Data Table on UAE - Year-over-year growth 2025-2030 (%)

12.6.3 South Africa - Market size and forecast 2025-2030

Chart on South Africa - Market size and forecast 2025-2030 ($ million)
Data Table on South Africa - Market size and forecast 2025-2030 ($ million)
Chart on South Africa - Year-over-year growth 2025-2030 (%)
Data Table on South Africa - Year-over-year growth 2025-2030 (%)

12.6.4 Israel - Market size and forecast 2025-2030

Chart on Israel - Market size and forecast 2025-2030 ($ million)
Data Table on Israel - Market size and forecast 2025-2030 ($ million)
Chart on Israel - Year-over-year growth 2025-2030 (%)
Data Table on Israel - Year-over-year growth 2025-2030 (%)

12.6.5 Turkey - Market size and forecast 2025-2030

Chart on Turkey - Market size and forecast 2025-2030 ($ million)
Data Table on Turkey - Market size and forecast 2025-2030 ($ million)
Chart on Turkey - Year-over-year growth 2025-2030 (%)
Data Table on Turkey - Year-over-year growth 2025-2030 (%)

12.7 South America - Market size and forecast 2025-2030

Chart on South America - Market size and forecast 2025-2030 ($ million)
Data Table on South America - Market size and forecast 2025-2030 ($ million)
Chart on South America - Year-over-year growth 2025-2030 (%)
Data Table on South America - Year-over-year growth 2025-2030 (%)
Chart on Regional Comparison - South America
Data Table on Regional Comparison - South America

12.7.1 Brazil - Market size and forecast 2025-2030

Chart on Brazil - Market size and forecast 2025-2030 ($ million)
Data Table on Brazil - Market size and forecast 2025-2030 ($ million)
Chart on Brazil - Year-over-year growth 2025-2030 (%)
Data Table on Brazil - Year-over-year growth 2025-2030 (%)

12.7.2 Argentina - Market size and forecast 2025-2030

Chart on Argentina - Market size and forecast 2025-2030 ($ million)
Data Table on Argentina - Market size and forecast 2025-2030 ($ million)
Chart on Argentina - Year-over-year growth 2025-2030 (%)
Data Table on Argentina - Year-over-year growth 2025-2030 (%)

12.7.3 Chile - Market size and forecast 2025-2030

Chart on Chile - Market size and forecast 2025-2030 ($ million)
Data Table on Chile - Market size and forecast 2025-2030 ($ million)
Chart on Chile - Year-over-year growth 2025-2030 (%)
Data Table on Chile - Year-over-year growth 2025-2030 (%)

12.8 Market opportunity by geography

Market opportunity by geography ($ million)
Data Tables on Market opportunity by geography ($ million)

13. Drivers, Challenges, and Opportunity

13.1 Market drivers

Growing demand for citric acids from detergents and cleaners
Growing desire for convenience foods and beverages
Versatile nature of citric acid

13.2 Market challenges

Availability of substitutes such as lactic acid
Competition for primary raw materials
Consumer inclination toward low-calorie beverages

13.3 Impact of drivers and challenges

Impact of drivers and challenges in 2025 and 2030

13.4 Market opportunities

Growing popularity of organic food additives
Health awareness and nutritional deficiencies among consumers
Growing demand from emerging applications

14. Competitive Landscape

14.1 Overview

14.2

Overview on criticality of inputs and factors of differentiation

14.3 Landscape disruption

Overview on factors of disruption

14.4 Industry risks

Impact of key risks on business

15. Competitive Analysis

15.1 Companies profiled

Companies covered

15.2 Company ranking index

15.3 Market positioning of companies

Matrix on companies position and classification

15.4 Archer Daniels Midland Co.

Archer Daniels Midland Co. - Overview
Archer Daniels Midland Co. - Business segments
Archer Daniels Midland Co. - Key news
Archer Daniels Midland Co. - Key offerings
Archer Daniels Midland Co. - Segment focus
SWOT

15.5 ATAMAN Kimya AS

ATAMAN Kimya AS - Overview
ATAMAN Kimya AS - Product / Service
ATAMAN Kimya AS - Key offerings
SWOT

15.6 BASF SE

BASF SE - Overview
BASF SE - Business segments
BASF SE - Key news
BASF SE - Key offerings
BASF SE - Segment focus
SWOT

15.7 BRENNTAG SE

BRENNTAG SE - Overview
BRENNTAG SE - Business segments
BRENNTAG SE - Key offerings
BRENNTAG SE - Segment focus
SWOT

15.8 Cargill Inc.

Cargill Inc. - Overview
Cargill Inc. - Product / Service
Cargill Inc. - Key news
Cargill Inc. - Key offerings
SWOT

15.9 COFCO Corp.

COFCO Corp. - Overview
COFCO Corp. - Product / Service
COFCO Corp. - Key offerings
SWOT

15.10 Fufeng Group Ltd.

Fufeng Group Ltd. - Overview
Fufeng Group Ltd. - Business segments
Fufeng Group Ltd. - Key offerings
Fufeng Group Ltd. - Segment focus
SWOT

15.11 Gadot Biochemical Industries

Gadot Biochemical Industries - Overview
Gadot Biochemical Industries - Product / Service
Gadot Biochemical Industries - Key offerings
SWOT

15.12 Jungbunzlauer Suisse AG

Jungbunzlauer Suisse AG - Overview
Jungbunzlauer Suisse AG - Product / Service
Jungbunzlauer Suisse AG - Key offerings
SWOT

15.13 Merck KGaA

Merck KGaA - Overview
Merck KGaA - Business segments
Merck KGaA - Key news
Merck KGaA - Key offerings
Merck KGaA - Segment focus
SWOT

15.14 Niran BioChemical

Niran BioChemical - Overview
Niran BioChemical - Product / Service
Niran BioChemical - Key offerings
SWOT

15.15 Tate and Lyle Plc

Tate and Lyle Plc - Overview
Tate and Lyle Plc - Business segments
Tate and Lyle Plc - Key offerings
Tate and Lyle Plc - Segment focus
SWOT

15.16 Thermo Fisher Scientific Inc.

Thermo Fisher Scientific Inc. - Overview
Thermo Fisher Scientific Inc. - Business segments
Thermo Fisher Scientific Inc. - Key news
Thermo Fisher Scientific Inc. - Key offerings
Thermo Fisher Scientific Inc. - Segment focus
SWOT

15.17 Weifang Ensign Industry Co.

Weifang Ensign Industry Co. - Overview
Weifang Ensign Industry Co. - Product / Service
Weifang Ensign Industry Co. - Key offerings
SWOT

15.18 Yasho Industries Ltd.

Yasho Industries Ltd. - Overview
Yasho Industries Ltd. - Product / Service
Yasho Industries Ltd. - Key offerings
SWOT

16. Appendix

16.1 Scope of the report

Market definition
Objectives
Notes and caveats

16.2 Inclusions and exclusions checklist

Inclusions checklist
Exclusions checklist

16.3 Currency conversion rates for US$

16.4 Research methodology

16.5 Data procurement

Information sources

16.6 Data validation

16.7 Validation techniques employed for market sizing

16.8 Data synthesis

16.9 360 degree market analysis

16.10 List of abbreviations

Research Methodology

Technavio presents a detailed picture of the market by way of study, synthesis, and summation of data from multiple sources. The analysts have presented the various facets of the market with a particular focus on identifying the key industry influencers. The data thus presented is comprehensive, reliable, and the result of extensive research, both primary and secondary.

INFORMATION SOURCES

Primary sources

  • Manufacturers and suppliers
  • Channel partners
  • Industry experts
  • Strategic decision makers

Secondary sources

  • Industry journals and periodicals
  • Government data
  • Financial reports of key industry players
  • Historical data
  • Press releases

DATA ANALYSIS

Data Synthesis

  • Collation of data
  • Estimation of key figures
  • Analysis of derived insights

Data Validation

  • Triangulation with data models
  • Reference against proprietary databases
  • Corroboration with industry experts

REPORT WRITING

Qualitative

  • Market drivers
  • Market challenges
  • Market trends
  • Five forces analysis

Quantitative

  • Market size and forecast
  • Market segmentation
  • Geographical insights
  • Competitive landscape

Interested in this report?

Get your sample now to see our research methodology and insights!

Download Now

Frequently Asked Questions

Citric Acid market growth will increase by USD 3598.3 million during 2026-2030.

The Citric Acid market is expected to grow at a CAGR of 10.2% during 2026-2030.

Citric Acid market is segmented by Application (Food and beverage, Pharmaceuticals and personal care products, Detergents and cleaners, Others) Type (Liquid, Anhydrous) Source (Fermentation-based, Natural extraction)

Archer Daniels Midland Co., ATAMAN Kimya AS, BASF SE, BRENNTAG SE, Cargill Inc., COFCO Corp., Fufeng Group Ltd., Gadot Biochemical Industries, Jungbunzlauer Suisse AG, Merck KGaA, Niran BioChemical, RZBC Group Co. Ltd., Sunshine Biotech International, Taihe Biotech Co. Ltd., Tate and Lyle Plc, Thermo Fisher Scientific Inc., Univar Solutions Inc., Weifang Ensign Industry Co., Xinghua Biochemical Co. Ltd., Yasho Industries Ltd. are a few of the key vendors in the Citric Acid market.

Europe will register the highest growth rate of 33.1% among the other regions. Therefore, the Citric Acid market in Europe is expected to garner significant business opportunities for the vendors during the forecast period.

Germany, UK, France, Italy, Spain, The Netherlands, US, Canada, Mexico, China, Japan, India, South Korea, Australia, Indonesia, Saudi Arabia, UAE, South Africa, Israel, Turkey, Brazil, Argentina, Chile

  • Growing demand for citric acids from detergents and cleaners is the driving factor this market.

The Citric Acid market vendors should focus on grabbing business opportunities from the Application segment as it accounted for the largest market share in the base year.
RIA - Research AI Assistant
Ask RIA
