Clean Energy Technologies Market Analysis, Size, and Forecast 2026-2030: APAC (China, Japan, and India), Europe (Germany, UK, and France), North America (US, Canada, and Mexico), South America (Brazil and Argentina), Middle East and Africa (Saudi Arabia, UAE, and South Africa), and Rest of World (ROW)

Clean Energy Technologies Market Analysis, Size, and Forecast 2026-2030:
APAC (China, Japan, and India), Europe (Germany, UK, and France), North America (US, Canada, and Mexico), South America (Brazil and Argentina), Middle East and Africa (Saudi Arabia, UAE, and South Africa), and Rest of World (ROW)

Published: Apr 2026 307 Pages SKU: IRTNTR71945

Market Overview at a Glance

$106.57 B
Market Opportunity
5.7%
CAGR 2025 - 2030
32.6%
APAC Growth
$87.72 B
Hydropower segment 2024

Clean Energy Technologies Market Size 2026-2030

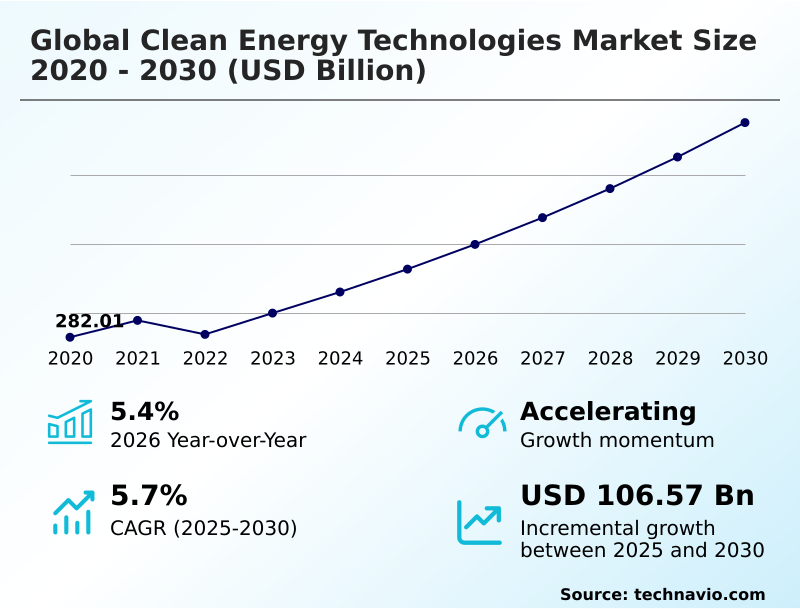
The clean energy technologies market size is valued to increase by USD 106.57 billion, at a CAGR of 5.7% from 2025 to 2030. Conducive regulatory frameworks and governmental support will drive the clean energy technologies market.

Major Market Trends & Insights

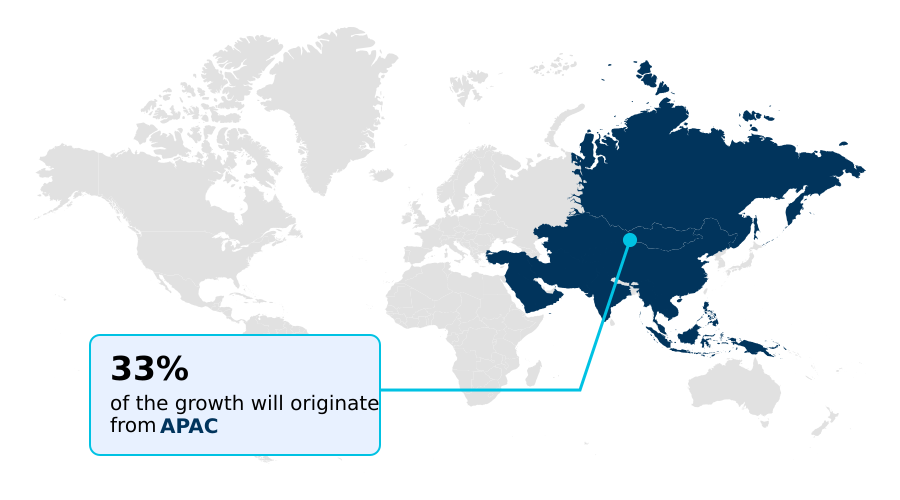
  • APAC dominated the market and accounted for a 32.6% growth during the forecast period.
  • By Technology - Hydropower segment was valued at USD 87.72 billion in 2024
  • By End-user - Industrial segment accounted for the largest market revenue share in 2024

Market Size & Forecast

  • Market Opportunities: USD 156.11 billion
  • Market Future Opportunities: USD 106.57 billion
  • CAGR from 2025 to 2030 : 5.7%

Market Summary

  • The clean energy technologies market is undergoing a profound transformation driven by economic imperatives and environmental mandates. Beyond simple power generation, the industry is focused on creating a resilient and intelligent energy ecosystem. Technologies like photovoltaic systems, wind turbines, and advanced energy storage solutions are becoming foundational components of modern infrastructure.
  • A key dynamic is the push toward decarbonization pathways, which influences everything from utility-scale project finance to corporate energy procurement strategies. For instance, a logistics company might deploy a microgrid combining rooftop solar with battery storage at its distribution center. This not only lowers electricity costs but also ensures operational continuity during grid outages, safeguarding supply chain integrity.
  • This scenario highlights a broader trend: clean energy is no longer just an alternative but a strategic tool for enhancing operational efficiency, managing risk, and achieving long-term sustainability goals. The convergence of digital technologies and hardware innovation is unlocking new value streams and accelerating the energy transition on a scale.

What will be the Size of the Clean Energy Technologies Market during the forecast period?

Get Key Insights on Market Forecast (PDF) Request Free Sample

How is the Clean Energy Technologies Market Segmented?

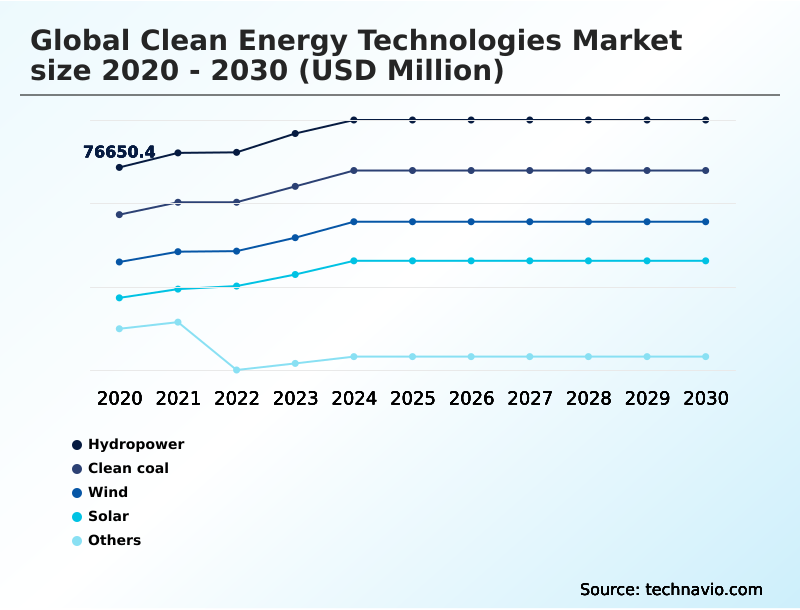
The clean energy technologies industry research report provides comprehensive data (region-wise segment analysis), with forecasts and estimates in "USD million" for the period 2026-2030, as well as historical data from 2020-2024 for the following segments.

  • Technology
    • Hydropower
    • Clean coal
    • Wind
    • Solar
    • Others
  • End-user
    • Industrial
    • Residential
    • Commercial
  • Deployment
    • On-grid
    • Off-grid
    • Hybrid systems
  • Geography
    • APAC
      • China
      • Japan
      • India
    • Europe
      • Germany
      • UK
      • France
    • North America
      • US
      • Canada
      • Mexico
    • South America
      • Brazil
      • Argentina
    • Middle East and Africa
      • Saudi Arabia
      • UAE
      • South Africa
    • Rest of World (ROW)

By Technology Insights

The hydropower segment is estimated to witness significant growth during the forecast period.

The hydropower segment remains a cornerstone of clean energy, providing essential baseload power and dispatchable power crucial for grid stability.

Beyond massive legacy dams, the focus is shifting toward smaller-scale hydropower installations, including run-of-river projects, small-hydro, mini-hydro, and micro-hydro systems that minimize ecological disruption.

A key evolution in this segment is the expanding role of pumped hydro storage, which functions as a large-scale battery, enhancing energy resilience and enabling deeper integration of variable renewables.

This capability is critical for national energy security, with modern retrofits of existing facilities improving round-trip efficiency by over 15%. This dual function of generation and large-scale storage solidifies hydropower's foundational role in the evolving energy landscape.

Request Free Sample

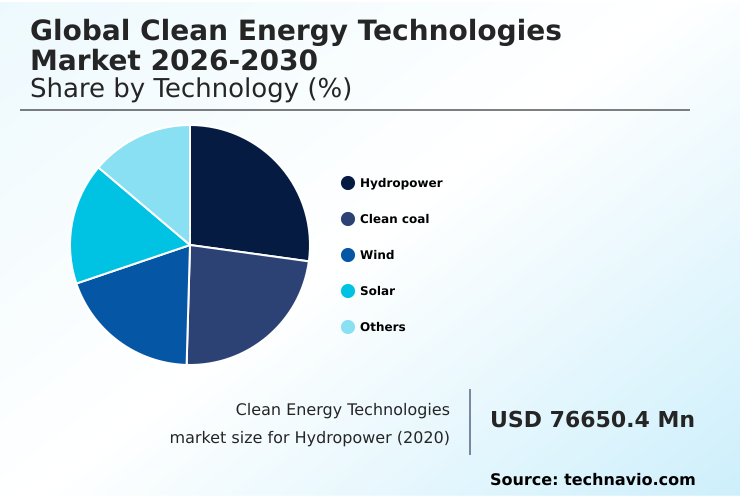
The Hydropower segment was valued at USD 87.72 billion in 2024 and showed a gradual increase during the forecast period.

Request Free Sample

Regional Analysis

APAC is estimated to contribute 32.6% to the growth of the global market during the forecast period.Technavio’s analysts have elaborately explained the regional trends and drivers that shape the market during the forecast period.

See How Clean Energy Technologies Market Demand is Rising in APAC Request Free Sample

The geographic landscape is increasingly defined by resource-specific deployments and the need for grid modernization. Regions are leveraging unique strengths, from large-scale agrivoltaics to untapped ocean/marine power, including tidal power and wave power.

A critical enabler is the deployment of diverse energy storage solutions, such as thermal energy storage and large-scale battery energy storage systems (BESS), which are vital for grid stability.

The rise of green hydrogen is creating new industrial hubs, while distributed resources like biofuels and biogas support local energy needs.

Investment in transmission infrastructure is essential, as connecting remote renewable sources to demand centers can reduce curtailment rates by as much as 25%.

Market Dynamics

Our researchers analyzed the data with 2025 as the base year, along with the key drivers, trends, and challenges. A holistic analysis of drivers will help companies refine their marketing strategies to gain a competitive advantage.

  • Navigating the global clean energy technologies market 2026-2030 requires a deep understanding of specific technological and economic trade-offs. A critical consideration involves comparing solar pv and csp efficiency, where PV dominates in modularity while CSP offers inherent thermal storage capabilities.
  • The cost dynamics of offshore wind energy, particularly the move toward challenges of floating offshore wind platforms, are reshaping maritime engineering and project finance. Concurrently, the grid integration challenges with high renewables are a central concern for system operators, forcing investment in smarter grid infrastructure.
  • The role of green hydrogen in industrial decarbonization is emerging as a solution for hard-to-abate sectors, though its widespread adoption depends on scaling renewable electricity production. Businesses are increasingly analyzing various financing models for utility-scale solar projects to optimize returns in a competitive landscape where project bankability is paramount.
  • For long-term baseload power, the technical viability of small modular reactors is being assessed against the advanced geothermal systems for baseload power, with the former offering location flexibility and the latter providing consistent output in geologically suitable areas.
  • The impact of tariffs on solar supply chains has demonstrated vulnerabilities, prompting a re-evaluation of procurement strategies; some firms have mitigated this risk by diversifying suppliers, achieving a supply chain resilience score that is twice as high as their non-diversified peers.
  • Finally, at the consumer level, the market for energy storage for residential solar systems is expanding rapidly, while the lifecycle analysis of wind turbine blades and understanding the regulatory frameworks for community solar are becoming key ESG considerations for investors.
  • The use of solid oxide fuel cells for on-site power, sector coupling with transport electrification, and transitional solutions like carbon capture in clean coal technologies further illustrate the market's complexity.

What are the key market drivers leading to the rise in the adoption of Clean Energy Technologies Industry?

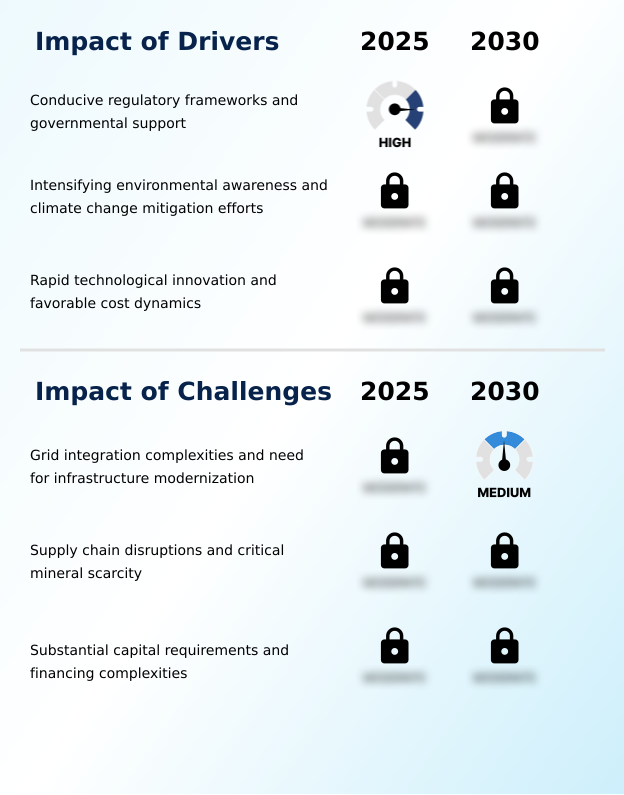
  • Conducive regulatory frameworks and robust governmental support serve as a primary catalyst for market expansion.

  • Supportive regulatory mechanisms are a primary driver, accelerating the energy transition. Frameworks like renewable portfolio standards and long-term financial instruments, including power purchase agreements (PPAs) and contracts for difference, provide investment certainty.
  • These policies have been instrumental in driving down the levelized cost of energy (LCOE) for technologies such as wind turbines and concentrating solar power (CSP), making them economically superior for new capacity.
  • This has fueled massive growth in utility-scale solar and created a viable path for capital-intensive offshore wind platforms, including next-generation floating offshore wind projects.
  • The clear policy signals are foundational to the industry's decarbonization pathways, showing a 30% faster project approval time in jurisdictions with stable feed-in tariffs.

What are the market trends shaping the Clean Energy Technologies Industry?

  • A transformative trend is the accelerated shift from traditional, centralized power generation models toward decentralized and digitally enabled energy grids.

  • A primary trend is the shift towards decentralized energy systems, where rooftop solar systems and other distributed energy resources are orchestrated by smart grids. This move toward electrification and sector coupling is creating new business models like energy-as-a-service and community solar programs.
  • These frameworks allow for greater efficiency, with some integrated systems reducing line loss by up to 8% compared to traditional centralized models. Innovations in solar photovoltaic (PV) are complemented by advancements in clean transport, where fuel cell engines and synthetic fuels like e-methanol are emerging.
  • Effective demand side management becomes critical in this model, enabling a 15% reduction in peak load for commercial participants.

What challenges does the Clean Energy Technologies Industry face during its growth?

  • The complexities of grid integration and the critical need for infrastructure modernization present a formidable challenge to market growth.

  • Significant challenges persist, particularly around the grid integration of intermittent renewables. Accommodating technologies like concentrating photovoltaic (CPV) and various forms of biopower and biomass requires substantial grid upgrades. Transitional technologies such as carbon capture utilization and storage (CCUS) face economic and scalability hurdles.
  • Furthermore, the development of advanced nuclear reactors and small modular reactors (SMRs), while promising for firm power, is constrained by the need for specialized supply chains, including high-assay low-enriched uranium.
  • Innovating in niche areas like waste-to-energy technologies, solid oxide fuel cells (SOFC), and building integrated photovoltaics (BIPV) also requires overcoming unique integration complexities, with initial deployments showing that interoperability issues can increase commissioning costs by 10-15%.

Exclusive Technavio Analysis on Customer Landscape

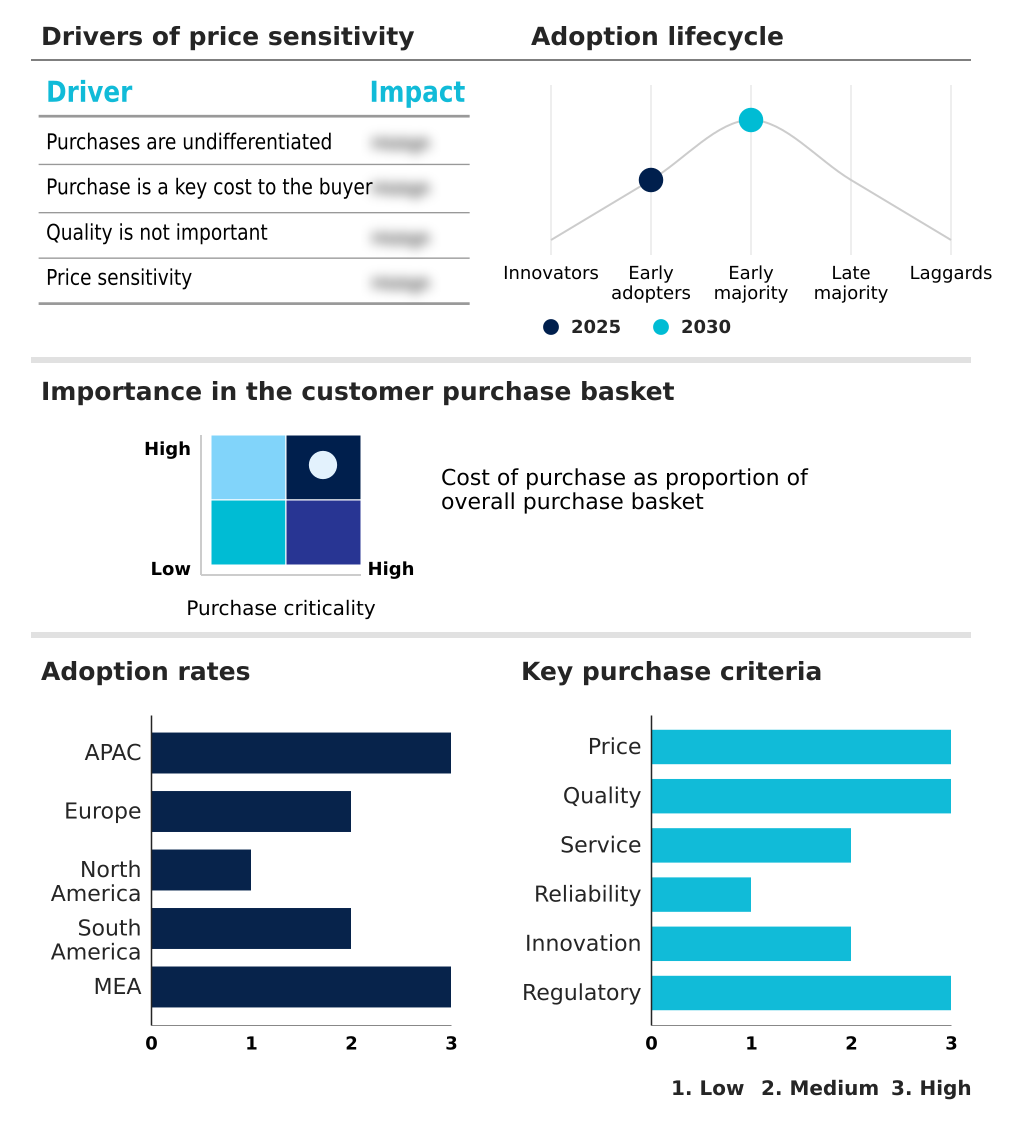
The clean energy technologies market forecasting report includes the adoption lifecycle of the market, covering from the innovator’s stage to the laggard’s stage. It focuses on adoption rates in different regions based on penetration. Furthermore, the clean energy technologies market report also includes key purchase criteria and drivers of price sensitivity to help companies evaluate and develop their market growth analysis strategies.

Customer Landscape of Clean Energy Technologies Industry

Competitive Landscape

Companies are implementing various strategies, such as strategic alliances, clean energy technologies market forecast, partnerships, mergers and acquisitions, geographical expansion, and product/service launches, to enhance their presence in the industry.

ABB Ltd. - Analysis reveals a focus on electrification, grid automation, and energy efficiency solutions, which are central to modern clean energy technology frameworks.

The industry research and growth report includes detailed analyses of the competitive landscape of the market and information about key companies, including:

  • ABB Ltd.
  • Adani Green Energy Ltd.
  • Ballard Power Systems Inc.
  • Bloom Energy Corp.
  • BYD Co. Ltd.
  • Canadian Solar Inc.
  • Enel Spa
  • Enphase Energy Inc.
  • First Solar Inc.
  • GE Vernova Inc.
  • Iberdrola SA
  • JinkoSolar Holding Co. Ltd.
  • Schneider Electric SE
  • Siemens Energy AG
  • SolarEdge Technologies Inc.
  • SunPower Corp.
  • Tesla Inc.
  • TotalEnergies SE
  • Trina Solar Co. Ltd.
  • Vestas Wind Systems AS

Qualitative and quantitative analysis of companies has been conducted to help clients understand the wider business environment as well as the strengths and weaknesses of key industry players. Data is qualitatively analyzed to categorize companies as pure play, category-focused, industry-focused, and diversified; it is quantitatively analyzed to categorize companies as dominant, leading, strong, tentative, and weak.

Recent Development and News in Clean energy technologies market

  • In August, 2025, General Matter announced a landmark private investment of nearly $1.5 billion to construct a commercial uranium enrichment facility in Paducah, Kentucky, to produce High-Assay Low-Enriched Uranium for advanced nuclear reactors.
  • In November, 2025, Gentari finalized a long-term power purchase agreement to supply 650 megawatts of continuous, carbon-free electricity from a hybrid portfolio of new wind, solar, and battery storage assets to a major green hydrogen and ammonia production facility in India.
  • In August, 2025, ACWA Power announced the commencement of full commercial operations at three major solar power projects in Saudi Arabia—Al Kahfah, Al-Rass 2, and SAAD 2—collectively adding 2.79 gigawatts of clean energy capacity to the national grid.
  • In June, 2025, EDP committed to a $7 billion investment plan for the 2025 to 2026 period to accelerate the energy transition in its South American operations, with a primary focus on expanding its solar and wind portfolio and upgrading electricity grid assets in Brazil.

Dive into Technavio’s robust research methodology, blending expert interviews, extensive data synthesis, and validated models for unparalleled Clean Energy Technologies Market insights. See full methodology.

Market Scope
Page number 307
Base year 2025
Historic period 2020-2024
Forecast period 2026-2030
Growth momentum & CAGR Accelerate at a CAGR of 5.7%
Market growth 2026-2030 USD 106572.8 million
Market structure Fragmented
YoY growth 2025-2026(%) 5.4%
Key countries China, Japan, India, South Korea, Australia, Indonesia, Germany, UK, France, Italy, Spain, The Netherlands, US, Canada, Mexico, Brazil, Argentina, Chile, Saudi Arabia, UAE, South Africa, Israel and Turkey
Competitive landscape Leading Companies, Market Positioning of Companies, Competitive Strategies, and Industry Risks

Request Free Sample

Research Analyst Overview

  • The clean energy technologies market is defined by a strategic diversification of assets to ensure grid reliability. Foundational sources like hydropower installations—from large-scale to small-hydro, mini-hydro, and micro-hydro—are complemented by rapidly expanding photovoltaic systems and wind turbines. Innovation is pushing into new frontiers, including geothermal plants and ocean/marine power utilizing both tidal power and wave power.
  • A diverse array of biopower solutions, encompassing biomass, biofuels, and biogas, addresses niche applications. The market's financial structure relies on power purchase agreements (PPAs) and contracts for difference, shaped by renewable portfolio standards and feed-in tariffs that target a low levelized cost of energy (LCOE).
  • Advanced generation technologies like concentrating solar power (CSP), concentrating photovoltaic (CPV), and solid oxide fuel cells (SOFC) are emerging alongside next-generation nuclear powered by high-assay low-enriched uranium. The transition toward decarbonization leverages green hydrogen and, where necessary, carbon capture utilization and storage (CCUS).
  • System stability hinges on integrated energy storage solutions, including thermal energy storage, managed through smart grids that optimize distributed energy resources and demand side management. The integration of fuel cell engines and production of e-methanol highlight sector coupling. For corporate strategy, resolving grid integration complexities remains paramount, with successful firms using predictive analytics to improve asset availability by over 20%.

What are the Key Data Covered in this Clean Energy Technologies Market Research and Growth Report?

  • What is the expected growth of the Clean Energy Technologies Market between 2026 and 2030?

    • USD 106.57 billion, at a CAGR of 5.7%

  • What segmentation does the market report cover?

    • The report is segmented by Technology (Hydropower, Clean coal, Wind, Solar, and Others), End-user (Industrial, Residential, and Commercial), Deployment (On-grid, Off-grid, and Hybrid systems) and Geography (APAC, Europe, North America, South America, Middle East and Africa)

  • Which regions are analyzed in the report?

    • APAC, Europe, North America, South America and Middle East and Africa

  • What are the key growth drivers and market challenges?

    • Conducive regulatory frameworks and governmental support, Grid integration complexities and need for infrastructure modernization

  • Who are the major players in the Clean Energy Technologies Market?

    • ABB Ltd., Adani Green Energy Ltd., Ballard Power Systems Inc., Bloom Energy Corp., BYD Co. Ltd., Canadian Solar Inc., Enel Spa, Enphase Energy Inc., First Solar Inc., GE Vernova Inc., Iberdrola SA, JinkoSolar Holding Co. Ltd., Schneider Electric SE, Siemens Energy AG, SolarEdge Technologies Inc., SunPower Corp., Tesla Inc., TotalEnergies SE, Trina Solar Co. Ltd. and Vestas Wind Systems AS

Market Research Insights

  • The market is characterized by a strategic pivot towards energy resilience and grid stability, driven by the adoption of decentralized energy systems. The integration of battery energy storage systems (BESS) with intermittent sources has proven to reduce local power disruptions by up to 40% in some commercial microgrids.
  • This shift is enabling new energy-as-a-service models, where operational efficiency gains of 15-20% are realized through optimized energy use. The expansion of utility-scale solar and offshore wind platforms is creating a more distributed and complex grid, necessitating advanced management systems. This focus on reliability and security is redefining investment priorities across the sector.

We can help! Our analysts can customize this clean energy technologies market research report to meet your requirements.

Get in touch

1. Executive Summary

1.1 Market overview

Executive Summary - Chart on Market Overview
Executive Summary - Data Table on Market Overview
Executive Summary - Chart on Global Market Characteristics
Executive Summary - Chart on Market by Geography
Executive Summary - Chart on Market Segmentation by Technology
Executive Summary - Chart on Market Segmentation by End-user
Executive Summary - Chart on Market Segmentation by Deployment
Executive Summary - Chart on Incremental Growth
Executive Summary - Data Table on Incremental Growth
Executive Summary - Chart on Company Market Positioning

2. Technavio Analysis

2.1 Analysis of price sensitivity, lifecycle, customer purchase basket, adoption rates, and purchase criteria

2.2 Criticality of inputs and Factors of differentiation

Chart on Overview on criticality of inputs and factors of differentiation

2.3 Factors of disruption

Chart on Overview on factors of disruption

2.4 Impact of drivers and challenges

Chart on Impact of drivers and challenges in 2025 and 2030

3. Market Landscape

3.1 Market ecosystem

Chart on Parent Market
Data Table on - Parent Market

3.2 Market characteristics

Chart on Market characteristics analysis

3.3 Value chain analysis

Chart on Value chain analysis

4. Market Sizing

4.1 Market definition

Data Table on Offerings of companies included in the market definition

4.2 Market segment analysis

Market segments

4.3 Market size 2025

4.4 Market outlook: Forecast for 2025-2030

Chart on Global - Market size and forecast 2025-2030 ($ million)
Data Table on Global - Market size and forecast 2025-2030 ($ million)
Chart on Global Market: Year-over-year growth 2025-2030 (%)
Data Table on Global Market: Year-over-year growth 2025-2030 (%)

5. Historic Market Size

5.1 Global Clean Energy Technologies Market 2020 - 2024

Historic Market Size - Data Table on Global Clean Energy Technologies Market 2020 - 2024 ($ million)

5.2 Technology segment analysis 2020 - 2024

Historic Market Size - Technology Segment 2020 - 2024 ($ million)

5.3 End-user segment analysis 2020 - 2024

Historic Market Size - End-user Segment 2020 - 2024 ($ million)

5.4 Deployment segment analysis 2020 - 2024

Historic Market Size - Deployment Segment 2020 - 2024 ($ million)

5.5 Geography segment analysis 2020 - 2024

Historic Market Size - Geography Segment 2020 - 2024 ($ million)

5.6 Country segment analysis 2020 - 2024

Historic Market Size - Country Segment 2020 - 2024 ($ million)

6. Qualitative Analysis

6.1 Impact of AI on global clean energy technologies market

6.2 Impact of geopolitical conflicts on global clean energy technologies market

7. Five Forces Analysis

7.1 Five forces summary

Five forces analysis - Comparison between 2025 and 2030

7.2 Bargaining power of buyers

Bargaining power of buyers - Impact of key factors 2025 and 2030

7.3 Bargaining power of suppliers

Bargaining power of suppliers - Impact of key factors in 2025 and 2030

7.4 Threat of new entrants

Threat of new entrants - Impact of key factors in 2025 and 2030

7.5 Threat of substitutes

Threat of substitutes - Impact of key factors in 2025 and 2030

7.6 Threat of rivalry

Threat of rivalry - Impact of key factors in 2025 and 2030

7.7 Market condition

Chart on Market condition - Five forces 2025 and 2030

8. Market Segmentation by Technology

8.1 Market segments

Chart on Technology - Market share 2025-2030 (%)
Data Table on Technology - Market share 2025-2030 (%)

8.2 Comparison by Technology

Chart on Comparison by Technology
Data Table on Comparison by Technology

8.3 Hydropower - Market size and forecast 2025-2030

Chart on Hydropower - Market size and forecast 2025-2030 ($ million)
Data Table on Hydropower - Market size and forecast 2025-2030 ($ million)
Chart on Hydropower - Year-over-year growth 2025-2030 (%)
Data Table on Hydropower - Year-over-year growth 2025-2030 (%)

8.4 Clean coal - Market size and forecast 2025-2030

Chart on Clean coal - Market size and forecast 2025-2030 ($ million)
Data Table on Clean coal - Market size and forecast 2025-2030 ($ million)
Chart on Clean coal - Year-over-year growth 2025-2030 (%)
Data Table on Clean coal - Year-over-year growth 2025-2030 (%)

8.5 Wind - Market size and forecast 2025-2030

Chart on Wind - Market size and forecast 2025-2030 ($ million)
Data Table on Wind - Market size and forecast 2025-2030 ($ million)
Chart on Wind - Year-over-year growth 2025-2030 (%)
Data Table on Wind - Year-over-year growth 2025-2030 (%)

8.6 Solar - Market size and forecast 2025-2030

Chart on Solar - Market size and forecast 2025-2030 ($ million)
Data Table on Solar - Market size and forecast 2025-2030 ($ million)
Chart on Solar - Year-over-year growth 2025-2030 (%)
Data Table on Solar - Year-over-year growth 2025-2030 (%)

8.7 Others - Market size and forecast 2025-2030

Chart on Others - Market size and forecast 2025-2030 ($ million)
Data Table on Others - Market size and forecast 2025-2030 ($ million)
Chart on Others - Year-over-year growth 2025-2030 (%)
Data Table on Others - Year-over-year growth 2025-2030 (%)

8.8 Market opportunity by Technology

Market opportunity by Technology ($ million)
Data Table on Market opportunity by Technology ($ million)

9. Market Segmentation by End-user

9.1 Market segments

Chart on End-user - Market share 2025-2030 (%)
Data Table on End-user - Market share 2025-2030 (%)

9.2 Comparison by End-user

Chart on Comparison by End-user
Data Table on Comparison by End-user

9.3 Industrial - Market size and forecast 2025-2030

Chart on Industrial - Market size and forecast 2025-2030 ($ million)
Data Table on Industrial - Market size and forecast 2025-2030 ($ million)
Chart on Industrial - Year-over-year growth 2025-2030 (%)
Data Table on Industrial - Year-over-year growth 2025-2030 (%)

9.4 Residential - Market size and forecast 2025-2030

Chart on Residential - Market size and forecast 2025-2030 ($ million)
Data Table on Residential - Market size and forecast 2025-2030 ($ million)
Chart on Residential - Year-over-year growth 2025-2030 (%)
Data Table on Residential - Year-over-year growth 2025-2030 (%)

9.5 Commercial - Market size and forecast 2025-2030

Chart on Commercial - Market size and forecast 2025-2030 ($ million)
Data Table on Commercial - Market size and forecast 2025-2030 ($ million)
Chart on Commercial - Year-over-year growth 2025-2030 (%)
Data Table on Commercial - Year-over-year growth 2025-2030 (%)

9.6 Market opportunity by End-user

Market opportunity by End-user ($ million)
Data Table on Market opportunity by End-user ($ million)

10. Market Segmentation by Deployment

10.1 Market segments

Chart on Deployment - Market share 2025-2030 (%)
Data Table on Deployment - Market share 2025-2030 (%)

10.2 Comparison by Deployment

Chart on Comparison by Deployment
Data Table on Comparison by Deployment

10.3 On-grid - Market size and forecast 2025-2030

Chart on On-grid - Market size and forecast 2025-2030 ($ million)
Data Table on On-grid - Market size and forecast 2025-2030 ($ million)
Chart on On-grid - Year-over-year growth 2025-2030 (%)
Data Table on On-grid - Year-over-year growth 2025-2030 (%)

10.4 Off-grid - Market size and forecast 2025-2030

Chart on Off-grid - Market size and forecast 2025-2030 ($ million)
Data Table on Off-grid - Market size and forecast 2025-2030 ($ million)
Chart on Off-grid - Year-over-year growth 2025-2030 (%)
Data Table on Off-grid - Year-over-year growth 2025-2030 (%)

10.5 Hybrid systems - Market size and forecast 2025-2030

Chart on Hybrid systems - Market size and forecast 2025-2030 ($ million)
Data Table on Hybrid systems - Market size and forecast 2025-2030 ($ million)
Chart on Hybrid systems - Year-over-year growth 2025-2030 (%)
Data Table on Hybrid systems - Year-over-year growth 2025-2030 (%)

10.6 Market opportunity by Deployment

Market opportunity by Deployment ($ million)
Data Table on Market opportunity by Deployment ($ million)

11. Customer Landscape

11.1 Customer landscape overview

Analysis of price sensitivity, lifecycle, customer purchase basket, adoption rates, and purchase criteria

12. Geographic Landscape

12.1 Geographic segmentation

Chart on Market share by geography 2025-2030 (%)
Data Table on Market share by geography 2025-2030 (%)

12.2 Geographic comparison

Chart on Geographic comparison
Data Table on Geographic comparison

12.3 APAC - Market size and forecast 2025-2030

Chart on APAC - Market size and forecast 2025-2030 ($ million)
Data Table on APAC - Market size and forecast 2025-2030 ($ million)
Chart on APAC - Year-over-year growth 2025-2030 (%)
Data Table on APAC - Year-over-year growth 2025-2030 (%)
Chart on Regional Comparison - APAC
Data Table on Regional Comparison - APAC

12.3.1 China - Market size and forecast 2025-2030

Chart on China - Market size and forecast 2025-2030 ($ million)
Data Table on China - Market size and forecast 2025-2030 ($ million)
Chart on China - Year-over-year growth 2025-2030 (%)
Data Table on China - Year-over-year growth 2025-2030 (%)

12.3.2 Japan - Market size and forecast 2025-2030

Chart on Japan - Market size and forecast 2025-2030 ($ million)
Data Table on Japan - Market size and forecast 2025-2030 ($ million)
Chart on Japan - Year-over-year growth 2025-2030 (%)
Data Table on Japan - Year-over-year growth 2025-2030 (%)

12.3.3 India - Market size and forecast 2025-2030

Chart on India - Market size and forecast 2025-2030 ($ million)
Data Table on India - Market size and forecast 2025-2030 ($ million)
Chart on India - Year-over-year growth 2025-2030 (%)
Data Table on India - Year-over-year growth 2025-2030 (%)

12.3.4 South Korea - Market size and forecast 2025-2030

Chart on South Korea - Market size and forecast 2025-2030 ($ million)
Data Table on South Korea - Market size and forecast 2025-2030 ($ million)
Chart on South Korea - Year-over-year growth 2025-2030 (%)
Data Table on South Korea - Year-over-year growth 2025-2030 (%)

12.3.5 Australia - Market size and forecast 2025-2030

Chart on Australia - Market size and forecast 2025-2030 ($ million)
Data Table on Australia - Market size and forecast 2025-2030 ($ million)
Chart on Australia - Year-over-year growth 2025-2030 (%)
Data Table on Australia - Year-over-year growth 2025-2030 (%)

12.3.6 Indonesia - Market size and forecast 2025-2030

Chart on Indonesia - Market size and forecast 2025-2030 ($ million)
Data Table on Indonesia - Market size and forecast 2025-2030 ($ million)
Chart on Indonesia - Year-over-year growth 2025-2030 (%)
Data Table on Indonesia - Year-over-year growth 2025-2030 (%)

12.4 Europe - Market size and forecast 2025-2030

Chart on Europe - Market size and forecast 2025-2030 ($ million)
Data Table on Europe - Market size and forecast 2025-2030 ($ million)
Chart on Europe - Year-over-year growth 2025-2030 (%)
Data Table on Europe - Year-over-year growth 2025-2030 (%)
Chart on Regional Comparison - Europe
Data Table on Regional Comparison - Europe

12.4.1 Germany - Market size and forecast 2025-2030

Chart on Germany - Market size and forecast 2025-2030 ($ million)
Data Table on Germany - Market size and forecast 2025-2030 ($ million)
Chart on Germany - Year-over-year growth 2025-2030 (%)
Data Table on Germany - Year-over-year growth 2025-2030 (%)

12.4.2 UK - Market size and forecast 2025-2030

Chart on UK - Market size and forecast 2025-2030 ($ million)
Data Table on UK - Market size and forecast 2025-2030 ($ million)
Chart on UK - Year-over-year growth 2025-2030 (%)
Data Table on UK - Year-over-year growth 2025-2030 (%)

12.4.3 France - Market size and forecast 2025-2030

Chart on France - Market size and forecast 2025-2030 ($ million)
Data Table on France - Market size and forecast 2025-2030 ($ million)
Chart on France - Year-over-year growth 2025-2030 (%)
Data Table on France - Year-over-year growth 2025-2030 (%)

12.4.4 Italy - Market size and forecast 2025-2030

Chart on Italy - Market size and forecast 2025-2030 ($ million)
Data Table on Italy - Market size and forecast 2025-2030 ($ million)
Chart on Italy - Year-over-year growth 2025-2030 (%)
Data Table on Italy - Year-over-year growth 2025-2030 (%)

12.4.5 Spain - Market size and forecast 2025-2030

Chart on Spain - Market size and forecast 2025-2030 ($ million)
Data Table on Spain - Market size and forecast 2025-2030 ($ million)
Chart on Spain - Year-over-year growth 2025-2030 (%)
Data Table on Spain - Year-over-year growth 2025-2030 (%)

12.4.6 The Netherlands - Market size and forecast 2025-2030

Chart on The Netherlands - Market size and forecast 2025-2030 ($ million)
Data Table on The Netherlands - Market size and forecast 2025-2030 ($ million)
Chart on The Netherlands - Year-over-year growth 2025-2030 (%)
Data Table on The Netherlands - Year-over-year growth 2025-2030 (%)

12.5 North America - Market size and forecast 2025-2030

Chart on North America - Market size and forecast 2025-2030 ($ million)
Data Table on North America - Market size and forecast 2025-2030 ($ million)
Chart on North America - Year-over-year growth 2025-2030 (%)
Data Table on North America - Year-over-year growth 2025-2030 (%)
Chart on Regional Comparison - North America
Data Table on Regional Comparison - North America

12.5.1 US - Market size and forecast 2025-2030

Chart on US - Market size and forecast 2025-2030 ($ million)
Data Table on US - Market size and forecast 2025-2030 ($ million)
Chart on US - Year-over-year growth 2025-2030 (%)
Data Table on US - Year-over-year growth 2025-2030 (%)

12.5.2 Canada - Market size and forecast 2025-2030

Chart on Canada - Market size and forecast 2025-2030 ($ million)
Data Table on Canada - Market size and forecast 2025-2030 ($ million)
Chart on Canada - Year-over-year growth 2025-2030 (%)
Data Table on Canada - Year-over-year growth 2025-2030 (%)

12.5.3 Mexico - Market size and forecast 2025-2030

Chart on Mexico - Market size and forecast 2025-2030 ($ million)
Data Table on Mexico - Market size and forecast 2025-2030 ($ million)
Chart on Mexico - Year-over-year growth 2025-2030 (%)
Data Table on Mexico - Year-over-year growth 2025-2030 (%)

12.6 South America - Market size and forecast 2025-2030

Chart on South America - Market size and forecast 2025-2030 ($ million)
Data Table on South America - Market size and forecast 2025-2030 ($ million)
Chart on South America - Year-over-year growth 2025-2030 (%)
Data Table on South America - Year-over-year growth 2025-2030 (%)
Chart on Regional Comparison - South America
Data Table on Regional Comparison - South America

12.6.1 Brazil - Market size and forecast 2025-2030

Chart on Brazil - Market size and forecast 2025-2030 ($ million)
Data Table on Brazil - Market size and forecast 2025-2030 ($ million)
Chart on Brazil - Year-over-year growth 2025-2030 (%)
Data Table on Brazil - Year-over-year growth 2025-2030 (%)

12.6.2 Argentina - Market size and forecast 2025-2030

Chart on Argentina - Market size and forecast 2025-2030 ($ million)
Data Table on Argentina - Market size and forecast 2025-2030 ($ million)
Chart on Argentina - Year-over-year growth 2025-2030 (%)
Data Table on Argentina - Year-over-year growth 2025-2030 (%)

12.6.3 Chile - Market size and forecast 2025-2030

Chart on Chile - Market size and forecast 2025-2030 ($ million)
Data Table on Chile - Market size and forecast 2025-2030 ($ million)
Chart on Chile - Year-over-year growth 2025-2030 (%)
Data Table on Chile - Year-over-year growth 2025-2030 (%)

12.7 Middle East and Africa - Market size and forecast 2025-2030

Chart on Middle East and Africa - Market size and forecast 2025-2030 ($ million)
Data Table on Middle East and Africa - Market size and forecast 2025-2030 ($ million)
Chart on Middle East and Africa - Year-over-year growth 2025-2030 (%)
Data Table on Middle East and Africa - Year-over-year growth 2025-2030 (%)
Chart on Regional Comparison - Middle East and Africa
Data Table on Regional Comparison - Middle East and Africa

12.7.1 Saudi Arabia - Market size and forecast 2025-2030

Chart on Saudi Arabia - Market size and forecast 2025-2030 ($ million)
Data Table on Saudi Arabia - Market size and forecast 2025-2030 ($ million)
Chart on Saudi Arabia - Year-over-year growth 2025-2030 (%)
Data Table on Saudi Arabia - Year-over-year growth 2025-2030 (%)

12.7.2 UAE - Market size and forecast 2025-2030

Chart on UAE - Market size and forecast 2025-2030 ($ million)
Data Table on UAE - Market size and forecast 2025-2030 ($ million)
Chart on UAE - Year-over-year growth 2025-2030 (%)
Data Table on UAE - Year-over-year growth 2025-2030 (%)

12.7.3 South Africa - Market size and forecast 2025-2030

Chart on South Africa - Market size and forecast 2025-2030 ($ million)
Data Table on South Africa - Market size and forecast 2025-2030 ($ million)
Chart on South Africa - Year-over-year growth 2025-2030 (%)
Data Table on South Africa - Year-over-year growth 2025-2030 (%)

12.7.4 Israel - Market size and forecast 2025-2030

Chart on Israel - Market size and forecast 2025-2030 ($ million)
Data Table on Israel - Market size and forecast 2025-2030 ($ million)
Chart on Israel - Year-over-year growth 2025-2030 (%)
Data Table on Israel - Year-over-year growth 2025-2030 (%)

12.7.5 Turkey - Market size and forecast 2025-2030

Chart on Turkey - Market size and forecast 2025-2030 ($ million)
Data Table on Turkey - Market size and forecast 2025-2030 ($ million)
Chart on Turkey - Year-over-year growth 2025-2030 (%)
Data Table on Turkey - Year-over-year growth 2025-2030 (%)

12.8 Market opportunity by geography

Market opportunity by geography ($ million)
Data Tables on Market opportunity by geography ($ million)

13. Drivers, Challenges, and Opportunity

13.1 Market drivers

Conducive regulatory frameworks and governmental support
Intensifying environmental awareness and climate change mitigation efforts
Rapid technological innovation and favorable cost dynamics

13.2 Market challenges

Grid integration complexities and need for infrastructure modernization
Supply chain disruptions and critical mineral scarcity
Substantial capital requirements and financing complexities

13.3 Impact of drivers and challenges

Impact of drivers and challenges in 2025 and 2030

13.4 Market opportunities

Accelerated shift towards decentralized and digitalized energy grids
Emergence of green hydrogen as key decarbonization vector
Deepening sector coupling and widespread electrification of end-use sectors

14. Competitive Landscape

14.1 Overview

14.2

Overview on criticality of inputs and factors of differentiation

14.3 Landscape disruption

Overview on factors of disruption

14.4 Industry risks

Impact of key risks on business

15. Competitive Analysis

15.1 Companies profiled

Companies covered

15.2 Company ranking index

15.3 Market positioning of companies

Matrix on companies position and classification

15.4 ABB Ltd.

ABB Ltd. - Overview
ABB Ltd. - Business segments
ABB Ltd. - Key news
ABB Ltd. - Key offerings
ABB Ltd. - Segment focus
SWOT

15.5 Adani Green Energy Ltd.

Adani Green Energy Ltd. - Overview
Adani Green Energy Ltd. - Product / Service
Adani Green Energy Ltd. - Key offerings
SWOT

15.6 Bloom Energy Corp.

Bloom Energy Corp. - Overview
Bloom Energy Corp. - Product / Service
Bloom Energy Corp. - Key offerings
SWOT

15.7 BYD Co. Ltd.

BYD Co. Ltd. - Overview
BYD Co. Ltd. - Business segments
BYD Co. Ltd. - Key news
BYD Co. Ltd. - Key offerings
BYD Co. Ltd. - Segment focus
SWOT

15.8 Canadian Solar Inc.

Canadian Solar Inc. - Overview
Canadian Solar Inc. - Business segments
Canadian Solar Inc. - Key offerings
Canadian Solar Inc. - Segment focus
SWOT

15.9 Enel Spa

Enel Spa - Overview
Enel Spa - Business segments
Enel Spa - Key offerings
Enel Spa - Segment focus
SWOT

15.10 Enphase Energy Inc.

Enphase Energy Inc. - Overview
Enphase Energy Inc. - Product / Service
Enphase Energy Inc. - Key news
Enphase Energy Inc. - Key offerings
SWOT

15.11 GE Vernova Inc.

GE Vernova Inc. - Overview
GE Vernova Inc. - Business segments
GE Vernova Inc. - Key offerings
GE Vernova Inc. - Segment focus
SWOT

15.12 JinkoSolar Holding Co. Ltd.

JinkoSolar Holding Co. Ltd. - Overview
JinkoSolar Holding Co. Ltd. - Product / Service
JinkoSolar Holding Co. Ltd. - Key offerings
SWOT

15.13 Schneider Electric SE

Schneider Electric SE - Overview
Schneider Electric SE - Business segments
Schneider Electric SE - Key news
Schneider Electric SE - Key offerings
Schneider Electric SE - Segment focus
SWOT

15.14 Siemens Energy AG

Siemens Energy AG - Overview
Siemens Energy AG - Business segments
Siemens Energy AG - Key news
Siemens Energy AG - Key offerings
Siemens Energy AG - Segment focus
SWOT

15.15 SunPower Corp.

SunPower Corp. - Overview
SunPower Corp. - Business segments
SunPower Corp. - Key offerings
SunPower Corp. - Segment focus
SWOT

15.16 Tesla Inc.

Tesla Inc. - Overview
Tesla Inc. - Business segments
Tesla Inc. - Key news
Tesla Inc. - Key offerings
Tesla Inc. - Segment focus
SWOT

15.17 TotalEnergies SE

TotalEnergies SE - Overview
TotalEnergies SE - Business segments
TotalEnergies SE - Key news
TotalEnergies SE - Key offerings
TotalEnergies SE - Segment focus
SWOT

15.18 Vestas Wind Systems AS

Vestas Wind Systems AS - Overview
Vestas Wind Systems AS - Business segments
Vestas Wind Systems AS - Key offerings
Vestas Wind Systems AS - Segment focus
SWOT

16. Appendix

16.1 Scope of the report

Market definition
Objectives
Notes and caveats

16.2 Inclusions and exclusions checklist

Inclusions checklist
Exclusions checklist

16.3 Currency conversion rates for US$

16.4 Research methodology

16.5 Data procurement

Information sources

16.6 Data validation

16.7 Validation techniques employed for market sizing

16.8 Data synthesis

16.9 360 degree market analysis

16.10 List of abbreviations

Research Methodology

Technavio presents a detailed picture of the market by way of study, synthesis, and summation of data from multiple sources. The analysts have presented the various facets of the market with a particular focus on identifying the key industry influencers. The data thus presented is comprehensive, reliable, and the result of extensive research, both primary and secondary.

INFORMATION SOURCES

Primary sources

  • Manufacturers and suppliers
  • Channel partners
  • Industry experts
  • Strategic decision makers

Secondary sources

  • Industry journals and periodicals
  • Government data
  • Financial reports of key industry players
  • Historical data
  • Press releases

DATA ANALYSIS

Data Synthesis

  • Collation of data
  • Estimation of key figures
  • Analysis of derived insights

Data Validation

  • Triangulation with data models
  • Reference against proprietary databases
  • Corroboration with industry experts

REPORT WRITING

Qualitative

  • Market drivers
  • Market challenges
  • Market trends
  • Five forces analysis

Quantitative

  • Market size and forecast
  • Market segmentation
  • Geographical insights
  • Competitive landscape

Interested in this report?

Get your sample now to see our research methodology and insights!

Download Now

Frequently Asked Questions

Clean Energy Technologies market growth will increase by USD 106572.8 million during 2026-2030.

The Clean Energy Technologies market is expected to grow at a CAGR of 5.7% during 2026-2030.

Clean Energy Technologies market is segmented by Technology (Hydropower, Clean coal, Wind, Solar, Others) End-user (Industrial, Residential, Commercial) Deployment (On-grid, Off-grid, Hybrid systems)

ABB Ltd., Adani Green Energy Ltd., Ballard Power Systems Inc., Bloom Energy Corp., BYD Co. Ltd., Canadian Solar Inc., Enel Spa, Enphase Energy Inc., First Solar Inc., GE Vernova Inc., Iberdrola SA, JinkoSolar Holding Co. Ltd., Schneider Electric SE, Siemens Energy AG, SolarEdge Technologies Inc., SunPower Corp., Tesla Inc., TotalEnergies SE, Trina Solar Co. Ltd., Vestas Wind Systems AS are a few of the key vendors in the Clean Energy Technologies market.

APAC will register the highest growth rate of 32.6% among the other regions. Therefore, the Clean Energy Technologies market in APAC is expected to garner significant business opportunities for the vendors during the forecast period.

China, Japan, India, South Korea, Australia, Indonesia, Germany, UK, France, Italy, Spain, The Netherlands, US, Canada, Mexico, Brazil, Argentina, Chile, Saudi Arabia, UAE, South Africa, Israel, Turkey

  • Conducive regulatory frameworks and governmental support is the driving factor this market.

The Clean Energy Technologies market vendors should focus on grabbing business opportunities from the Technology segment as it accounted for the largest market share in the base year.
RIA - Research AI Assistant
Ask RIA