Cleansing Lotion Market Analysis, Size, and Forecast 2026-2030: APAC (China, Japan, and South Korea), North America (US, Canada, and Mexico), Europe (Germany, France, and UK), South America (Brazil and Argentina), Middle East and Africa (Saudi Arabia, UAE, and South Africa), and Rest of World (ROW)

Cleansing Lotion Market Analysis, Size, and Forecast 2026-2030:
APAC (China, Japan, and South Korea), North America (US, Canada, and Mexico), Europe (Germany, France, and UK), South America (Brazil and Argentina), Middle East and Africa (Saudi Arabia, UAE, and South Africa), and Rest of World (ROW)

Published: Apr 2026 351 Pages SKU: IRTNTR40708

Market Overview at a Glance

$2.71 B
Market Opportunity
6.1%
CAGR 2025 - 2030
43.5%
APAC Growth
$5.20 B
Offline segment 2024

Cleansing Lotion Market Size 2026-2030

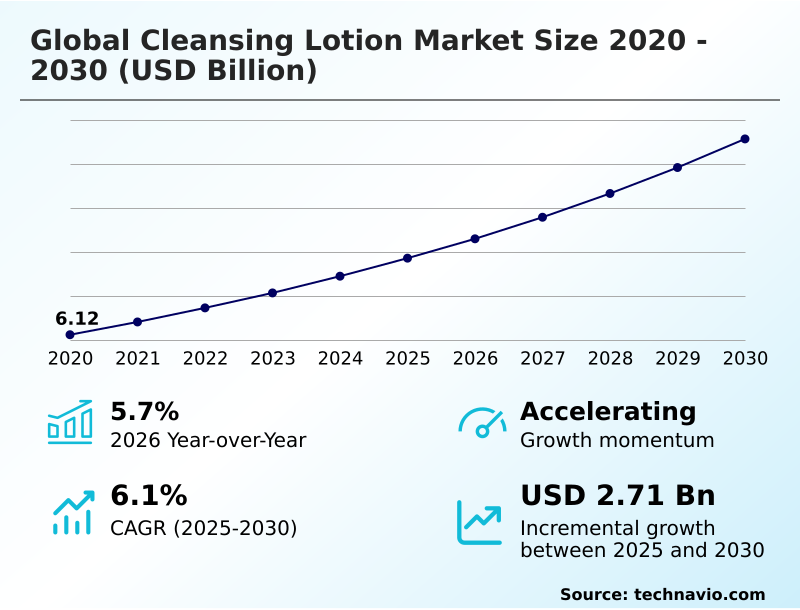
The cleansing lotion market size is valued to increase by USD 2.71 billion, at a CAGR of 6.1% from 2025 to 2030. Evolution of skinification trend in global personal care will drive the cleansing lotion market.

Major Market Trends & Insights

  • APAC dominated the market and accounted for a 43.5% growth during the forecast period.
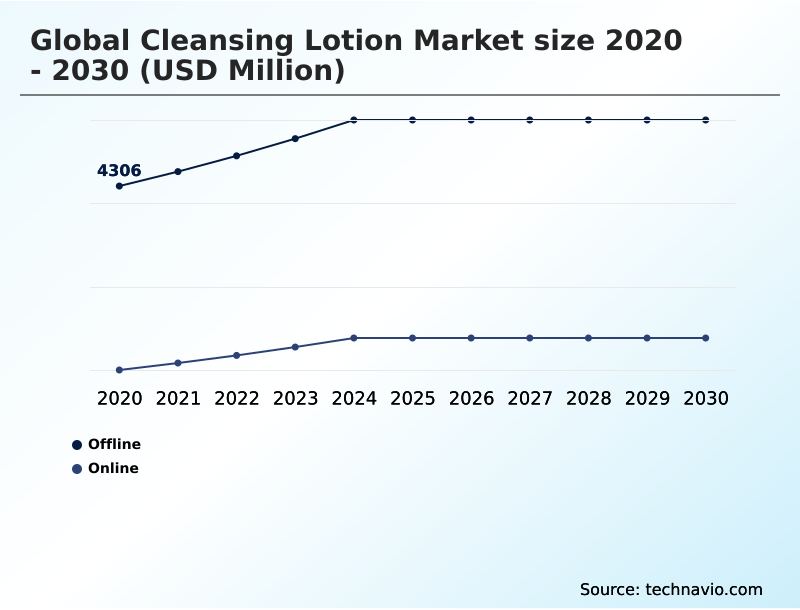
  • By Distribution Channel - Offline segment was valued at USD 5.20 billion in 2024
  • By End-user - Household segment accounted for the largest market revenue share in 2024

Market Size & Forecast

  • Market Opportunities: USD 4.45 billion
  • Market Future Opportunities: USD 2.71 billion
  • CAGR from 2025 to 2030 : 6.1%

Market Summary

  • The cleansing lotion market is undergoing significant transformation, driven by an educated consumer base demanding more than basic hygiene. This shift, known as 'skinification,' reframes cleansing as a therapeutic, non-negotiable step in a daily health regimen.
  • Demand is surging for sophisticated formulations containing active ingredients like niacinamide and hyaluronic acid, which address specific concerns such as barrier repair and anti-pollution protection. Consequently, manufacturers are pivoting from traditional surfactant-heavy formulas to advanced, lipid-replenishing lotions that preserve the skin's natural state.
  • A key operational scenario involves companies reformulating product lines to meet new 'clean beauty' and cosmetic regulation compliance standards. This requires navigating complex challenges, such as sourcing effective but costly biodegradable ingredients and re-engineering the supply chain to maintain profitability without compromising on ingredient safety standards or active ingredient efficacy.
  • This evolving landscape rewards brands that can demonstrate clinical validation, ethical transparency, and an ability to integrate dermatological science into accessible products.

What will be the Size of the Cleansing Lotion Market during the forecast period?

Get Key Insights on Market Forecast (PDF) Request Free Sample

How is the Cleansing Lotion Market Segmented?

The cleansing lotion industry research report provides comprehensive data (region-wise segment analysis), with forecasts and estimates in "USD million" for the period 2026-2030, as well as historical data from 2020-2024 for the following segments.

  • Distribution channel
    • Offline
    • Online
  • End-user
    • Household
    • Commercial
  • Product
    • Cream-based
    • Foam-based
    • Gel-based
    • Oil-based
    • Others
  • Application
    • Facial cleansing lotions
    • Body cleansing lotions
    • Eye makeup remover cleansing lotions
    • Lip cleansing lotions
  • Type
    • Normal skin
    • Oily skin
    • Dry skin
    • Sensitive skin
    • Combination skin
  • Geography
    • APAC
      • China
      • Japan
      • South Korea
    • North America
      • US
      • Canada
      • Mexico
    • Europe
      • Germany
      • France
      • UK
    • South America
      • Brazil
      • Argentina
    • Middle East and Africa
      • Saudi Arabia
      • UAE
      • South Africa
    • Rest of World (ROW)

By Distribution Channel Insights

The offline segment is estimated to witness significant growth during the forecast period.

The offline channel remains critical, particularly within the premium skincare segment, where consumers can physically evaluate products like a cream-based emulsion or oil-based formula.

This hands-on experience is vital for sensitive skin care, allowing shoppers to assess a gentle skin cleanser before purchase.

In-store consultants are pivotal, with some retailers reporting a 25% higher conversion rate for facial cleansing lotion when expert guidance on maintaining skin barrier integrity is provided.

This direct interaction fosters consumer brand loyalty and reinforces trust in dermatologist-tested lotion offerings.

Furthermore, physical stores are increasingly showcasing innovations in cold-process manufacturing and circular packaging models, allowing brands to communicate their commitment to sustainability through tangible product displays like a soothing cleansing milk or hydrating cleansing lotion.

Request Free Sample

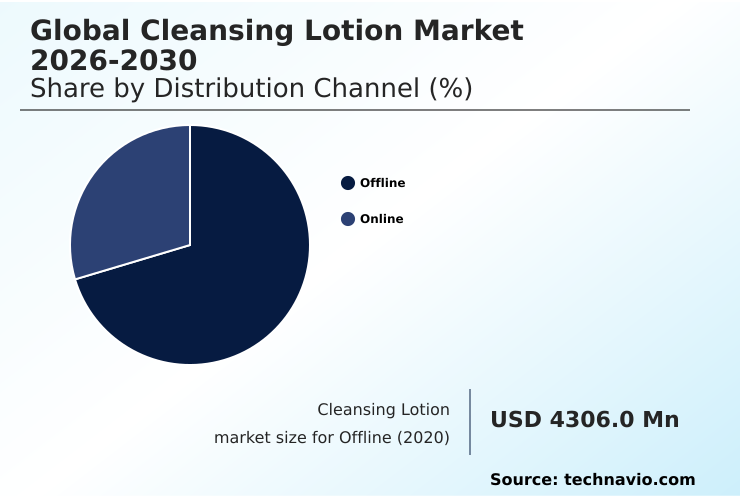
The Offline segment was valued at USD 5.20 billion in 2024 and showed a gradual increase during the forecast period.

Request Free Sample

Regional Analysis

APAC is estimated to contribute 43.5% to the growth of the global market during the forecast period.Technavio’s analysts have elaborately explained the regional trends and drivers that shape the market during the forecast period.

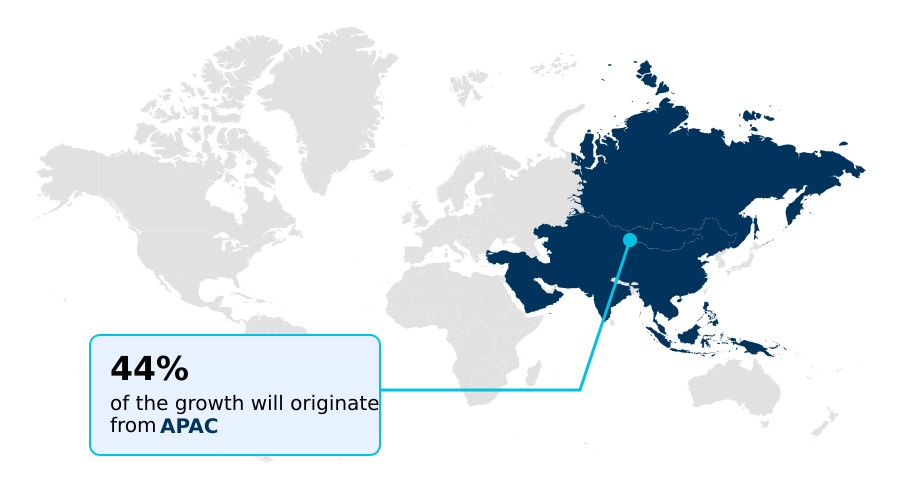
See How Cleansing Lotion Market Demand is Rising in APAC Request Free Sample

The geographic landscape is dominated by the APAC region, which accounts for over 40% of the market's incremental growth, driven by a sophisticated consumer base demanding advanced skincare.

In this premium skincare segment, there is a strong preference for products like a ceramide-rich formula or a specialized anti-pollution cleanser.

This has spurred innovation in dermatological science, leading to the development of the hypoallergenic skin cleanser and pH-balanced face wash.

European markets, while mature, are leading the push for sustainability, with a focus on the organic cleansing solution and refillable cleansing lotion formats. Across North America, the demand for a fragrance-free formulation and phthalate-free skin care is standard.

The adoption of upcycled ingredients and leave-on cleansing product formats is also gaining traction globally as brands cater to evolving consumer ethics.
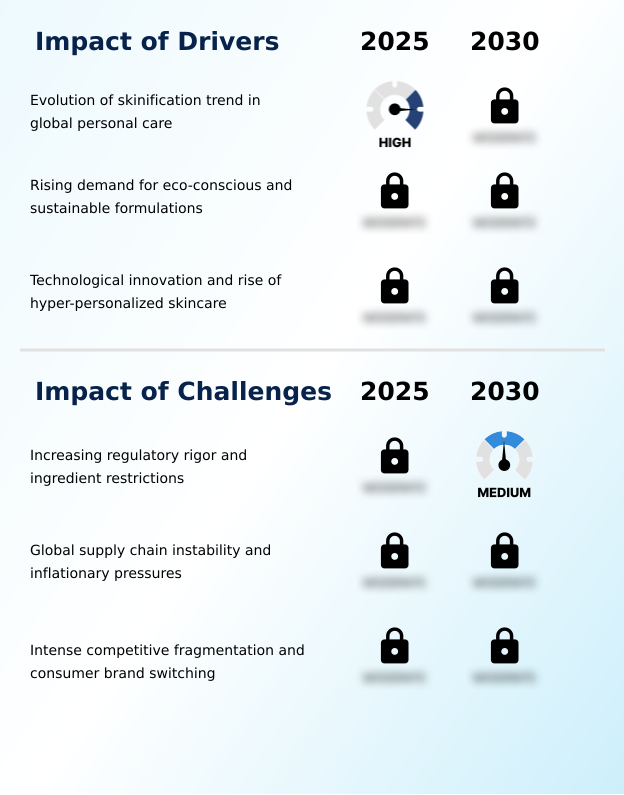
Market Dynamics

Our researchers analyzed the data with 2025 as the base year, along with the key drivers, trends, and challenges. A holistic analysis of drivers will help companies refine their marketing strategies to gain a competitive advantage.

  • Consumers are increasingly seeking targeted solutions, leading to specific queries like finding the best cleansing lotion for acne or the most effective cleanser for protecting skin microbiome. The discussion around cleansing lotion vs micellar water continues, with users wanting to know how to use cleansing lotion properly for their skin type.
  • There is high demand for a daily cleansing lotion for oily skin and a deeply hydrating cleanser for dry skin, showcasing the need for personalized skincare. The interest in natural cleansing lotion ingredients is pushing brands toward transparency.
  • Shoppers frequently search for the best cleanser for sensitive skin and a cleansing milk for combination skin, highlighting the need for specialized formulations. The benefits of the double cleansing method are now widely recognized, driving sales of products like a gentle eye makeup remover lotion and moisturizing body cleansing lotion.
  • The market is also seeing growth in niche categories such as a sulfate free foaming face wash and unscented lotion for reactive skin. Ethical considerations are paramount, with searches for a vegan and cruelty-free facial cleanser and refillable packaging for skin cleansers on the rise.
  • Ultimately, consumers trust a dermatologist recommended facial cleanser and are drawn to the idea of a personalized skincare routine cleanser. Companies focusing on these niche demands see customer retention rates nearly double those that do not.

What are the key market drivers leading to the rise in the adoption of Cleansing Lotion Industry?

  • The evolution of the 'skinification' trend in global personal care, which treats cleansing as a critical therapeutic step, is a key market driver.

  • The 'skinification' of personal care and the demand for sustainable options are significant market drivers. Consumers now seek a daily facial cleanser that offers therapeutic benefits, fueling innovation in hyper-personalized skincare and waterless beauty format products.
  • This has expanded the market for specialized items like a targeted eye makeup remover and lip cleansing lotion.
  • Formulations are increasingly tailored, with an oily skin formulation designed for sebum control and a hydrating cleansing lotion with enhanced dry skin hydration properties.
  • The move toward biodegradable ingredients and sustainable skincare packaging is a response to consumer demand, with brands offering a vegan skincare cleanser gaining market share twice as fast as competitors.
  • Furthermore, the rise of direct-to-consumer skincare channels has made dermatologist-tested lotion offerings more accessible, increasing consumer adoption rates by 30% in key demographics.

What are the market trends shaping the Cleansing Lotion Industry?

  • A primary market trend is the rising emphasis on preserving skin barrier integrity. This is coupled with a focus on protecting the cutaneous microbiome through advanced formulations.

  • Key market trends are redefining product development, with a focus on microbiome protection and the integration of AI-powered skin diagnostics. This shift is driving demand for advanced formulations like a gentle skin cleanser that supports the skin's natural ecosystem, moving beyond a simple rinse-off facial cleanser.
  • Innovations include the sophisticated micellar water formulation and specialized gel-based cleanser types that offer targeted benefits for combination skin balance. As brands align with cosmetic regulation compliance, the adoption of paraben-free cleanser formulations is now standard, enhancing consumer trust. This emphasis on safety and efficacy has improved active ingredient efficacy by an estimated 20% in newer product lines.
  • Moreover, companies with high supply chain transparency for products like body cleansing lotion report a 15% stronger brand affinity among ethically conscious consumers.

What challenges does the Cleansing Lotion Industry face during its growth?

  • Increasingly stringent regulatory frameworks and new restrictions on ingredients present a key challenge impacting the industry's growth and formulation strategies.

  • The market faces challenges from intense competition and complex regulatory hurdles. The proliferation of niche beauty brands creates a fragmented landscape, making it difficult for even a high-quality clinical-grade cleanser to stand out. Companies must navigate stringent ingredient safety standards, which impacts the use of certain botanical extracts and the niacinamide inclusion levels.
  • The demand for a natural ingredient cleanser that is also a cruelty-free beauty product adds sourcing and certification complexities. Formulating a nourishing cleansing lotion with advanced components like prebiotic skincare and postbiotic additives, or ensuring optimal hyaluronic acid concentration, requires significant R&D investment.
  • This environment puts pressure on profitability, as the cost of developing a unique, sulfate-free surfactant for a product targeting a normal skin type can be 25% higher than traditional methods, affecting overall margins.

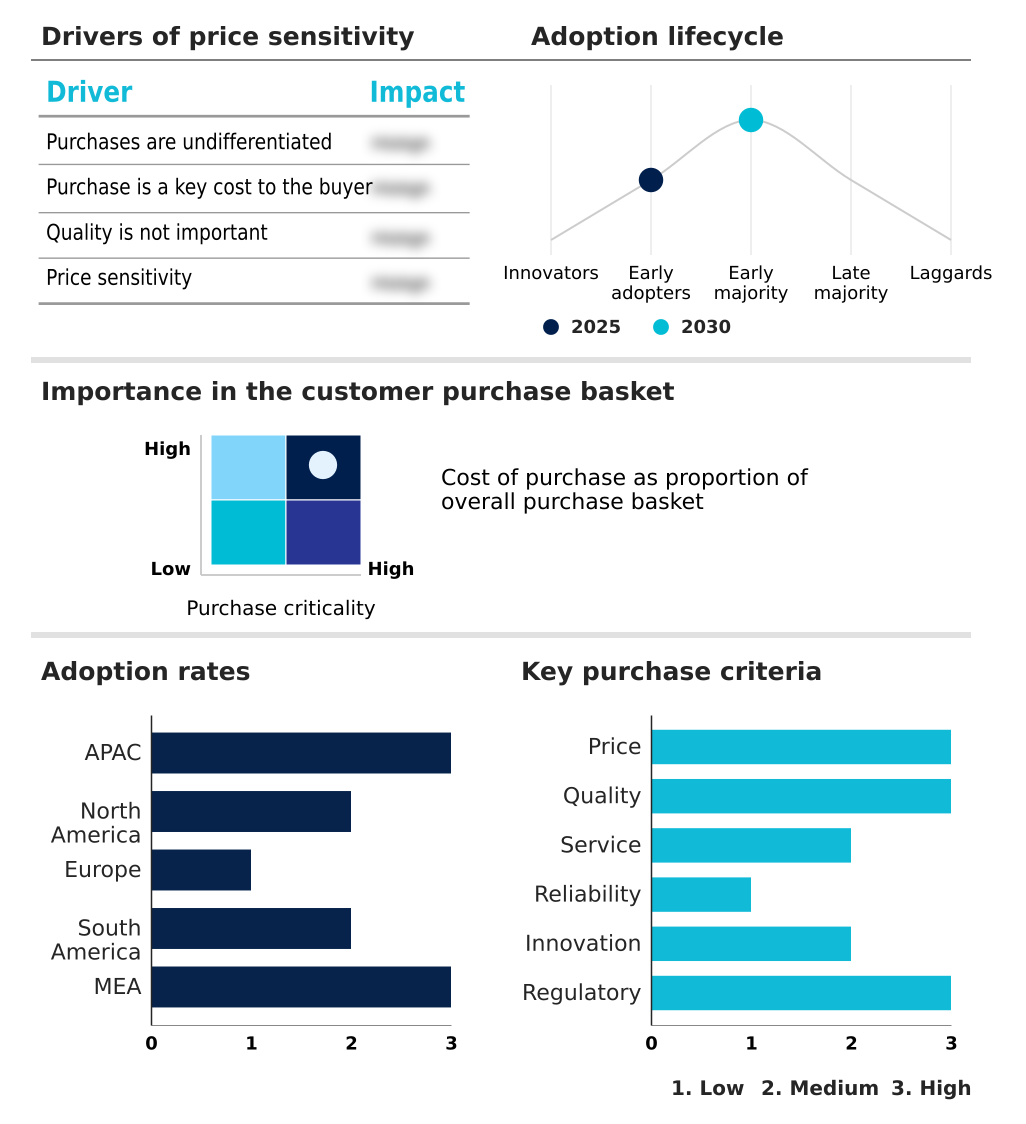
Exclusive Technavio Analysis on Customer Landscape

The cleansing lotion market forecasting report includes the adoption lifecycle of the market, covering from the innovator’s stage to the laggard’s stage. It focuses on adoption rates in different regions based on penetration. Furthermore, the cleansing lotion market report also includes key purchase criteria and drivers of price sensitivity to help companies evaluate and develop their market growth analysis strategies.

Customer Landscape of Cleansing Lotion Industry

Competitive Landscape

Companies are implementing various strategies, such as strategic alliances, cleansing lotion market forecast, partnerships, mergers and acquisitions, geographical expansion, and product/service launches, to enhance their presence in the industry.

Amway Corp. - A diverse portfolio of products is offered, spanning beauty, personal care, and wellness categories to meet various consumer needs.

The industry research and growth report includes detailed analyses of the competitive landscape of the market and information about key companies, including:

  • Amway Corp.
  • Beiersdorf AG
  • Caudalie International SE
  • Coty Inc.
  • Galderma Group AG
  • Groupe Clarins
  • Kao Corp.
  • Kenvue Inc.
  • LG Household and Health Care Ltd.
  • Loreal SA
  • Mary Kay Inc.
  • Oriflame Cosmetics SA
  • Pierre Fabre SA
  • Procter and Gamble Co.
  • Revlon Inc.
  • Shiseido Co. Ltd.
  • SISLEY
  • The Estee Lauder Co.
  • Unilever PLC
  • Valmont Group

Qualitative and quantitative analysis of companies has been conducted to help clients understand the wider business environment as well as the strengths and weaknesses of key industry players. Data is qualitatively analyzed to categorize companies as pure play, category-focused, industry-focused, and diversified; it is quantitatively analyzed to categorize companies as dominant, leading, strong, tentative, and weak.

Recent Development and News in Cleansing lotion market

  • In February, 2025, Beiersdorf AG announced the global rollout of a patented cleansing lotion technology featuring a bio-fermented lipid complex designed for immediate skin barrier repair during washing.
  • In March, 2025, Loreal SA expanded its CeraVe brand with a new clinical-grade cleansing lotion line that uses multivesicular emulsion technology for sustained release of moisturizing agents.
  • In August, 2025, Unilever PLC launched a major initiative to transition its entire cleansing lotion portfolio to packaging made from 100% recycled plastics and expand its waterless solid-format cleansers.
  • In October, 2025, Shiseido Co. Ltd. unveiled an AI-powered diagnostic tool that analyzes skin surface proteins to recommend a bespoke cleansing lotion formulation for individual users.

Dive into Technavio’s robust research methodology, blending expert interviews, extensive data synthesis, and validated models for unparalleled Cleansing Lotion Market insights. See full methodology.

Market Scope
Page number 351
Base year 2025
Historic period 2020-2024
Forecast period 2026-2030
Growth momentum & CAGR Accelerate at a CAGR of 6.1%
Market growth 2026-2030 USD 2709.7 million
Market structure Fragmented
YoY growth 2025-2026(%) 5.7%
Key countries China, Japan, South Korea, India, Australia, Indonesia, US, Canada, Mexico, Germany, France, UK, Italy, Spain, Russia, Brazil, Argentina, Chile, Saudi Arabia, UAE, South Africa, Egypt and Nigeria
Competitive landscape Leading Companies, Market Positioning of Companies, Competitive Strategies, and Industry Risks

Request Free Sample

Research Analyst Overview

  • The cleansing lotion market's competitive edge is now defined by scientific innovation and sustainability. A strategic boardroom focus is on balancing R&D for a ceramide-rich formula or hyper-personalized skincare with the high capex required for circular packaging models.
  • The industry is advancing beyond a simple facial cleansing lotion to sophisticated offerings like an oil-based formula for makeup removal and a specialized body cleansing lotion. Formulations cater to every skin type, from a gentle oily skin formulation and hydrating dry skin hydration product to sensitive skin care and combination skin balance solutions.
  • The push for a non-comedogenic formula is standard, while a sulfate-free surfactant is becoming the norm. The market is also seeing a shift toward a waterless beauty format and the inclusion of niacinamide inclusion, alongside a higher hyaluronic acid concentration.
  • Key developments in a bio-fermented lipid complex and multivesicular emulsion technology are protected by a significant number of new patents, with some firms filing over 70 in a single year. These innovations enhance microbiome protection and skin barrier integrity, incorporating prebiotic skincare, postbiotic additives, botanical extracts, upcycled ingredients, and even cold-process manufacturing for a superior anti-pollution cleanser.

What are the Key Data Covered in this Cleansing Lotion Market Research and Growth Report?

  • What is the expected growth of the Cleansing Lotion Market between 2026 and 2030?

    • USD 2.71 billion, at a CAGR of 6.1%

  • What segmentation does the market report cover?

    • The report is segmented by Distribution Channel (Offline, and Online), End-user (Household, and Commercial), Product (Cream-based, Foam-based, Gel-based, Oil-based, and Others), Application (Facial cleansing lotions, Body cleansing lotions, Eye makeup remover cleansing lotions, and Lip cleansing lotions), Type (Normal skin, Oily skin, Dry skin, Sensitive skin, and Combination skin) and Geography (APAC, North America, Europe, South America, Middle East and Africa)

  • Which regions are analyzed in the report?

    • APAC, North America, Europe, South America and Middle East and Africa

  • What are the key growth drivers and market challenges?

    • Evolution of skinification trend in global personal care, Increasing regulatory rigor and ingredient restrictions

  • Who are the major players in the Cleansing Lotion Market?

    • Amway Corp., Beiersdorf AG, Caudalie International SE, Coty Inc., Galderma Group AG, Groupe Clarins, Kao Corp., Kenvue Inc., LG Household and Health Care Ltd., Loreal SA, Mary Kay Inc., Oriflame Cosmetics SA, Pierre Fabre SA, Procter and Gamble Co., Revlon Inc., Shiseido Co. Ltd., SISLEY, The Estee Lauder Co., Unilever PLC and Valmont Group

Market Research Insights

  • Market dynamics are shaped by a pronounced consumer shift toward specialized skincare, with direct-to-consumer skincare models gaining significant traction. Firms targeting the APAC region, which represents 43.5% of the market's incremental growth opportunity, are focusing on supply chain transparency to mitigate risks; some have reported logistical cost increases of up to 15%.
  • This environment pressures companies to innovate beyond the product, emphasizing sustainable skincare packaging and cruelty-free beauty product certifications to secure consumer brand loyalty. In the premium skincare segment, success hinges on delivering clinically validated, dermatologist-tested lotions that justify higher price points.
  • As niche beauty brands continue to enter the market, established players must refine their strategies to compete on both active ingredient efficacy and ethical production, ensuring alignment with modern consumer values.

We can help! Our analysts can customize this cleansing lotion market research report to meet your requirements.

Get in touch

1. Executive Summary

1.1 Market overview

Executive Summary - Chart on Market Overview
Executive Summary - Data Table on Market Overview
Executive Summary - Chart on Global Market Characteristics
Executive Summary - Chart on Market by Geography
Executive Summary - Chart on Market Segmentation by Distribution Channel
Executive Summary - Chart on Market Segmentation by End-user
Executive Summary - Chart on Market Segmentation by Product
Executive Summary - Chart on Market Segmentation by Application
Executive Summary - Chart on Market Segmentation by Type
Executive Summary - Chart on Incremental Growth
Executive Summary - Data Table on Incremental Growth
Executive Summary - Chart on Company Market Positioning

2. Technavio Analysis

2.1 Analysis of price sensitivity, lifecycle, customer purchase basket, adoption rates, and purchase criteria

2.2 Criticality of inputs and Factors of differentiation

Chart on Overview on criticality of inputs and factors of differentiation

2.3 Factors of disruption

Chart on Overview on factors of disruption

2.4 Impact of drivers and challenges

Chart on Impact of drivers and challenges in 2025 and 2030

3. Market Landscape

3.1 Market ecosystem

Chart on Parent Market
Data Table on - Parent Market

3.2 Market characteristics

Chart on Market characteristics analysis

3.3 Value chain analysis

Chart on Value chain analysis

4. Market Sizing

4.1 Market definition

Data Table on Offerings of companies included in the market definition

4.2 Market segment analysis

Market segments

4.3 Market size 2025

4.4 Market outlook: Forecast for 2025-2030

Chart on Global - Market size and forecast 2025-2030 ($ million)
Data Table on Global - Market size and forecast 2025-2030 ($ million)
Chart on Global Market: Year-over-year growth 2025-2030 (%)
Data Table on Global Market: Year-over-year growth 2025-2030 (%)

5. Historic Market Size

5.1 Global Cleansing Lotion Market 2020 - 2024

Historic Market Size - Data Table on Global Cleansing Lotion Market 2020 - 2024 ($ million)

5.2 Distribution Channel segment analysis 2020 - 2024

Historic Market Size - Distribution Channel Segment 2020 - 2024 ($ million)

5.3 End-user segment analysis 2020 - 2024

Historic Market Size - End-user Segment 2020 - 2024 ($ million)

5.4 Product segment analysis 2020 - 2024

Historic Market Size - Product Segment 2020 - 2024 ($ million)

5.5 Application segment analysis 2020 - 2024

Historic Market Size - Application Segment 2020 - 2024 ($ million)

5.6 Type segment analysis 2020 - 2024

Historic Market Size - Type Segment 2020 - 2024 ($ million)

5.7 Geography segment analysis 2020 - 2024

Historic Market Size - Geography Segment 2020 - 2024 ($ million)

5.8 Country segment analysis 2020 - 2024

Historic Market Size - Country Segment 2020 - 2024 ($ million)

6. Qualitative Analysis

6.1 Impact of AI on Global Cleansing Lotion Market

6.2 Impact of Geopolitical Conflicts on Global Cleansing Lotion Market

7. Five Forces Analysis

7.1 Five forces summary

Five forces analysis - Comparison between 2025 and 2030

7.2 Bargaining power of buyers

Bargaining power of buyers - Impact of key factors 2025 and 2030

7.3 Bargaining power of suppliers

Bargaining power of suppliers - Impact of key factors in 2025 and 2030

7.4 Threat of new entrants

Threat of new entrants - Impact of key factors in 2025 and 2030

7.5 Threat of substitutes

Threat of substitutes - Impact of key factors in 2025 and 2030

7.6 Threat of rivalry

Threat of rivalry - Impact of key factors in 2025 and 2030

7.7 Market condition

Chart on Market condition - Five forces 2025 and 2030

8. Market Segmentation by Distribution Channel

8.1 Market segments

Chart on Distribution Channel - Market share 2025-2030 (%)
Data Table on Distribution Channel - Market share 2025-2030 (%)

8.2 Comparison by Distribution Channel

Chart on Comparison by Distribution Channel
Data Table on Comparison by Distribution Channel

8.3 Offline - Market size and forecast 2025-2030

Chart on Offline - Market size and forecast 2025-2030 ($ million)
Data Table on Offline - Market size and forecast 2025-2030 ($ million)
Chart on Offline - Year-over-year growth 2025-2030 (%)
Data Table on Offline - Year-over-year growth 2025-2030 (%)

8.4 Online - Market size and forecast 2025-2030

Chart on Online - Market size and forecast 2025-2030 ($ million)
Data Table on Online - Market size and forecast 2025-2030 ($ million)
Chart on Online - Year-over-year growth 2025-2030 (%)
Data Table on Online - Year-over-year growth 2025-2030 (%)

8.5 Market opportunity by Distribution Channel

Market opportunity by Distribution Channel ($ million)
Data Table on Market opportunity by Distribution Channel ($ million)

9. Market Segmentation by End-user

9.1 Market segments

Chart on End-user - Market share 2025-2030 (%)
Data Table on End-user - Market share 2025-2030 (%)

9.2 Comparison by End-user

Chart on Comparison by End-user
Data Table on Comparison by End-user

9.3 Household - Market size and forecast 2025-2030

Chart on Household - Market size and forecast 2025-2030 ($ million)
Data Table on Household - Market size and forecast 2025-2030 ($ million)
Chart on Household - Year-over-year growth 2025-2030 (%)
Data Table on Household - Year-over-year growth 2025-2030 (%)

9.4 Commercial - Market size and forecast 2025-2030

Chart on Commercial - Market size and forecast 2025-2030 ($ million)
Data Table on Commercial - Market size and forecast 2025-2030 ($ million)
Chart on Commercial - Year-over-year growth 2025-2030 (%)
Data Table on Commercial - Year-over-year growth 2025-2030 (%)

9.5 Market opportunity by End-user

Market opportunity by End-user ($ million)
Data Table on Market opportunity by End-user ($ million)

10. Market Segmentation by Product

10.1 Market segments

Chart on Product - Market share 2025-2030 (%)
Data Table on Product - Market share 2025-2030 (%)

10.2 Comparison by Product

Chart on Comparison by Product
Data Table on Comparison by Product

10.3 Cream-based - Market size and forecast 2025-2030

Chart on Cream-based - Market size and forecast 2025-2030 ($ million)
Data Table on Cream-based - Market size and forecast 2025-2030 ($ million)
Chart on Cream-based - Year-over-year growth 2025-2030 (%)
Data Table on Cream-based - Year-over-year growth 2025-2030 (%)

10.4 Foam-based - Market size and forecast 2025-2030

Chart on Foam-based - Market size and forecast 2025-2030 ($ million)
Data Table on Foam-based - Market size and forecast 2025-2030 ($ million)
Chart on Foam-based - Year-over-year growth 2025-2030 (%)
Data Table on Foam-based - Year-over-year growth 2025-2030 (%)

10.5 Gel-based - Market size and forecast 2025-2030

Chart on Gel-based - Market size and forecast 2025-2030 ($ million)
Data Table on Gel-based - Market size and forecast 2025-2030 ($ million)
Chart on Gel-based - Year-over-year growth 2025-2030 (%)
Data Table on Gel-based - Year-over-year growth 2025-2030 (%)

10.6 Oil-based - Market size and forecast 2025-2030

Chart on Oil-based - Market size and forecast 2025-2030 ($ million)
Data Table on Oil-based - Market size and forecast 2025-2030 ($ million)
Chart on Oil-based - Year-over-year growth 2025-2030 (%)
Data Table on Oil-based - Year-over-year growth 2025-2030 (%)

10.7 Others - Market size and forecast 2025-2030

Chart on Others - Market size and forecast 2025-2030 ($ million)
Data Table on Others - Market size and forecast 2025-2030 ($ million)
Chart on Others - Year-over-year growth 2025-2030 (%)
Data Table on Others - Year-over-year growth 2025-2030 (%)

10.8 Market opportunity by Product

Market opportunity by Product ($ million)
Data Table on Market opportunity by Product ($ million)

11. Market Segmentation by Application

11.1 Market segments

Chart on Application - Market share 2025-2030 (%)
Data Table on Application - Market share 2025-2030 (%)

11.2 Comparison by Application

Chart on Comparison by Application
Data Table on Comparison by Application

11.3 Facial cleansing lotions - Market size and forecast 2025-2030

Chart on Facial cleansing lotions - Market size and forecast 2025-2030 ($ million)
Data Table on Facial cleansing lotions - Market size and forecast 2025-2030 ($ million)
Chart on Facial cleansing lotions - Year-over-year growth 2025-2030 (%)
Data Table on Facial cleansing lotions - Year-over-year growth 2025-2030 (%)

11.4 Body cleansing lotions - Market size and forecast 2025-2030

Chart on Body cleansing lotions - Market size and forecast 2025-2030 ($ million)
Data Table on Body cleansing lotions - Market size and forecast 2025-2030 ($ million)
Chart on Body cleansing lotions - Year-over-year growth 2025-2030 (%)
Data Table on Body cleansing lotions - Year-over-year growth 2025-2030 (%)

11.5 Eye makeup remover cleansing lotions - Market size and forecast 2025-2030

Chart on Eye makeup remover cleansing lotions - Market size and forecast 2025-2030 ($ million)
Data Table on Eye makeup remover cleansing lotions - Market size and forecast 2025-2030 ($ million)
Chart on Eye makeup remover cleansing lotions - Year-over-year growth 2025-2030 (%)
Data Table on Eye makeup remover cleansing lotions - Year-over-year growth 2025-2030 (%)

11.6 Lip cleansing lotions - Market size and forecast 2025-2030

Chart on Lip cleansing lotions - Market size and forecast 2025-2030 ($ million)
Data Table on Lip cleansing lotions - Market size and forecast 2025-2030 ($ million)
Chart on Lip cleansing lotions - Year-over-year growth 2025-2030 (%)
Data Table on Lip cleansing lotions - Year-over-year growth 2025-2030 (%)

11.7 Market opportunity by Application

Market opportunity by Application ($ million)
Data Table on Market opportunity by Application ($ million)

12. Market Segmentation by Type

12.1 Market segments

Chart on Type - Market share 2025-2030 (%)
Data Table on Type - Market share 2025-2030 (%)

12.2 Comparison by Type

Chart on Comparison by Type
Data Table on Comparison by Type

12.3 Normal skin - Market size and forecast 2025-2030

Chart on Normal skin - Market size and forecast 2025-2030 ($ million)
Data Table on Normal skin - Market size and forecast 2025-2030 ($ million)
Chart on Normal skin - Year-over-year growth 2025-2030 (%)
Data Table on Normal skin - Year-over-year growth 2025-2030 (%)

12.4 Oily skin - Market size and forecast 2025-2030

Chart on Oily skin - Market size and forecast 2025-2030 ($ million)
Data Table on Oily skin - Market size and forecast 2025-2030 ($ million)
Chart on Oily skin - Year-over-year growth 2025-2030 (%)
Data Table on Oily skin - Year-over-year growth 2025-2030 (%)

12.5 Dry skin - Market size and forecast 2025-2030

Chart on Dry skin - Market size and forecast 2025-2030 ($ million)
Data Table on Dry skin - Market size and forecast 2025-2030 ($ million)
Chart on Dry skin - Year-over-year growth 2025-2030 (%)
Data Table on Dry skin - Year-over-year growth 2025-2030 (%)

12.6 Sensitive skin - Market size and forecast 2025-2030

Chart on Sensitive skin - Market size and forecast 2025-2030 ($ million)
Data Table on Sensitive skin - Market size and forecast 2025-2030 ($ million)
Chart on Sensitive skin - Year-over-year growth 2025-2030 (%)
Data Table on Sensitive skin - Year-over-year growth 2025-2030 (%)

12.7 Combination skin - Market size and forecast 2025-2030

Chart on Combination skin - Market size and forecast 2025-2030 ($ million)
Data Table on Combination skin - Market size and forecast 2025-2030 ($ million)
Chart on Combination skin - Year-over-year growth 2025-2030 (%)
Data Table on Combination skin - Year-over-year growth 2025-2030 (%)

12.8 Market opportunity by Type

Market opportunity by Type ($ million)
Data Table on Market opportunity by Type ($ million)

13. Customer Landscape

13.1 Customer landscape overview

Analysis of price sensitivity, lifecycle, customer purchase basket, adoption rates, and purchase criteria

14. Geographic Landscape

14.1 Geographic segmentation

Chart on Market share by geography 2025-2030 (%)
Data Table on Market share by geography 2025-2030 (%)

14.2 Geographic comparison

Chart on Geographic comparison
Data Table on Geographic comparison

14.3 APAC - Market size and forecast 2025-2030

Chart on APAC - Market size and forecast 2025-2030 ($ million)
Data Table on APAC - Market size and forecast 2025-2030 ($ million)
Chart on APAC - Year-over-year growth 2025-2030 (%)
Data Table on APAC - Year-over-year growth 2025-2030 (%)
Chart on Regional Comparison - APAC
Data Table on Regional Comparison - APAC

14.3.1 China - Market size and forecast 2025-2030

Chart on China - Market size and forecast 2025-2030 ($ million)
Data Table on China - Market size and forecast 2025-2030 ($ million)
Chart on China - Year-over-year growth 2025-2030 (%)
Data Table on China - Year-over-year growth 2025-2030 (%)

14.3.2 Japan - Market size and forecast 2025-2030

Chart on Japan - Market size and forecast 2025-2030 ($ million)
Data Table on Japan - Market size and forecast 2025-2030 ($ million)
Chart on Japan - Year-over-year growth 2025-2030 (%)
Data Table on Japan - Year-over-year growth 2025-2030 (%)

14.3.3 South Korea - Market size and forecast 2025-2030

Chart on South Korea - Market size and forecast 2025-2030 ($ million)
Data Table on South Korea - Market size and forecast 2025-2030 ($ million)
Chart on South Korea - Year-over-year growth 2025-2030 (%)
Data Table on South Korea - Year-over-year growth 2025-2030 (%)

14.3.4 India - Market size and forecast 2025-2030

Chart on India - Market size and forecast 2025-2030 ($ million)
Data Table on India - Market size and forecast 2025-2030 ($ million)
Chart on India - Year-over-year growth 2025-2030 (%)
Data Table on India - Year-over-year growth 2025-2030 (%)

14.3.5 Australia - Market size and forecast 2025-2030

Chart on Australia - Market size and forecast 2025-2030 ($ million)
Data Table on Australia - Market size and forecast 2025-2030 ($ million)
Chart on Australia - Year-over-year growth 2025-2030 (%)
Data Table on Australia - Year-over-year growth 2025-2030 (%)

14.3.6 Indonesia - Market size and forecast 2025-2030

Chart on Indonesia - Market size and forecast 2025-2030 ($ million)
Data Table on Indonesia - Market size and forecast 2025-2030 ($ million)
Chart on Indonesia - Year-over-year growth 2025-2030 (%)
Data Table on Indonesia - Year-over-year growth 2025-2030 (%)

14.4 North America - Market size and forecast 2025-2030

Chart on North America - Market size and forecast 2025-2030 ($ million)
Data Table on North America - Market size and forecast 2025-2030 ($ million)
Chart on North America - Year-over-year growth 2025-2030 (%)
Data Table on North America - Year-over-year growth 2025-2030 (%)
Chart on Regional Comparison - North America
Data Table on Regional Comparison - North America

14.4.1 US - Market size and forecast 2025-2030

Chart on US - Market size and forecast 2025-2030 ($ million)
Data Table on US - Market size and forecast 2025-2030 ($ million)
Chart on US - Year-over-year growth 2025-2030 (%)
Data Table on US - Year-over-year growth 2025-2030 (%)

14.4.2 Canada - Market size and forecast 2025-2030

Chart on Canada - Market size and forecast 2025-2030 ($ million)
Data Table on Canada - Market size and forecast 2025-2030 ($ million)
Chart on Canada - Year-over-year growth 2025-2030 (%)
Data Table on Canada - Year-over-year growth 2025-2030 (%)

14.4.3 Mexico - Market size and forecast 2025-2030

Chart on Mexico - Market size and forecast 2025-2030 ($ million)
Data Table on Mexico - Market size and forecast 2025-2030 ($ million)
Chart on Mexico - Year-over-year growth 2025-2030 (%)
Data Table on Mexico - Year-over-year growth 2025-2030 (%)

14.5 Europe - Market size and forecast 2025-2030

Chart on Europe - Market size and forecast 2025-2030 ($ million)
Data Table on Europe - Market size and forecast 2025-2030 ($ million)
Chart on Europe - Year-over-year growth 2025-2030 (%)
Data Table on Europe - Year-over-year growth 2025-2030 (%)
Chart on Regional Comparison - Europe
Data Table on Regional Comparison - Europe

14.5.1 Germany - Market size and forecast 2025-2030

Chart on Germany - Market size and forecast 2025-2030 ($ million)
Data Table on Germany - Market size and forecast 2025-2030 ($ million)
Chart on Germany - Year-over-year growth 2025-2030 (%)
Data Table on Germany - Year-over-year growth 2025-2030 (%)

14.5.2 France - Market size and forecast 2025-2030

Chart on France - Market size and forecast 2025-2030 ($ million)
Data Table on France - Market size and forecast 2025-2030 ($ million)
Chart on France - Year-over-year growth 2025-2030 (%)
Data Table on France - Year-over-year growth 2025-2030 (%)

14.5.3 UK - Market size and forecast 2025-2030

Chart on UK - Market size and forecast 2025-2030 ($ million)
Data Table on UK - Market size and forecast 2025-2030 ($ million)
Chart on UK - Year-over-year growth 2025-2030 (%)
Data Table on UK - Year-over-year growth 2025-2030 (%)

14.5.4 Italy - Market size and forecast 2025-2030

Chart on Italy - Market size and forecast 2025-2030 ($ million)
Data Table on Italy - Market size and forecast 2025-2030 ($ million)
Chart on Italy - Year-over-year growth 2025-2030 (%)
Data Table on Italy - Year-over-year growth 2025-2030 (%)

14.5.5 Spain - Market size and forecast 2025-2030

Chart on Spain - Market size and forecast 2025-2030 ($ million)
Data Table on Spain - Market size and forecast 2025-2030 ($ million)
Chart on Spain - Year-over-year growth 2025-2030 (%)
Data Table on Spain - Year-over-year growth 2025-2030 (%)

14.5.6 Russia - Market size and forecast 2025-2030

Chart on Russia - Market size and forecast 2025-2030 ($ million)
Data Table on Russia - Market size and forecast 2025-2030 ($ million)
Chart on Russia - Year-over-year growth 2025-2030 (%)
Data Table on Russia - Year-over-year growth 2025-2030 (%)

14.6 South America - Market size and forecast 2025-2030

Chart on South America - Market size and forecast 2025-2030 ($ million)
Data Table on South America - Market size and forecast 2025-2030 ($ million)
Chart on South America - Year-over-year growth 2025-2030 (%)
Data Table on South America - Year-over-year growth 2025-2030 (%)
Chart on Regional Comparison - South America
Data Table on Regional Comparison - South America

14.6.1 Brazil - Market size and forecast 2025-2030

Chart on Brazil - Market size and forecast 2025-2030 ($ million)
Data Table on Brazil - Market size and forecast 2025-2030 ($ million)
Chart on Brazil - Year-over-year growth 2025-2030 (%)
Data Table on Brazil - Year-over-year growth 2025-2030 (%)

14.6.2 Argentina - Market size and forecast 2025-2030

Chart on Argentina - Market size and forecast 2025-2030 ($ million)
Data Table on Argentina - Market size and forecast 2025-2030 ($ million)
Chart on Argentina - Year-over-year growth 2025-2030 (%)
Data Table on Argentina - Year-over-year growth 2025-2030 (%)

14.6.3 Chile - Market size and forecast 2025-2030

Chart on Chile - Market size and forecast 2025-2030 ($ million)
Data Table on Chile - Market size and forecast 2025-2030 ($ million)
Chart on Chile - Year-over-year growth 2025-2030 (%)
Data Table on Chile - Year-over-year growth 2025-2030 (%)

14.7 Middle East and Africa - Market size and forecast 2025-2030

Chart on Middle East and Africa - Market size and forecast 2025-2030 ($ million)
Data Table on Middle East and Africa - Market size and forecast 2025-2030 ($ million)
Chart on Middle East and Africa - Year-over-year growth 2025-2030 (%)
Data Table on Middle East and Africa - Year-over-year growth 2025-2030 (%)
Chart on Regional Comparison - Middle East and Africa
Data Table on Regional Comparison - Middle East and Africa

14.7.1 Saudi Arabia - Market size and forecast 2025-2030

Chart on Saudi Arabia - Market size and forecast 2025-2030 ($ million)
Data Table on Saudi Arabia - Market size and forecast 2025-2030 ($ million)
Chart on Saudi Arabia - Year-over-year growth 2025-2030 (%)
Data Table on Saudi Arabia - Year-over-year growth 2025-2030 (%)

14.7.2 UAE - Market size and forecast 2025-2030

Chart on UAE - Market size and forecast 2025-2030 ($ million)
Data Table on UAE - Market size and forecast 2025-2030 ($ million)
Chart on UAE - Year-over-year growth 2025-2030 (%)
Data Table on UAE - Year-over-year growth 2025-2030 (%)

14.7.3 South Africa - Market size and forecast 2025-2030

Chart on South Africa - Market size and forecast 2025-2030 ($ million)
Data Table on South Africa - Market size and forecast 2025-2030 ($ million)
Chart on South Africa - Year-over-year growth 2025-2030 (%)
Data Table on South Africa - Year-over-year growth 2025-2030 (%)

14.7.4 Egypt - Market size and forecast 2025-2030

Chart on Egypt - Market size and forecast 2025-2030 ($ million)
Data Table on Egypt - Market size and forecast 2025-2030 ($ million)
Chart on Egypt - Year-over-year growth 2025-2030 (%)
Data Table on Egypt - Year-over-year growth 2025-2030 (%)

14.7.5 Nigeria - Market size and forecast 2025-2030

Chart on Nigeria - Market size and forecast 2025-2030 ($ million)
Data Table on Nigeria - Market size and forecast 2025-2030 ($ million)
Chart on Nigeria - Year-over-year growth 2025-2030 (%)
Data Table on Nigeria - Year-over-year growth 2025-2030 (%)

14.8 Market opportunity by geography

Market opportunity by geography ($ million)
Data Tables on Market opportunity by geography ($ million)

15. Drivers, Challenges, and Opportunity

15.1 Market drivers

Evolution of skinification trend in global personal care
Rising demand for eco-conscious and sustainable formulations
Technological innovation and rise of hyper-personalized skincare

15.2 Market challenges

Increasing regulatory rigor and ingredient restrictions
Global supply chain instability and inflationary pressures
Intense competitive fragmentation and consumer brand switching

15.3 Impact of drivers and challenges

Impact of drivers and challenges in 2025 and 2030

15.4 Market opportunities

Emphasis on skin barrier integrity and microbiome protection
Transition toward circular packaging and ethical sourcing models
Digital transformation through AI and smart diagnostics

16. Competitive Landscape

16.1 Overview

16.2

Overview on criticality of inputs and factors of differentiation

16.3 Landscape disruption

Overview on factors of disruption

16.4 Industry risks

Impact of key risks on business

17. Competitive Analysis

17.1 Companies profiled

Companies covered

17.2 Company ranking index

17.3 Market positioning of companies

Matrix on companies position and classification

17.4 Amway Corp.

Amway Corp. - Overview
Amway Corp. - Product / Service
Amway Corp. - Key offerings
SWOT

17.5 Beiersdorf AG

Beiersdorf AG - Overview
Beiersdorf AG - Business segments
Beiersdorf AG - Key offerings
Beiersdorf AG - Segment focus
SWOT

17.6 Coty Inc.

Coty Inc. - Overview
Coty Inc. - Business segments
Coty Inc. - Key news
Coty Inc. - Key offerings
Coty Inc. - Segment focus
SWOT

17.7 Galderma Group AG

Galderma Group AG - Overview
Galderma Group AG - Business segments
Galderma Group AG - Key offerings
Galderma Group AG - Segment focus
SWOT

17.8 Groupe Clarins

Groupe Clarins - Overview
Groupe Clarins - Product / Service
Groupe Clarins - Key offerings
SWOT

17.9 Kao Corp.

Kao Corp. - Overview
Kao Corp. - Business segments
Kao Corp. - Key news
Kao Corp. - Key offerings
Kao Corp. - Segment focus
SWOT

17.10 Kenvue Inc.

Kenvue Inc. - Overview
Kenvue Inc. - Business segments
Kenvue Inc. - Key news
Kenvue Inc. - Key offerings
Kenvue Inc. - Segment focus
SWOT

17.11 LG Household and Health Care Ltd.

LG Household and Health Care Ltd. - Overview
LG Household and Health Care Ltd. - Business segments
LG Household and Health Care Ltd. - Key offerings
LG Household and Health Care Ltd. - Segment focus
SWOT

17.12 Loreal SA

Loreal SA - Overview
Loreal SA - Business segments
Loreal SA - Key offerings
Loreal SA - Segment focus
SWOT

17.13 Oriflame Cosmetics SA

Oriflame Cosmetics SA - Overview
Oriflame Cosmetics SA - Product / Service
Oriflame Cosmetics SA - Key offerings
SWOT

17.14 Procter and Gamble Co.

Procter and Gamble Co. - Overview
Procter and Gamble Co. - Business segments
Procter and Gamble Co. - Key news
Procter and Gamble Co. - Key offerings
Procter and Gamble Co. - Segment focus
SWOT

17.15 Revlon Inc.

Revlon Inc. - Overview
Revlon Inc. - Product / Service
Revlon Inc. - Key offerings
SWOT

17.16 Shiseido Co. Ltd.

Shiseido Co. Ltd. - Overview
Shiseido Co. Ltd. - Business segments
Shiseido Co. Ltd. - Key offerings
Shiseido Co. Ltd. - Segment focus
SWOT

17.17 The Estee Lauder Co.

The Estee Lauder Co. - Overview
The Estee Lauder Co. - Business segments
The Estee Lauder Co. - Key offerings
The Estee Lauder Co. - Segment focus
SWOT

17.18 Unilever PLC

Unilever PLC - Overview
Unilever PLC - Business segments
Unilever PLC - Key news
Unilever PLC - Key offerings
Unilever PLC - Segment focus
SWOT

18. Appendix

18.1 Scope of the report

Market definition
Objectives
Notes and caveats

18.2 Inclusions and exclusions checklist

Inclusions checklist
Exclusions checklist

18.3 Currency conversion rates for US$

18.4 Research methodology

18.5 Data procurement

Information sources

18.6 Data validation

18.7 Validation techniques employed for market sizing

18.8 Data synthesis

18.9 360 degree market analysis

18.10 List of abbreviations

Research Methodology

Technavio presents a detailed picture of the market by way of study, synthesis, and summation of data from multiple sources. The analysts have presented the various facets of the market with a particular focus on identifying the key industry influencers. The data thus presented is comprehensive, reliable, and the result of extensive research, both primary and secondary.

INFORMATION SOURCES

Primary sources

  • Manufacturers and suppliers
  • Channel partners
  • Industry experts
  • Strategic decision makers

Secondary sources

  • Industry journals and periodicals
  • Government data
  • Financial reports of key industry players
  • Historical data
  • Press releases

DATA ANALYSIS

Data Synthesis

  • Collation of data
  • Estimation of key figures
  • Analysis of derived insights

Data Validation

  • Triangulation with data models
  • Reference against proprietary databases
  • Corroboration with industry experts

REPORT WRITING

Qualitative

  • Market drivers
  • Market challenges
  • Market trends
  • Five forces analysis

Quantitative

  • Market size and forecast
  • Market segmentation
  • Geographical insights
  • Competitive landscape

Interested in this report?

Get your sample now to see our research methodology and insights!

Download Now

Frequently Asked Questions

Cleansing Lotion market growth will increase by USD 2709.7 million during 2026-2030.

The Cleansing Lotion market is expected to grow at a CAGR of 6.1% during 2026-2030.

Cleansing Lotion market is segmented by Distribution channel (Offline, Online) End-user (Household, Commercial) Product (Cream-based, Foam-based, Gel-based, Oil-based, Others) Application (Facial cleansing lotions, Body cleansing lotions, Eye makeup remover cleansing lotions, Lip cleansing lotions) Type (Normal skin, Oily skin, Dry skin, Sensitive skin, Combination skin)

Amway Corp., Beiersdorf AG, Caudalie International SE, Coty Inc., Galderma Group AG, Groupe Clarins, Kao Corp., Kenvue Inc., LG Household and Health Care Ltd., Loreal SA, Mary Kay Inc., Oriflame Cosmetics SA, Pierre Fabre SA, Procter and Gamble Co., Revlon Inc., Shiseido Co. Ltd., SISLEY, The Estee Lauder Co., Unilever PLC, Valmont Group are a few of the key vendors in the Cleansing Lotion market.

APAC will register the highest growth rate of 43.5% among the other regions. Therefore, the Cleansing Lotion market in APAC is expected to garner significant business opportunities for the vendors during the forecast period.

China, Japan, South Korea, India, Australia, Indonesia, US, Canada, Mexico, Germany, France, UK, Italy, Spain, Russia, Brazil, Argentina, Chile, Saudi Arabia, UAE, South Africa, Egypt, Nigeria

  • Evolution of skinification trend in global personal care is the driving factor this market.

The Cleansing Lotion market vendors should focus on grabbing business opportunities from the Distribution channel segment as it accounted for the largest market share in the base year.
RIA - Research AI Assistant
Ask RIA