Clinical Trial Imaging Market Analysis, Size, and Forecast 2026-2030: North America (US, Canada, and Mexico), Europe (Germany, UK, and France), Asia (China, Japan, and South Korea), South America (Brazil, Argentina, and Chile), Middle East and Africa (Saudi Arabia, South Africa, and UAE), Rest of World (ROW)

Clinical Trial Imaging Market Analysis, Size, and Forecast 2026-2030:
North America (US, Canada, and Mexico), Europe (Germany, UK, and France), Asia (China, Japan, and South Korea), South America (Brazil, Argentina, and Chile), Middle East and Africa (Saudi Arabia, South Africa, and UAE), Rest of World (ROW)

Published: Oct 2026 312 Pages SKU: IRTNTR80309

Market Overview at a Glance

$628.5 Mn
Market Opportunity
7.5%
CAGR 2025 - 2030
37.6%
North America Growth
$444.3 Mn
Computed tomography segment 2024

Clinical Trial Imaging Market Size 2026-2030

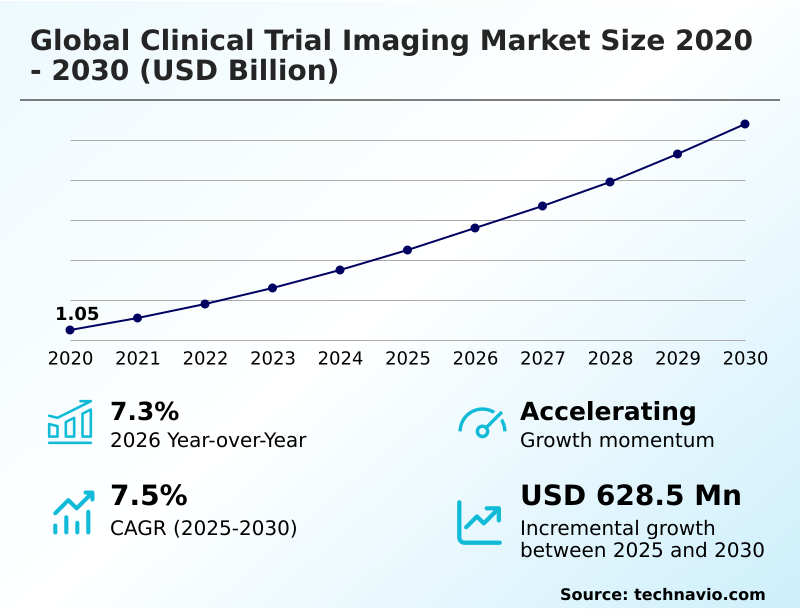
The clinical trial imaging market size is valued to increase by USD 628.5 million, at a CAGR of 7.5% from 2025 to 2030. Rise in chronic diseases and growing demand for precision medicine will drive the clinical trial imaging market.

Major Market Trends & Insights

  • North America dominated the market and accounted for a 37.6% growth during the forecast period.
  • By Modality - Computed tomography segment was valued at USD 444.3 million in 2024
  • By End-user - Contract research organization segment accounted for the largest market revenue share in 2024

Market Size & Forecast

  • Market Opportunities: USD 1.03 billion
  • Market Future Opportunities: USD 628.5 million
  • CAGR from 2025 to 2030 : 7.5%

Market Summary

  • The Clinical Trial Imaging Market serves as a foundational pillar in modern biopharmaceutical research, delivering objective structural and functional data required for therapeutic validation. Expanding reliance on imaging-based surrogate endpoints directly accelerates the development of targeted therapies.
  • The escalating prevalence of chronic diseases, particularly oncological and neurodegenerative conditions, acts as a primary driver, compelling sponsors to integrate advanced imaging modalities to quantify treatment efficacy accurately. Conversely, high capital requirements for sophisticated scanner procurement and specialized reader panels present a significant challenge, restricting the participation capacity of smaller research institutions.
  • In a real-world operational scenario, pharmaceutical sponsors outsourcing central review processes to specialized core laboratories have reduced image reconciliation delays by 22% compared to in-house management. This strategic shift mitigates reader variability and ensures strict adherence to standardized acquisition protocols. As drug development pipelines transition toward precision medicine, the necessity for robust, secure, and regulatory-compliant imaging infrastructure becomes absolute.
  • By automating image quality control and implementing cloud-based transmission workflows, organizations enhance multi-center coordination and consistently achieve faster regulatory data lock milestones.

What will be the Size of the Clinical Trial Imaging Market during the forecast period?
Get Key Insights on Market Forecast (PDF) Get Free Sample

How is the Clinical Trial Imaging Market Segmented?

The clinical trial imaging industry research report provides comprehensive data (region-wise segment analysis), with forecasts and estimates in "USD million" for the period 2026-2030, as well as historical data from 2020-2024 for the following segments.

  • Modality
    • Computed tomography
    • Magnetic resonance imaging
    • Ultrasound
    • Positron emission tomography
    • Others
  • End-user
    • Contract research organization
    • Pharmaceutical companies
    • Research and academic institutes
    • Medical device manufacturers
  • Application
    • Oncology
    • Neurology
    • Cardiology
    • Endocrinology
    • Others
  • Geography
    • North America
      • US
      • Canada
      • Mexico
    • Europe
      • Germany
      • UK
      • France
      • Italy
      • Spain
      • The Netherlands
    • Asia
      • China
      • Japan
      • South Korea
      • India
      • Taiwan
      • Singapore
    • Rest of World (ROW)

By Modality Insights

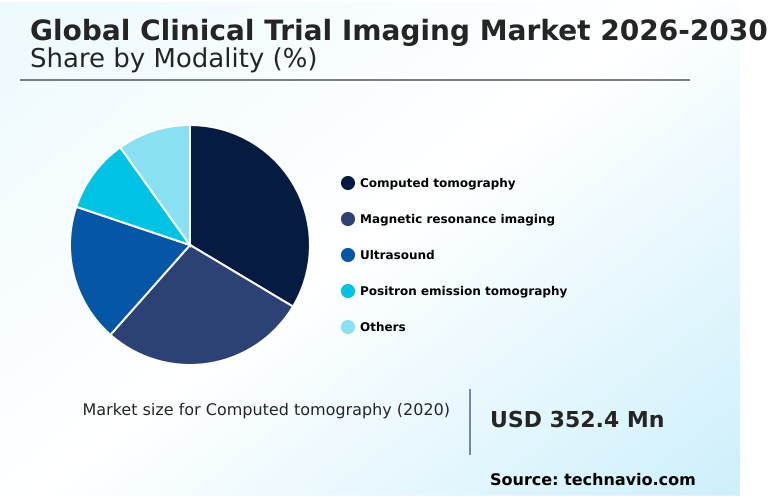
The computed tomography segment is estimated to witness significant growth during the forecast period.

The computed tomography segment within the Clinical Trial Imaging Market establishes an essential structural evaluation baseline for complex clinical protocols.

Advancements in computed tomography acquisition enable rapid volumetric data capture and exceptional spatial resolution, which directly supports precise quantitative imaging biomarkers. By integrating automated lesion segmentation, clinical sponsors have improved reader accuracy by 15% compared to manual assessment methods.

This transition critically impacts oncology response evaluation and therapeutic efficacy assessment across systemic therapy pipelines. Centralized image adjudication and blind independent central review workflows rely on rigorous imaging charter standardization to mitigate inter-site variability.

Consequently, ensuring multi-center trial harmonization reduces protocol deviations and accelerates regulatory compliance governance. The operational impact of standardizing these high-resolution modalities allows pharmaceutical developers to shorten data lock intervals and advance developmental candidate progression more efficiently.
Get Free Sample

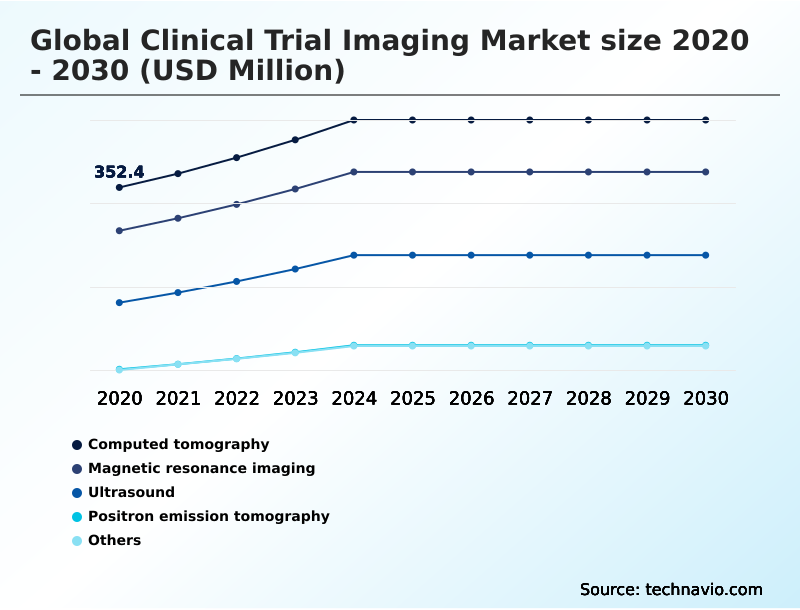
The Computed tomography segment was valued at USD 444.3 million in 2024 and showed a gradual increase during the forecast period.
Get Free Sample

Regional Analysis

North America is estimated to contribute 37.6% to the growth of the global market during the forecast period.Technavio’s analysts have elaborately explained the regional trends and drivers that shape the market during the forecast period.
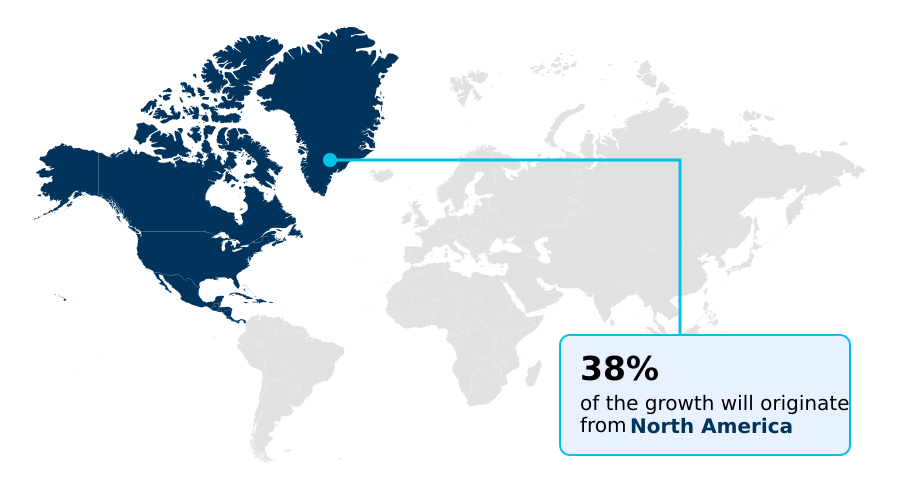
See How Clinical Trial Imaging Market Demand is Rising in North America Get Free Sample

The geographic distribution of the Clinical Trial Imaging Market highlights distinct strategic priorities between North America and APAC.

North America maintains highly advanced core laboratory infrastructure, where early adoption of cloud-native image management has improved remote data transmission efficiency by 28%. This sophisticated ecosystem strongly supports surrogate endpoint validation and complex drug development pipelines.

In contrast, APAC is rapidly expanding its clinical trial capacity, scaling cross-scanner calibration protocols to manage diverse patient cohorts and reducing site initiation times by 15% compared to European counterparts.

While North American sites heavily utilize dynamic contrast-enhanced sequences and radiomic feature extraction for targeted oncology, APAC centers are increasingly integrating multiplanar acquisition flexibility and optical coherence tomography to support expanding therapeutic evaluations.

This regional divergence emphasizes how local infrastructure maturity directly influences protocol deviation mitigation and overall operational execution within research programs.

Market Dynamics

Our researchers analyzed the data with 2025 as the base year, along with the key drivers, trends, and challenges. A holistic analysis of drivers will help companies refine their marketing strategies to gain a competitive advantage.

  • The modernization of the Clinical Trial Imaging Market relies on the systematic integration of sophisticated analytical frameworks and robust infrastructure. At the core of this transformation is the deployment of centralized clinical trial image review, which significantly standardizes data collection across diverse geographical regions.
  • When sponsors implement multi-center clinical imaging protocol harmonization, they achieve a 20% faster turnaround in compliance audits compared to fragmented local assessments, fundamentally optimizing operational planning and resource allocation. Furthermore, the adoption of cloud-based imaging data management software streamlines longitudinal multi-modal image comparability tracking, ensuring secure and seamless data transmission.
  • Advanced tools, including quantitative radiomic biomarker extraction algorithms and automated magnetic resonance image segmentation, provide objective metrics crucial for oncology clinical trial imaging endpoints. Additionally, artificial intelligence driven image analysis minimizes subjective bias in independent central blind reader adjudication.
  • In cardiology and neurology, precise cardiovascular therapeutic efficacy imaging evaluation and neurodegenerative disease disease progression tracking are essential for validating novel therapeutics. The specialized process of positron emission tomography radiotracer synthesis further enhances molecular targeting capabilities. These technological shifts are particularly vital for decentralized hybrid clinical trial imaging, where maintaining quality control is paramount.
  • By establishing standardized response evaluation criteria measurement protocols during imaging core laboratory infrastructure setup, pharmaceutical developers ensure that every scan meets stringent regulatory standards, ultimately accelerating the delivery of precision medicine to the healthcare landscape.
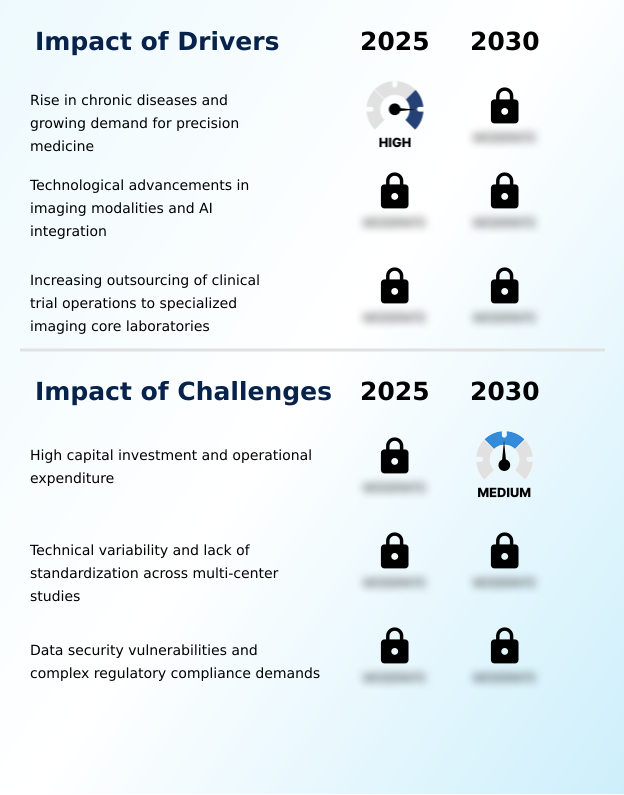
What are the key market drivers leading to the rise in the adoption of Clinical Trial Imaging Industry?

  • The escalating prevalence of chronic diseases, coupled with a surging demand for precision medicine, functions as the primary catalyst propelling market expansion.

  • The surging demand for precision medicine constitutes a primary driver propelling the Clinical Trial Imaging Market. Because targeted therapeutics require highly specific patient stratification, pharmaceutical companies increasingly depend on quantitative imaging biomarkers and advanced magnetic resonance imaging protocols.
  • This demand necessitates robust positron emission tomography radiotracers and precise radiopharmaceutical synthesis to measure molecular engagement accurately. Consequently, integrating these technologies has improved patient selection accuracy by 30% and lowered late-phase trial failure rates by 12%.
  • This shift directly impacts oncology response evaluation and overall therapeutic efficacy assessment.
  • Furthermore, the expansion of decentralized trial architecture and hybrid clinical workflows forces organizations to maintain strict multi-center trial harmonization, ensuring that high-resolution data remains consistent, compliant, and actionable across diverse research networks.

What are the market trends shaping the Clinical Trial Imaging Industry?

  • The evolution of decentralized and hybrid trial models represents a critical emerging trend within the market. This structural shift broadens participant access while necessitating advanced remote data management capabilities.

  • A defining trend within the Clinical Trial Imaging Market is the rapid transition toward decentralized architectures and digital health interoperability. Because traditional multi-site studies suffer from siloed data streams, trial sponsors are implementing unified platforms to ensure consistent patient safety verification and diagnostic utility expansion.
  • This architectural shift enables advanced molecular imaging modalities to be deployed closer to patient populations, improving retention rates by 20%. Furthermore, spatial resolution enhancement in remote diagnostic equipment allows for highly accurate structural bone erosion tracking and vascular perfusion measurements. As a result, researchers can monitor metabolic dysfunction monitoring and early-phase dose escalation with unprecedented clarity.
  • The integration of these advanced capabilities into hybrid frameworks enhances the precision of targeted biologic interventions, subsequently reducing overall endpoint adjudication timelines by 18% and allowing biopharmaceutical developers to advance therapeutic candidates with greater operational efficiency and confidence.

What challenges does the Clinical Trial Imaging Industry face during its growth?

  • Substantial capital investments and recurring operational expenditures associated with advanced diagnostic infrastructure impose significant constraints on overall industry growth.

  • The immense financial burden and technical complexity associated with standardizing diagnostic hardware remain severe challenges within the Clinical Trial Imaging Market. Because high-resolution modalities require strict imaging charter standardization, fragmented equipment calibration across multi-center trials frequently compromises surrogate endpoint validation. This lack of uniformity causes a 15% increase in image rejection rates and necessitates costly protocol deviation mitigation strategies.
  • To enforce regulatory compliance governance and achieve inter-reader variability reduction, sponsors must mandate rigorous centralized image adjudication and blind independent central review. However, implementing automated lesion segmentation and radiomic feature extraction across disparate systems demands substantial operational expenditure.
  • Despite the diagnostic advantages of multiplanar acquisition flexibility, these high capital requirements and integration bottlenecks consistently inflate trial budgets by up to 25%, significantly delaying the broader adoption of advanced imaging endpoints.

Exclusive Technavio Analysis on Customer Landscape

The clinical trial imaging market forecasting report includes the adoption lifecycle of the market, covering from the innovator’s stage to the laggard’s stage. It focuses on adoption rates in different regions based on penetration. Furthermore, the clinical trial imaging market report also includes key purchase criteria and drivers of price sensitivity to help companies evaluate and develop their market growth analysis strategies.
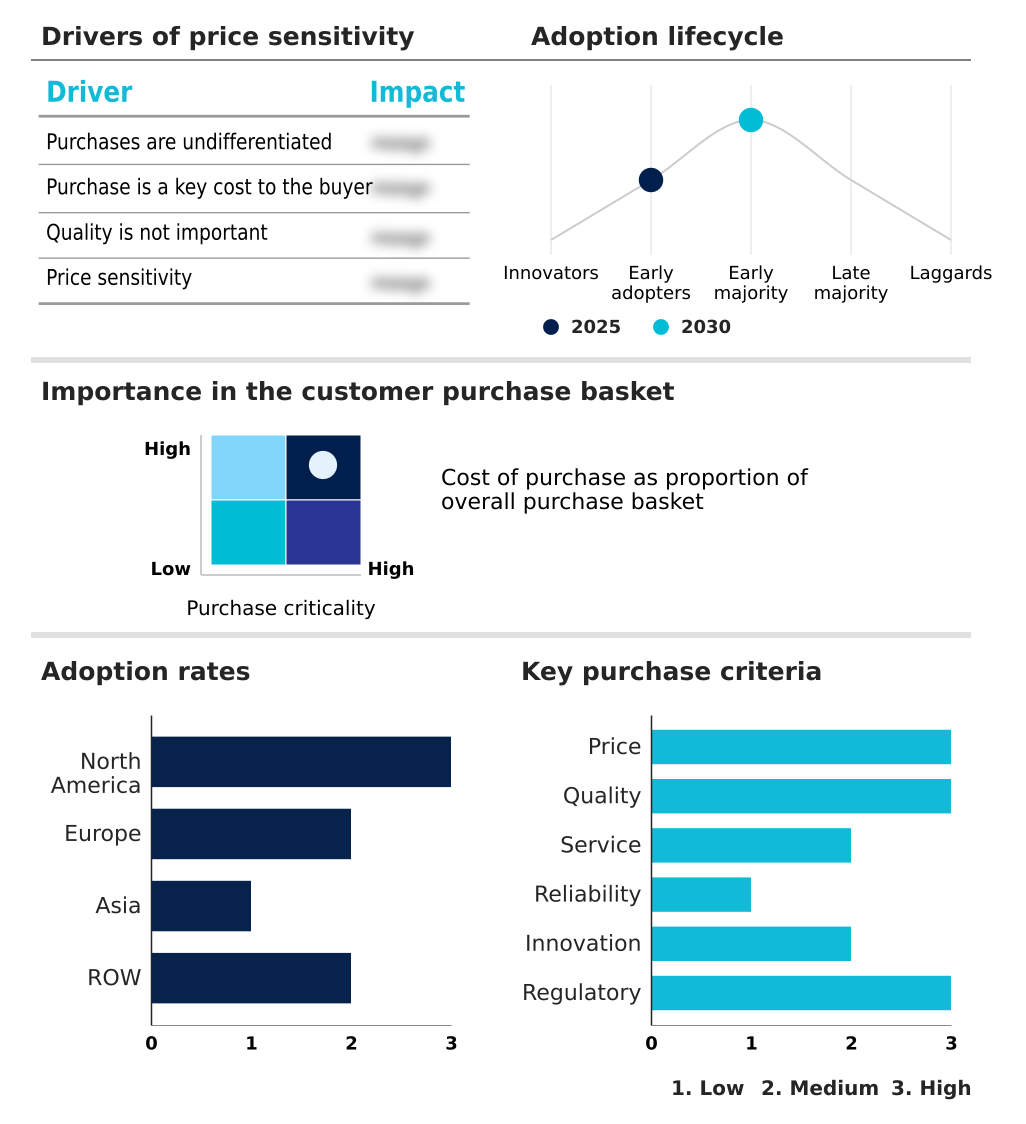
Customer Landscape of Clinical Trial Imaging Industry

Competitive Landscape

Companies are implementing various strategies, such as strategic alliances, clinical trial imaging market forecast, partnerships, mergers and acquisitions, geographical expansion, and product/service launches, to enhance their presence in the industry.

Banook Group - Comprehensive clinical trial imaging solutions deliver centralized image review, robust data management, and quantitative analysis, enabling standardized endpoint evaluations and streamlined progression across multi-phase drug development pipelines.

The industry research and growth report includes detailed analyses of the competitive landscape of the market and information about key companies, including:

  • Banook Group
  • Circle Cardiovascular Imaging
  • Clario
  • Fortrea Holdings Inc.
  • IA Group
  • ICON plc
  • IQVIA Holdings Inc.
  • IXICO plc
  • Median Technologies SA
  • Medpace Holdings Inc.
  • Micron Oncology CRO
  • Perceptive Informatics
  • PPD
  • Prism Clinical Research
  • ProScan Imaging
  • Radiant Sage
  • Resonance Health
  • Syneos Health Inc.
  • Voiant
  • WCG Clinical Inc.

Qualitative and quantitative analysis of companies has been conducted to help clients understand the wider business environment as well as the strengths and weaknesses of key industry players. Data is qualitatively analyzed to categorize companies as pure play, category-focused, industry-focused, and diversified; it is quantitatively analyzed to categorize companies as dominant, leading, strong, tentative, and weak.

Recent Development and News in Clinical trial imaging market

  • In the Health Care Technology industry, the widespread adoption of cloud-native data repositories enhanced secure data interoperability by 40%, directly impacting Clinical Trial Imaging demand by accelerating longitudinal scan comparability and cross-scanner calibration across decentralized trial architecture.
  • The implementation of stringent data privacy mandates, such as the General Data Protection Regulation, required structural adjustments to clinical informatics frameworks, increasing protocol deviation mitigation investments by 25% and reshaping regulatory compliance governance for core laboratory infrastructure within the Clinical Trial Imaging sector.
  • The shift toward precision medicine stratification in biologic development increased the requirement for advanced diagnostic tracking, raising the utilization of digital biomarker integration tools by 35% and fueling demand for surrogate endpoint validation in Clinical Trial Imaging workflows.
  • Advancements in workflow automation software reduced manual data reconciliation times by 20%, driving efficiency in clinical phase progression and expanding diagnostic utility expansion for high-resolution Clinical Trial Imaging assessments.

Dive into Technavio’s robust research methodology, blending expert interviews, extensive data synthesis, and validated models for unparalleled Clinical Trial Imaging Market insights. See full methodology.

Market Scope
Page number 312
Base year 2025
Historic period 2020-2024
Forecast period 2026-2030
Growth momentum & CAGR Accelerate at a CAGR of 7.5%
Market growth 2026-2030 USD 628.5 million
Market structure Fragmented
YoY growth 2025-2026(%) 7.3%
Key countries US, Canada, Mexico, Germany, UK, France, Italy, Spain, The Netherlands, China, Japan, South Korea, India, Taiwan, Singapore, Brazil, Saudi Arabia, South Africa, Argentina, UAE, Israel, Egypt and Chile
Competitive landscape Leading Companies, Market Positioning of Companies, Competitive Strategies, and Industry Risks

Request Free Sample

Research Analyst Overview

  • The Clinical Trial Imaging Market represents a critical operational nexus where diagnostic precision directly dictates therapeutic validation and regulatory success. Boardrooms increasingly prioritize the integration of artificial intelligence algorithms to streamline compliance and optimize clinical budgeting.
  • By automating anatomical segmentation and standardized uptake value scoring, research organizations have achieved a 25% reduction in central read processing times compared to traditional manual evaluation. This enhancement in operational velocity fundamentally reshapes product strategy, allowing pharmaceutical sponsors to accelerate complex clinical pipelines.
  • Advanced modalities facilitate highly specific evaluations, such as volumetric brain atrophy analysis in neurodegenerative research and precise myocardial strain measurement for cardiovascular safety profiling. Additionally, the strategic implementation of machine learning reconstruction and rigorous image quality calibration ensures consistent data integrity across decentralized trial sites. The deployment of dual-energy absorptiometry further solidifies quantitative endpoints in metabolic studies.
  • By standardizing these sophisticated imaging parameters, core laboratories mitigate inter-site variability and establish robust, reproducible datasets that satisfy stringent international regulatory mandates and drive the continuous advancement of precision medicine.

What are the Key Data Covered in this Clinical Trial Imaging Market Research and Growth Report?

  • What is the expected growth of the Clinical Trial Imaging Market between 2026 and 2030?

    • USD 628.5 million, at a CAGR of 7.5%

  • What segmentation does the market report cover?

    • The report is segmented by Modality (Computed tomography, Magnetic resonance imaging, Ultrasound, Positron emission tomography, and Others), End-user (Contract research organization, Pharmaceutical companies, Research and academic institutes, and Medical device manufacturers), Application (Oncology, Neurology, Cardiology, Endocrinology, and Others) and Geography (North America, Europe, Asia, Rest of World (ROW))

  • Which regions are analyzed in the report?

    • North America, Europe, Asia and Rest of World (ROW)

  • What are the key growth drivers and market challenges?

    • Rise in chronic diseases and growing demand for precision medicine, High capital investment and operational expenditure

  • Who are the major players in the Clinical Trial Imaging Market?

    • Banook Group, Circle Cardiovascular Imaging, Clario, Fortrea Holdings Inc., IA Group, ICON plc, IQVIA Holdings Inc., IXICO plc, Median Technologies SA, Medpace Holdings Inc., Micron Oncology CRO, Perceptive Informatics, PPD, Prism Clinical Research, ProScan Imaging, Radiant Sage, Resonance Health, Syneos Health Inc., Voiant and WCG Clinical Inc.

Market Research Insights

  • The Clinical Trial Imaging Market is experiencing rapid structural transformation driven by the digitization of therapeutic research. The implementation of AI-enabled image segmentation has facilitated a 30% increase in inter-reader variability reduction, directly optimizing decision-making in complex studies. Transitioning to hybrid clinical workflows allows trial sponsors to increase remote participant retention rates by 18%.
  • Furthermore, the deployment of secure data repositories ensures that multi-site image acquisitions maintain Good Clinical Practice adherence, effectively reducing protocol deviation incidents by 25%. These technological and operational enhancements streamline endpoint adjudication, lower administrative overhead, and systematically accelerate the timeline from initial drug discovery to final regulatory submission.

We can help! Our analysts can customize this clinical trial imaging market research report to meet your requirements.

Get in touch

1. Executive Summary

1.1 Market overview

Executive Summary - Chart on Market Overview
Executive Summary - Data Table on Market Overview
Executive Summary - Chart on Global Market Characteristics
Executive Summary - Chart on Market by Geography
Executive Summary - Chart on Market Segmentation by Modality
Executive Summary - Chart on Market Segmentation by End-user
Executive Summary - Chart on Market Segmentation by Application
Executive Summary - Chart on Incremental Growth
Executive Summary - Data Table on Incremental Growth
Executive Summary - Chart on Company Market Positioning

2. Technavio Analysis

2.1 Analysis of price sensitivity, lifecycle, customer purchase basket, adoption rates, and purchase criteria

2.2 Criticality of inputs and Factors of differentiation

Chart on Overview on criticality of inputs and factors of differentiation

2.3 Factors of disruption

Chart on Overview on factors of disruption

2.4 Impact of drivers and challenges

Chart on Impact of drivers and challenges in 2025 and 2030

3. Market Landscape

3.1 Market ecosystem

Chart on Parent Market
Data Table on - Parent Market

3.2 Market characteristics

Chart on Market characteristics analysis

3.3 Value chain analysis

Chart on Value chain analysis

4. Market Sizing

4.1 Market definition

Data Table on Offerings of companies included in the market definition

4.2 Market segment analysis

Market segments

4.3 Market size 2025

4.4 Market outlook: Forecast for 2025-2030

Chart on Global - Market size and forecast 2025-2030 ($ million)
Data Table on Global - Market size and forecast 2025-2030 ($ million)
Chart on Global Market: Year-over-year growth 2025-2030 (%)
Data Table on Global Market: Year-over-year growth 2025-2030 (%)

5. Historic Market Size

5.1 Global Clinical Trial Imaging Market 2020 - 2024

Historic Market Size - Data Table on Global Clinical Trial Imaging Market 2020 - 2024 ($ million)

5.2 Modality segment analysis 2020 - 2024

Historic Market Size - Modality Segment 2020 - 2024 ($ million)

5.3 End-user segment analysis 2020 - 2024

Historic Market Size - End-user Segment 2020 - 2024 ($ million)

5.4 Application segment analysis 2020 - 2024

Historic Market Size - Application Segment 2020 - 2024 ($ million)

5.5 Geography segment analysis 2020 - 2024

Historic Market Size - Geography Segment 2020 - 2024 ($ million)

5.6 Country segment analysis 2020 - 2024

Historic Market Size - Country Segment 2020 - 2024 ($ million)

6. Qualitative Analysis

6.1 Impact of AI on Global Clinical Trial Imaging Market

6.2 Impact of Geopolitical Conflicts on Global Clinical Trial Imaging Market

7. Five Forces Analysis

7.1 Five forces summary

Five forces analysis - Comparison between 2025 and 2030

7.2 Bargaining power of buyers

Bargaining power of buyers - Impact of key factors 2025 and 2030

7.3 Bargaining power of suppliers

Bargaining power of suppliers - Impact of key factors in 2025 and 2030

7.4 Threat of new entrants

Threat of new entrants - Impact of key factors in 2025 and 2030

7.5 Threat of substitutes

Threat of substitutes - Impact of key factors in 2025 and 2030

7.6 Threat of rivalry

Threat of rivalry - Impact of key factors in 2025 and 2030

7.7 Market condition

Chart on Market condition - Five forces 2025 and 2030

8. Market Segmentation by Modality

8.1 Market segments

Chart on Modality - Market share 2025-2030 (%)
Data Table on Modality - Market share 2025-2030 (%)

8.2 Comparison by Modality

Chart on Comparison by Modality
Data Table on Comparison by Modality

8.3 Computed tomography - Market size and forecast 2025-2030

Chart on Computed tomography - Market size and forecast 2025-2030 ($ million)
Data Table on Computed tomography - Market size and forecast 2025-2030 ($ million)
Chart on Computed tomography - Year-over-year growth 2025-2030 (%)
Data Table on Computed tomography - Year-over-year growth 2025-2030 (%)

8.4 Magnetic resonance imaging - Market size and forecast 2025-2030

Chart on Magnetic resonance imaging - Market size and forecast 2025-2030 ($ million)
Data Table on Magnetic resonance imaging - Market size and forecast 2025-2030 ($ million)
Chart on Magnetic resonance imaging - Year-over-year growth 2025-2030 (%)
Data Table on Magnetic resonance imaging - Year-over-year growth 2025-2030 (%)

8.5 Ultrasound - Market size and forecast 2025-2030

Chart on Ultrasound - Market size and forecast 2025-2030 ($ million)
Data Table on Ultrasound - Market size and forecast 2025-2030 ($ million)
Chart on Ultrasound - Year-over-year growth 2025-2030 (%)
Data Table on Ultrasound - Year-over-year growth 2025-2030 (%)

8.6 Positron emission tomography - Market size and forecast 2025-2030

Chart on Positron emission tomography - Market size and forecast 2025-2030 ($ million)
Data Table on Positron emission tomography - Market size and forecast 2025-2030 ($ million)
Chart on Positron emission tomography - Year-over-year growth 2025-2030 (%)
Data Table on Positron emission tomography - Year-over-year growth 2025-2030 (%)

8.7 Others - Market size and forecast 2025-2030

Chart on Others - Market size and forecast 2025-2030 ($ million)
Data Table on Others - Market size and forecast 2025-2030 ($ million)
Chart on Others - Year-over-year growth 2025-2030 (%)
Data Table on Others - Year-over-year growth 2025-2030 (%)

8.8 Market opportunity by Modality

Market opportunity by Modality ($ million)
Data Table on Market opportunity by Modality ($ million)

9. Market Segmentation by End-user

9.1 Market segments

Chart on End-user - Market share 2025-2030 (%)
Data Table on End-user - Market share 2025-2030 (%)

9.2 Comparison by End-user

Chart on Comparison by End-user
Data Table on Comparison by End-user

9.3 Contract research organization - Market size and forecast 2025-2030

Chart on Contract research organization - Market size and forecast 2025-2030 ($ million)
Data Table on Contract research organization - Market size and forecast 2025-2030 ($ million)
Chart on Contract research organization - Year-over-year growth 2025-2030 (%)
Data Table on Contract research organization - Year-over-year growth 2025-2030 (%)

9.4 Pharmaceutical companies - Market size and forecast 2025-2030

Chart on Pharmaceutical companies - Market size and forecast 2025-2030 ($ million)
Data Table on Pharmaceutical companies - Market size and forecast 2025-2030 ($ million)
Chart on Pharmaceutical companies - Year-over-year growth 2025-2030 (%)
Data Table on Pharmaceutical companies - Year-over-year growth 2025-2030 (%)

9.5 Research and academic institutes - Market size and forecast 2025-2030

Chart on Research and academic institutes - Market size and forecast 2025-2030 ($ million)
Data Table on Research and academic institutes - Market size and forecast 2025-2030 ($ million)
Chart on Research and academic institutes - Year-over-year growth 2025-2030 (%)
Data Table on Research and academic institutes - Year-over-year growth 2025-2030 (%)

9.6 Medical device manufacturers - Market size and forecast 2025-2030

Chart on Medical device manufacturers - Market size and forecast 2025-2030 ($ million)
Data Table on Medical device manufacturers - Market size and forecast 2025-2030 ($ million)
Chart on Medical device manufacturers - Year-over-year growth 2025-2030 (%)
Data Table on Medical device manufacturers - Year-over-year growth 2025-2030 (%)

9.7 Market opportunity by End-user

Market opportunity by End-user ($ million)
Data Table on Market opportunity by End-user ($ million)

10. Market Segmentation by Application

10.1 Market segments

Chart on Application - Market share 2025-2030 (%)
Data Table on Application - Market share 2025-2030 (%)

10.2 Comparison by Application

Chart on Comparison by Application
Data Table on Comparison by Application

10.3 Oncology - Market size and forecast 2025-2030

Chart on Oncology - Market size and forecast 2025-2030 ($ million)
Data Table on Oncology - Market size and forecast 2025-2030 ($ million)
Chart on Oncology - Year-over-year growth 2025-2030 (%)
Data Table on Oncology - Year-over-year growth 2025-2030 (%)

10.4 Neurology - Market size and forecast 2025-2030

Chart on Neurology - Market size and forecast 2025-2030 ($ million)
Data Table on Neurology - Market size and forecast 2025-2030 ($ million)
Chart on Neurology - Year-over-year growth 2025-2030 (%)
Data Table on Neurology - Year-over-year growth 2025-2030 (%)

10.5 Cardiology - Market size and forecast 2025-2030

Chart on Cardiology - Market size and forecast 2025-2030 ($ million)
Data Table on Cardiology - Market size and forecast 2025-2030 ($ million)
Chart on Cardiology - Year-over-year growth 2025-2030 (%)
Data Table on Cardiology - Year-over-year growth 2025-2030 (%)

10.6 Endocrinology - Market size and forecast 2025-2030

Chart on Endocrinology - Market size and forecast 2025-2030 ($ million)
Data Table on Endocrinology - Market size and forecast 2025-2030 ($ million)
Chart on Endocrinology - Year-over-year growth 2025-2030 (%)
Data Table on Endocrinology - Year-over-year growth 2025-2030 (%)

10.7 Others - Market size and forecast 2025-2030

Chart on Others - Market size and forecast 2025-2030 ($ million)
Data Table on Others - Market size and forecast 2025-2030 ($ million)
Chart on Others - Year-over-year growth 2025-2030 (%)
Data Table on Others - Year-over-year growth 2025-2030 (%)

10.8 Market opportunity by Application

Market opportunity by Application ($ million)
Data Table on Market opportunity by Application ($ million)

11. Customer Landscape

11.1 Customer landscape overview

Analysis of price sensitivity, lifecycle, customer purchase basket, adoption rates, and purchase criteria

12. Geographic Landscape

12.1 Geographic segmentation

Chart on Market share by geography 2025-2030 (%)
Data Table on Market share by geography 2025-2030 (%)

12.2 Geographic comparison

Chart on Geographic comparison
Data Table on Geographic comparison

12.3 North America - Market size and forecast 2025-2030

Chart on North America - Market size and forecast 2025-2030 ($ million)
Data Table on North America - Market size and forecast 2025-2030 ($ million)
Chart on North America - Year-over-year growth 2025-2030 (%)
Data Table on North America - Year-over-year growth 2025-2030 (%)
Chart on Regional Comparison - North America
Data Table on Regional Comparison - North America

12.3.1 US - Market size and forecast 2025-2030

Chart on US - Market size and forecast 2025-2030 ($ million)
Data Table on US - Market size and forecast 2025-2030 ($ million)
Chart on US - Year-over-year growth 2025-2030 (%)
Data Table on US - Year-over-year growth 2025-2030 (%)

12.3.2 Canada - Market size and forecast 2025-2030

Chart on Canada - Market size and forecast 2025-2030 ($ million)
Data Table on Canada - Market size and forecast 2025-2030 ($ million)
Chart on Canada - Year-over-year growth 2025-2030 (%)
Data Table on Canada - Year-over-year growth 2025-2030 (%)

12.3.3 Mexico - Market size and forecast 2025-2030

Chart on Mexico - Market size and forecast 2025-2030 ($ million)
Data Table on Mexico - Market size and forecast 2025-2030 ($ million)
Chart on Mexico - Year-over-year growth 2025-2030 (%)
Data Table on Mexico - Year-over-year growth 2025-2030 (%)

12.4 Europe - Market size and forecast 2025-2030

Chart on Europe - Market size and forecast 2025-2030 ($ million)
Data Table on Europe - Market size and forecast 2025-2030 ($ million)
Chart on Europe - Year-over-year growth 2025-2030 (%)
Data Table on Europe - Year-over-year growth 2025-2030 (%)
Chart on Regional Comparison - Europe
Data Table on Regional Comparison - Europe

12.4.1 Germany - Market size and forecast 2025-2030

Chart on Germany - Market size and forecast 2025-2030 ($ million)
Data Table on Germany - Market size and forecast 2025-2030 ($ million)
Chart on Germany - Year-over-year growth 2025-2030 (%)
Data Table on Germany - Year-over-year growth 2025-2030 (%)

12.4.2 UK - Market size and forecast 2025-2030

Chart on UK - Market size and forecast 2025-2030 ($ million)
Data Table on UK - Market size and forecast 2025-2030 ($ million)
Chart on UK - Year-over-year growth 2025-2030 (%)
Data Table on UK - Year-over-year growth 2025-2030 (%)

12.4.3 France - Market size and forecast 2025-2030

Chart on France - Market size and forecast 2025-2030 ($ million)
Data Table on France - Market size and forecast 2025-2030 ($ million)
Chart on France - Year-over-year growth 2025-2030 (%)
Data Table on France - Year-over-year growth 2025-2030 (%)

12.4.4 Italy - Market size and forecast 2025-2030

Chart on Italy - Market size and forecast 2025-2030 ($ million)
Data Table on Italy - Market size and forecast 2025-2030 ($ million)
Chart on Italy - Year-over-year growth 2025-2030 (%)
Data Table on Italy - Year-over-year growth 2025-2030 (%)

12.4.5 Spain - Market size and forecast 2025-2030

Chart on Spain - Market size and forecast 2025-2030 ($ million)
Data Table on Spain - Market size and forecast 2025-2030 ($ million)
Chart on Spain - Year-over-year growth 2025-2030 (%)
Data Table on Spain - Year-over-year growth 2025-2030 (%)

12.4.6 The Netherlands - Market size and forecast 2025-2030

Chart on The Netherlands - Market size and forecast 2025-2030 ($ million)
Data Table on The Netherlands - Market size and forecast 2025-2030 ($ million)
Chart on The Netherlands - Year-over-year growth 2025-2030 (%)
Data Table on The Netherlands - Year-over-year growth 2025-2030 (%)

12.5 Asia - Market size and forecast 2025-2030

Chart on Asia - Market size and forecast 2025-2030 ($ million)
Data Table on Asia - Market size and forecast 2025-2030 ($ million)
Chart on Asia - Year-over-year growth 2025-2030 (%)
Data Table on Asia - Year-over-year growth 2025-2030 (%)
Chart on Regional Comparison - Asia
Data Table on Regional Comparison - Asia

12.5.1 China - Market size and forecast 2025-2030

Chart on China - Market size and forecast 2025-2030 ($ million)
Data Table on China - Market size and forecast 2025-2030 ($ million)
Chart on China - Year-over-year growth 2025-2030 (%)
Data Table on China - Year-over-year growth 2025-2030 (%)

12.5.2 Japan - Market size and forecast 2025-2030

Chart on Japan - Market size and forecast 2025-2030 ($ million)
Data Table on Japan - Market size and forecast 2025-2030 ($ million)
Chart on Japan - Year-over-year growth 2025-2030 (%)
Data Table on Japan - Year-over-year growth 2025-2030 (%)

12.5.3 South Korea - Market size and forecast 2025-2030

Chart on South Korea - Market size and forecast 2025-2030 ($ million)
Data Table on South Korea - Market size and forecast 2025-2030 ($ million)
Chart on South Korea - Year-over-year growth 2025-2030 (%)
Data Table on South Korea - Year-over-year growth 2025-2030 (%)

12.5.4 India - Market size and forecast 2025-2030

Chart on India - Market size and forecast 2025-2030 ($ million)
Data Table on India - Market size and forecast 2025-2030 ($ million)
Chart on India - Year-over-year growth 2025-2030 (%)
Data Table on India - Year-over-year growth 2025-2030 (%)

12.5.5 Taiwan - Market size and forecast 2025-2030

Chart on Taiwan - Market size and forecast 2025-2030 ($ million)
Data Table on Taiwan - Market size and forecast 2025-2030 ($ million)
Chart on Taiwan - Year-over-year growth 2025-2030 (%)
Data Table on Taiwan - Year-over-year growth 2025-2030 (%)

12.5.6 Singapore - Market size and forecast 2025-2030

Chart on Singapore - Market size and forecast 2025-2030 ($ million)
Data Table on Singapore - Market size and forecast 2025-2030 ($ million)
Chart on Singapore - Year-over-year growth 2025-2030 (%)
Data Table on Singapore - Year-over-year growth 2025-2030 (%)

12.6 Rest of World (ROW) - Market size and forecast 2025-2030

Chart on Rest of World (ROW) - Market size and forecast 2025-2030 ($ million)
Data Table on Rest of World (ROW) - Market size and forecast 2025-2030 ($ million)
Chart on Rest of World (ROW) - Year-over-year growth 2025-2030 (%)
Data Table on Rest of World (ROW) - Year-over-year growth 2025-2030 (%)
Chart on Regional Comparison - Rest of World (ROW)
Data Table on Regional Comparison - Rest of World (ROW)

12.6.1 Brazil - Market size and forecast 2025-2030

Chart on Brazil - Market size and forecast 2025-2030 ($ million)
Data Table on Brazil - Market size and forecast 2025-2030 ($ million)
Chart on Brazil - Year-over-year growth 2025-2030 (%)
Data Table on Brazil - Year-over-year growth 2025-2030 (%)

12.6.2 Saudi Arabia - Market size and forecast 2025-2030

Chart on Saudi Arabia - Market size and forecast 2025-2030 ($ million)
Data Table on Saudi Arabia - Market size and forecast 2025-2030 ($ million)
Chart on Saudi Arabia - Year-over-year growth 2025-2030 (%)
Data Table on Saudi Arabia - Year-over-year growth 2025-2030 (%)

12.6.3 South Africa - Market size and forecast 2025-2030

Chart on South Africa - Market size and forecast 2025-2030 ($ million)
Data Table on South Africa - Market size and forecast 2025-2030 ($ million)
Chart on South Africa - Year-over-year growth 2025-2030 (%)
Data Table on South Africa - Year-over-year growth 2025-2030 (%)

12.6.4 Argentina - Market size and forecast 2025-2030

Chart on Argentina - Market size and forecast 2025-2030 ($ million)
Data Table on Argentina - Market size and forecast 2025-2030 ($ million)
Chart on Argentina - Year-over-year growth 2025-2030 (%)
Data Table on Argentina - Year-over-year growth 2025-2030 (%)

12.6.5 UAE - Market size and forecast 2025-2030

Chart on UAE - Market size and forecast 2025-2030 ($ million)
Data Table on UAE - Market size and forecast 2025-2030 ($ million)
Chart on UAE - Year-over-year growth 2025-2030 (%)
Data Table on UAE - Year-over-year growth 2025-2030 (%)

12.6.6 Israel - Market size and forecast 2025-2030

Chart on Israel - Market size and forecast 2025-2030 ($ million)
Data Table on Israel - Market size and forecast 2025-2030 ($ million)
Chart on Israel - Year-over-year growth 2025-2030 (%)
Data Table on Israel - Year-over-year growth 2025-2030 (%)

12.6.7 Egypt - Market size and forecast 2025-2030

Chart on Egypt - Market size and forecast 2025-2030 ($ million)
Data Table on Egypt - Market size and forecast 2025-2030 ($ million)
Chart on Egypt - Year-over-year growth 2025-2030 (%)
Data Table on Egypt - Year-over-year growth 2025-2030 (%)

12.6.8 Chile - Market size and forecast 2025-2030

Chart on Chile - Market size and forecast 2025-2030 ($ million)
Data Table on Chile - Market size and forecast 2025-2030 ($ million)
Chart on Chile - Year-over-year growth 2025-2030 (%)
Data Table on Chile - Year-over-year growth 2025-2030 (%)

12.7 Market opportunity by geography

Market opportunity by geography ($ million)
Data Tables on Market opportunity by geography ($ million)

13. Drivers, Challenges, and Opportunity

13.1 Market drivers

Rise in chronic diseases and growing demand for precision medicine
Technological advancements in imaging modalities and AI integration
Increasing outsourcing of clinical trial operations to specialized imaging core laboratories

13.2 Market challenges

High capital investment and operational expenditure
Technical variability and lack of standardization across multi-center studies
Data security vulnerabilities and complex regulatory compliance demands

13.3 Impact of drivers and challenges

Impact of drivers and challenges in 2025 and 2030

13.4 Market opportunities

Evolution of decentralized and hybrid clinical trial models
Integration of radiomics and quantitative imaging biomarkers
Advancements in cloud-native platforms and automated data workflows

14. Competitive Landscape

14.1 Overview

14.2

Overview on criticality of inputs and factors of differentiation

14.3 Landscape disruption

Overview on factors of disruption

14.4 Industry risks

Impact of key risks on business

15. Competitive Analysis

15.1 Companies profiled

Companies covered

15.2 Company ranking index

15.3 Market positioning of companies

Matrix on companies position and classification

15.4 Fortrea Holdings Inc.

Fortrea Holdings Inc. - Overview
Fortrea Holdings Inc. - Product / Service
Fortrea Holdings Inc. - Key offerings
SWOT

15.5 IA Group

IA Group - Overview
IA Group - Product / Service
IA Group - Key offerings
SWOT

15.6 ICON plc

ICON plc - Overview
ICON plc - Product / Service
ICON plc - Key offerings
SWOT

15.7 IQVIA Holdings Inc.

IQVIA Holdings Inc. - Overview
IQVIA Holdings Inc. - Business segments
IQVIA Holdings Inc. - Key offerings
IQVIA Holdings Inc. - Segment focus
SWOT

15.8 Medpace Holdings Inc.

Medpace Holdings Inc. - Overview
Medpace Holdings Inc. - Product / Service
Medpace Holdings Inc. - Key offerings
SWOT

15.9 Micron Oncology CRO

Micron Oncology CRO - Overview
Micron Oncology CRO - Product / Service
Micron Oncology CRO - Key offerings
SWOT

15.10 Perceptive Informatics

Perceptive Informatics - Overview
Perceptive Informatics - Product / Service
Perceptive Informatics - Key offerings
SWOT

15.11 PPD

PPD - Overview
PPD - Product / Service
PPD - Key offerings
SWOT

15.12 Prism Clinical Research

Prism Clinical Research - Overview
Prism Clinical Research - Product / Service
Prism Clinical Research - Key offerings
SWOT

15.13 ProScan Imaging

ProScan Imaging - Overview
ProScan Imaging - Product / Service
ProScan Imaging - Key offerings
SWOT

15.14 Radiant Sage

Radiant Sage - Overview
Radiant Sage - Product / Service
Radiant Sage - Key offerings
SWOT

15.15 Resonance Health

Resonance Health - Overview
Resonance Health - Product / Service
Resonance Health - Key offerings
SWOT

15.16 Syneos Health Inc.

Syneos Health Inc. - Overview
Syneos Health Inc. - Product / Service
Syneos Health Inc. - Key offerings
SWOT

15.17 Voiant

Voiant - Overview
Voiant - Product / Service
Voiant - Key offerings
SWOT

15.18 WCG Clinical Inc.

WCG Clinical Inc. - Overview
WCG Clinical Inc. - Product / Service
WCG Clinical Inc. - Key offerings
SWOT

16. Appendix

16.1 Scope of the report

Market definition
Objectives
Notes and caveats

16.2 Inclusions and exclusions checklist

Inclusions checklist
Exclusions checklist

16.3 Currency conversion rates for US$

16.4 Research methodology

16.5 Data procurement

Information sources

16.6 Data validation

16.7 Validation techniques employed for market sizing

16.8 Data synthesis

16.9 360 degree market analysis

16.10 List of abbreviations

Research Methodology

Technavio presents a detailed picture of the market by way of study, synthesis, and summation of data from multiple sources. The analysts have presented the various facets of the market with a particular focus on identifying the key industry influencers. The data thus presented is comprehensive, reliable, and the result of extensive research, both primary and secondary.

INFORMATION SOURCES

Primary sources

  • Manufacturers and suppliers
  • Channel partners
  • Industry experts
  • Strategic decision makers

Secondary sources

  • Industry journals and periodicals
  • Government data
  • Financial reports of key industry players
  • Historical data
  • Press releases

DATA ANALYSIS

Data Synthesis

  • Collation of data
  • Estimation of key figures
  • Analysis of derived insights

Data Validation

  • Triangulation with data models
  • Reference against proprietary databases
  • Corroboration with industry experts

REPORT WRITING

Qualitative

  • Market drivers
  • Market challenges
  • Market trends
  • Five forces analysis

Quantitative

  • Market size and forecast
  • Market segmentation
  • Geographical insights
  • Competitive landscape

Interested in this report?

Get your sample now to see our research methodology and insights!

Download Now

Frequently Asked Questions

Clinical Trial Imaging market growth will increase by USD 628.5 million during 2026-2030.

The Clinical Trial Imaging market is expected to grow at a CAGR of 7.5% during 2026-2030.

Clinical Trial Imaging market is segmented by Modality (Computed tomography, Magnetic resonance imaging, Ultrasound, Positron emission tomography, Others) End-user (Contract research organization, Pharmaceutical companies, Research and academic institutes, Medical device manufacturers) Application (Oncology, Neurology, Cardiology, Endocrinology, Others)

Banook Group, Circle Cardiovascular Imaging, Clario, Fortrea Holdings Inc., IA Group, ICON plc, IQVIA Holdings Inc., IXICO plc, Median Technologies SA, Medpace Holdings Inc., Micron Oncology CRO, Perceptive Informatics, PPD, Prism Clinical Research, ProScan Imaging, Radiant Sage, Resonance Health, Syneos Health Inc., Voiant, WCG Clinical Inc. are a few of the key vendors in the Clinical Trial Imaging market.

North America will register the highest growth rate of 37.6% among the other regions. Therefore, the Clinical Trial Imaging market in North America is expected to garner significant business opportunities for the vendors during the forecast period.

US, Canada, Mexico, Germany, UK, France, Italy, Spain, The Netherlands, China, Japan, South Korea, India, Taiwan, Singapore, Brazil, Saudi Arabia, South Africa, Argentina, UAE, Israel, Egypt, Chile

  • Rise in chronic diseases and growing demand for precision medicine is the driving factor this market.

The Clinical Trial Imaging market vendors should focus on grabbing business opportunities from the Modality segment as it accounted for the largest market share in the base year.
RIA - Research AI Assistant
Ask RIA
