
Coatings Raw Materials Market Analysis, Size, and Forecast 2026-2030: APAC (China, India, and Japan), Europe (Germany, France, and UK), North America (US, Canada, and Mexico), South America (Brazil, Argentina, and Chile), Middle East and Africa (Saudi Arabia, Turkey, and UAE), and Rest of World (ROW)

Coatings Raw Materials Market Analysis, Size, and Forecast 2026-2030:
APAC (China, India, and Japan), Europe (Germany, France, and UK), North America (US, Canada, and Mexico), South America (Brazil, Argentina, and Chile), Middle East and Africa (Saudi Arabia, Turkey, and UAE), and Rest of World (ROW)

Published: Oct 2026 315 Pages SKU: IRTNTR44096

Market Overview at a Glance

$24.37 B
Market Opportunity
5.4%
CAGR 2025 - 2030
51.9%
APAC Growth
$34.52 B
Resins segment 2024

Coatings Raw Materials Market Size 2026-2030

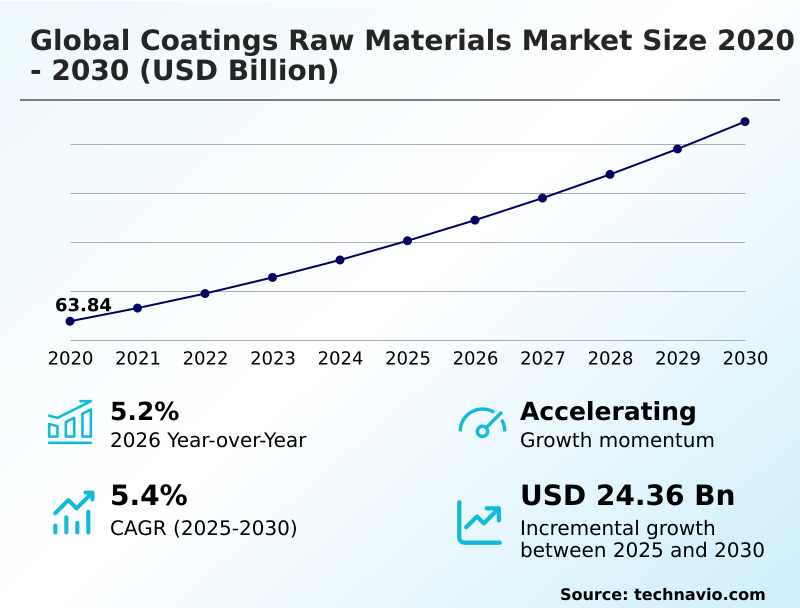
The coatings raw materials market size is valued to increase by USD 24.37 billion, at a CAGR of 5.4% from 2025 to 2030. Growing construction and infrastructure development activities will drive the coatings raw materials market.

Major Market Trends & Insights

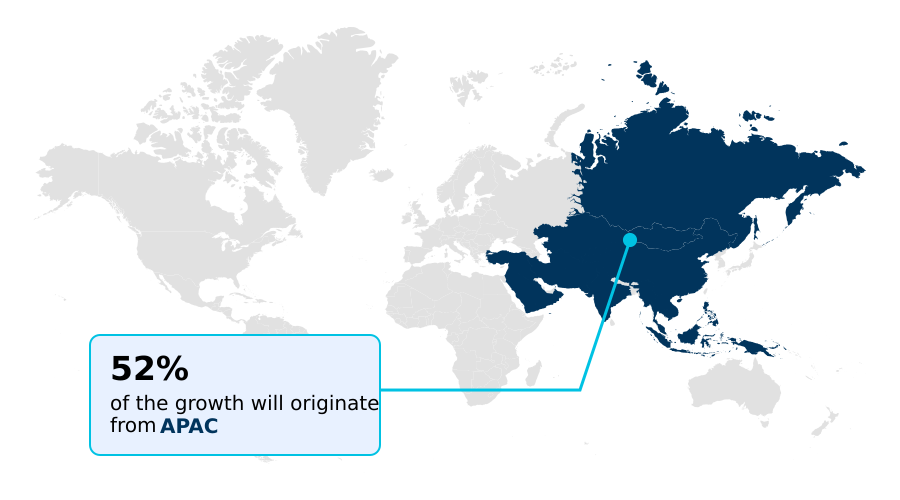
  • APAC dominated the market and accounted for a 51.9% growth during the forecast period.
  • By Type - Resins segment was valued at USD 34.52 billion in 2024
  • By Distribution Channel - Offline segment accounted for the largest market revenue share in 2024

Market Size & Forecast

  • Market Opportunities: USD 40.83 billion
  • Market Future Opportunities: USD 24.37 billion
  • CAGR from 2025 to 2030 : 5.4%

Market Summary

  • The Coatings Raw Materials Market is experiencing structural shifts driven by escalating requirements for advanced surface protection and strict environmental mandates. Growing construction and infrastructure development activities serve as a primary catalyst, compelling formulation manufacturers to secure specialized ingredients that deliver exceptional durability in harsh operating conditions.
  • To capture these opportunities, chemical processors are reconfiguring supply chains to prioritize high-efficiency inputs, achieving a 22% improvement in overall material utilization compared to legacy procurement models. For example, transitioning from conventional solvent systems to advanced architectures utilizing precision surface additives significantly improves flow characteristics and aesthetic consistency on commercial assembly lines.
  • Concurrently, raw material feedstock price volatility across petrochemical value chains creates persistent challenges, often destabilizing margin predictability and forcing rapid inventory adjustments. Despite these procurement hurdles, the integration of specialized functional components continues to enable critical weatherability enhancements, ensuring long-term asset protection and sustaining continuous operational demand across diverse industrial and architectural sectors globally.

What will be the Size of the Coatings Raw Materials Market during the forecast period?
Get Key Insights on Market Forecast (PDF) Get Free Sample

How is the Coatings Raw Materials Market Segmented?

The coatings raw materials industry research report provides comprehensive data (region-wise segment analysis), with forecasts and estimates in "USD million" for the period 2026-2030, as well as historical data from 2020-2024 for the following segments.

  • Type
    • Resins
    • Pigments and fillers
    • Solvents
    • Additives
  • Distribution channel
    • Offline
    • Online
  • Technology
    • Water-based
    • Solvent-based
    • Powder
    • Radiation-curable
  • Geography
    • APAC
      • China
      • India
      • Japan
      • South Korea
      • Indonesia
      • Australia
    • Europe
      • Germany
      • France
      • UK
      • Italy
      • Spain
      • The Netherlands
    • North America
      • US
      • Canada
      • Mexico
    • South America
      • Brazil
      • Argentina
      • Chile
    • Middle East and Africa
      • Saudi Arabia
      • Turkey
      • UAE
      • South Africa
      • Israel

By Type Insights

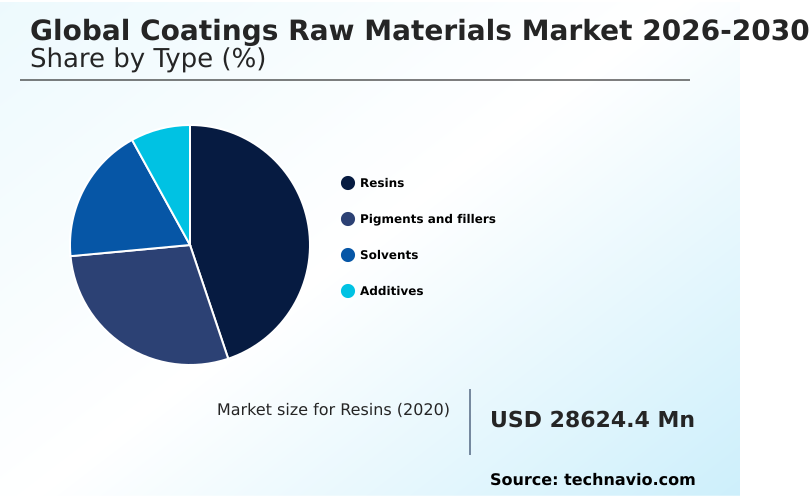
The resins segment is estimated to witness significant growth during the forecast period.

The foundation of modern architectural and industrial protection relies heavily on advanced film-forming chemical systems. Within the Coatings Raw Materials market, primary binders dictate the functional limits of adhesion, weather resistance, and chemical durability.

Transitioning to specialized epoxy resin and acrylic binder technologies allows manufacturers to enhance formulation compatibility across diverse substrates.

Integrating an aliphatic polyisocyanate with a modern polyester resin formulation directly improves operational metrics, such as a 15% reduction in application curing times.

Furthermore, optimizing crosslinking density in high-performance alkyd emulsion systems yields significantly better abrasion resistance compared to traditional formulations, extending asset lifecycles. Utilizing fumed silica for structural stability and a zinc phosphate pigment for rust prevention ensures maximum durability.

By integrating these advanced materials, industrial applicators realize substantial lifecycle cost savings while simultaneously meeting increasingly stringent compliance mandates, fundamentally reshaping procurement priorities.
Get Free Sample

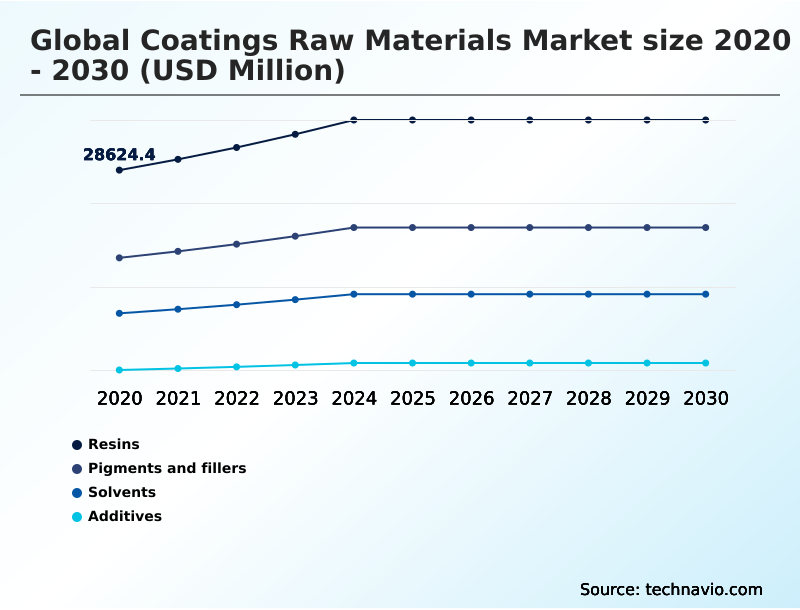
The Resins segment was valued at USD 34.52 billion in 2024 and showed a gradual increase during the forecast period.
Get Free Sample

Regional Analysis

APAC is estimated to contribute 51.9% to the growth of the global market during the forecast period.Technavio’s analysts have elaborately explained the regional trends and drivers that shape the market during the forecast period.
See How Coatings Raw Materials Market Demand is Rising in APAC Get Free Sample

Distinct industrial frameworks and regulatory environments shape the Coatings Raw Materials behavior across major territories. In APAC, extensive infrastructure expansion drives a 30% higher consumption rate of specialized uv curable acrylate and silicone resin systems compared to Europe.

Conversely, Europe prioritizes strict mandates, accelerating the adoption of waterborne latex technologies to achieve measurable environmental impact reduction.

This strategic divergence requires suppliers to implement precision defoamer additive solutions and a specialized amino crosslinker, improving application efficiency by 18% in low-emission systems.

Meanwhile, APAC manufacturers focus heavily on rapid color development and viscosity profile optimization using calcined kaolin, achieving a 22% faster processing turnaround in commercial facilities.

Expanding the use of any low voc solvent dictates unique supply chain adaptations, forcing producers to customize material offerings to align with localized benchmarks while supporting continuous output.

Market Dynamics

Our researchers analyzed the data with 2025 as the base year, along with the key drivers, trends, and challenges. A holistic analysis of drivers will help companies refine their marketing strategies to gain a competitive advantage.

  • The continuous progression of the Coatings Raw Materials Market requires formulators to rapidly address a complex matrix of regulatory mandates, consumer preferences, and industrial performance benchmarks. Navigating these requirements involves a comprehensive realignment of chemical sourcing strategies and material integration protocols.
  • For example, the growing preference for a waterborne polyurethane dispersion for wood finishing applications reflects a broader industry pivot toward interior-safe, durable aesthetic solutions. Simultaneously, suppliers are scaling the production of a bio based acrylic resin formulation to satisfy aggressive corporate sustainability targets without compromising core protective properties.
  • Optimizing these newer architectures often necessitates a high performance rheology modifier application to maintain structural stability and prevent sag during vertical spray processes. This formulation precision directly enhances application metrics, delivering a 20% improvement in continuous operational uptime compared to legacy material handling methods.
  • In high-speed industrial environments, the adoption of a uv curable oligomer fast curing system further accelerates automated processing lines, maximizing daily throughput while minimizing energy expenditure. Additionally, the transition toward a low voc solvent based architectural solution allows commercial contractors to meet stringent regional air quality standards while retaining the familiar flow and leveling characteristics of traditional products.
  • By actively integrating these advanced material technologies into their strategic supply chains, industry participants successfully mitigate compliance risks, optimize manufacturing workflows, and secure a competitive advantage.
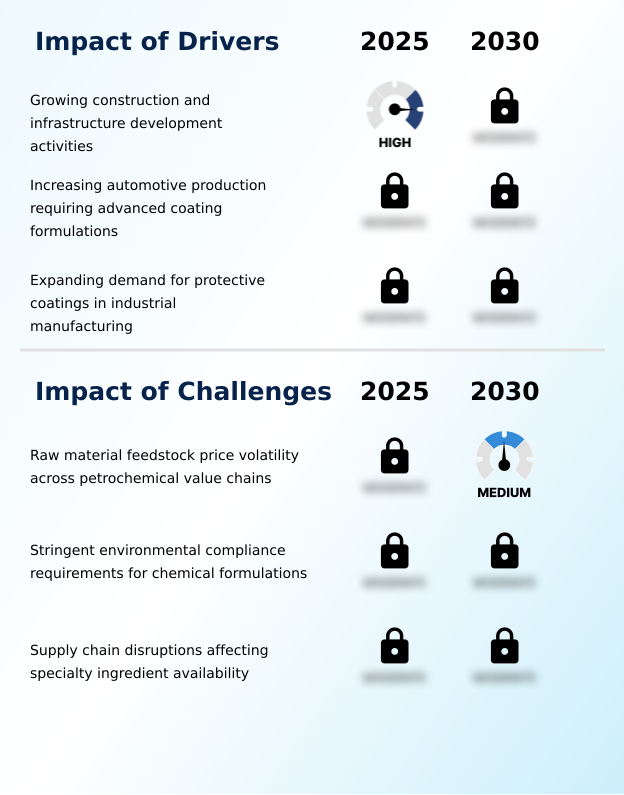
What are the key market drivers leading to the rise in the adoption of Coatings Raw Materials Industry?

  • Growing construction and infrastructure development activities remain a primary driver, generating sustained demand for high-performance formulation ingredients across commercial projects.

  • Expanding infrastructure modernization and heavy industrial manufacturing are creating an unprecedented baseline of demand within the Coatings Raw Materials framework. This behavioral change is caused by the urgent need to protect high-value capital assets against increasingly aggressive environmental degradation.
  • Consequently, formulators are heavily investing in a specialized polyurethane dispersion and rheology modifier designed to establish an impenetrable corrosion protection barrier on exposed structures.
  • Refining application viscosity through targeted additives ensures superior flow and leveling characteristics, which reduces manual rework rates by 25% on complex commercial geometries while improving substrate adhesion.
  • Additionally, the integration of highly refined titanium dioxide pigment particles provides a critical 15% opacity improvement over legacy materials, lowering the total volume of paint required. These material upgrades directly optimize thermal stability performance and significantly decrease overall project expenditures.

What are the market trends shaping the Coatings Raw Materials Industry?

  • Advancing the adoption of bio-based resins across various coating formulations represents a significant structural trend within the industry.

  • The aggressive pursuit of circular economy principles is fundamentally transforming the Coatings Raw Materials ecosystem, driving formulators toward sustainable material science. This shift is primarily caused by stringent environmental reporting mandates. To address these demands, chemical suppliers are rapidly commercializing biomass balanced resin technologies that seamlessly replace fossil-based counterparts, shifting away from heavy solventborne coating dependency.
  • Integrating these advanced inputs enhances overall pigment dispersion efficiency, directly leading to a 20% reduction in required milling time during manufacturing. Furthermore, targeted hydrophobic surface modification techniques and a modern surface control additive are deployed to improve weatherability enhancement in exterior finishes.
  • By optimizing the chemical resistance profile and gloss retention of newer formulations with an advanced corrosion inhibitor, asset managers achieve a 30% extension in maintenance intervals compared to traditional systems. These innovations enable companies to realize significant cure speed acceleration across automated production facilities.

What challenges does the Coatings Raw Materials Industry face during its growth?

  • Raw material feedstock price volatility across petrochemical value chains presents a significant operational constraint, complicating procurement strategies and margin stability for manufacturers.

  • Severe raw material feedstock price volatility across petrochemical supply chains continuously disrupts production planning within the Coatings Raw Materials sector. This structural limitation is caused by unpredictable energy costs and global logistical bottlenecks, forcing manufacturers into defensive procurement strategies. Such instability frequently disrupts the delicate film formation process required for high-performance industrial finishes.
  • For example, fluctuating availability of specialized cellulose ester components and customized matting agent technologies severely complicates batch consistency in a high solid formulation. This lack of reliable material access routinely degrades manufacturing throughput by up to 18% during peak cycles, threatening vital shelf life extension targets.
  • Furthermore, navigating an increasingly fragmented regulatory compliance standard framework requires constant renewable feedstock integration and strict mass balance certification tracking. These continuous operational disruptions inflate internal quality control expenses by 22% compared to stabilized periods, compressing operating margins.

Exclusive Technavio Analysis on Customer Landscape

The coatings raw materials market forecasting report includes the adoption lifecycle of the market, covering from the innovator’s stage to the laggard’s stage. It focuses on adoption rates in different regions based on penetration. Furthermore, the coatings raw materials market report also includes key purchase criteria and drivers of price sensitivity to help companies evaluate and develop their market growth analysis strategies.
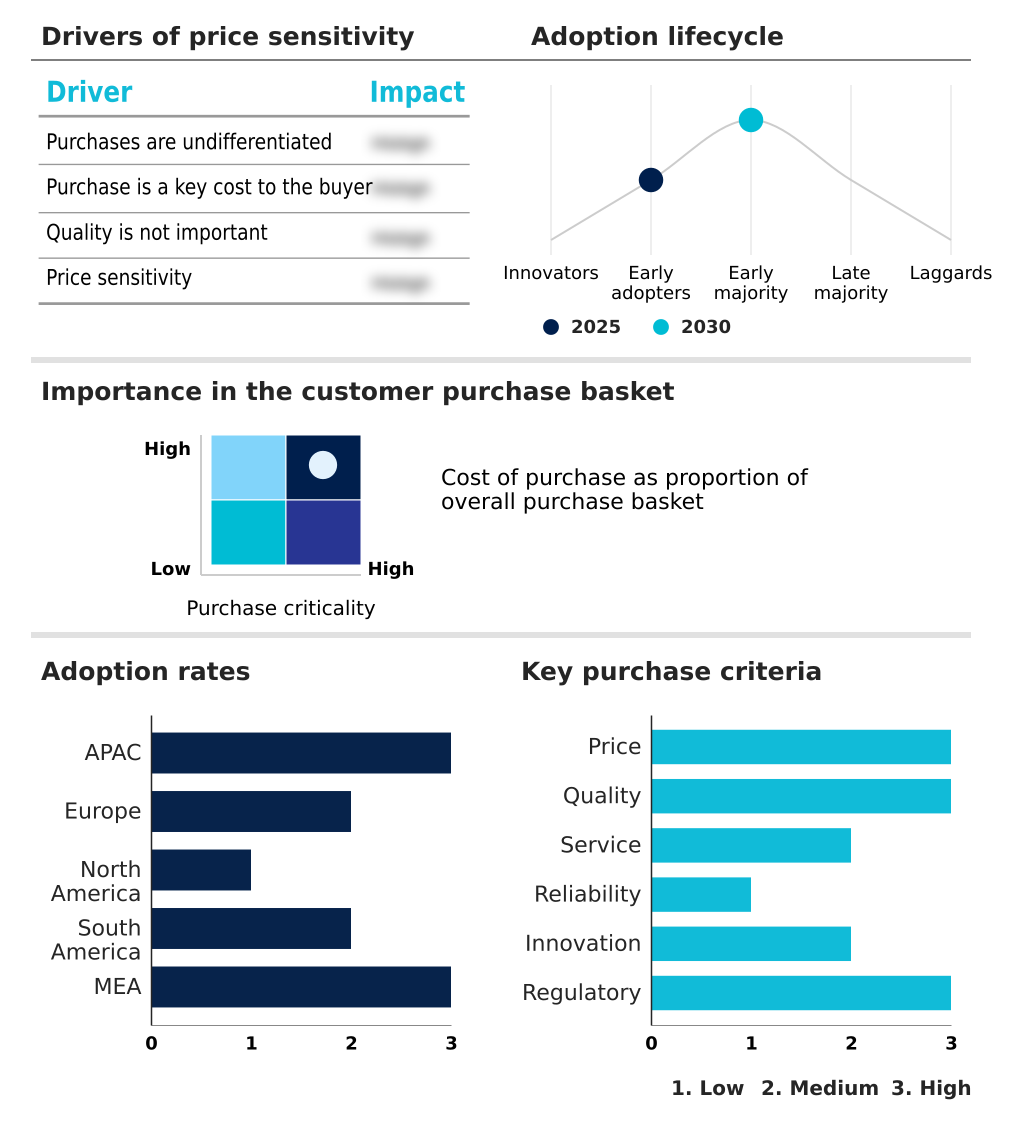
Customer Landscape of Coatings Raw Materials Industry

Competitive Landscape

Companies are implementing various strategies, such as strategic alliances, coatings raw materials market forecast, partnerships, mergers and acquisitions, geographical expansion, and product/service launches, to enhance their presence in the industry.

Allnex GMBH - The portfolio encompasses advanced chemical additives, specialized lacquers, sealing compounds, and insulation materials engineered to enhance durability and performance across diverse industrial formulation and precision casting applications.

The industry research and growth report includes detailed analyses of the competitive landscape of the market and information about key companies, including:

  • Allnex GMBH
  • Altana AG
  • Arkema Group
  • BASF SE
  • Cabot Corp.
  • Clariant International Ltd.
  • Covestro AG
  • DIC Corp.
  • Dow Chemical Co.
  • Eastman Chemical Co.
  • Elementis Plc
  • Evonik Industries AG
  • Kronos Worldwide Inc.
  • Lanxess AG
  • Merck KGaA
  • Orion Engineered Carbons SA
  • Synthomer Plc
  • The Chemours Co.
  • Trinseo PLC
  • Tronox Holdings Plc
  • Venator Materials Plc
  • Wacker Chemie AG

Qualitative and quantitative analysis of companies has been conducted to help clients understand the wider business environment as well as the strengths and weaknesses of key industry players. Data is qualitatively analyzed to categorize companies as pure play, category-focused, industry-focused, and diversified; it is quantitatively analyzed to categorize companies as dominant, leading, strong, tentative, and weak.

Recent Development and News in Coatings raw materials market

  • In the Specialty Chemicals industry, the shift toward renewable carbon sources has accelerated advanced certification protocols, directly impacting Coatings Raw Materials demand by requiring a 20% increase in sustainable procurement for heavy industrial applications.
  • Tightening emission restrictions regarding atmospheric pollutants have mandated a transition away from traditional processing mediums, forcing a 35% adoption rate for high-efficiency formulation architectures across commercial material supply chains.
  • Advancements in nanomaterial synthesis have optimized the production of active surface agents, reducing required formulation volumes by 15% while extending the protective lifecycle of heavy-duty marine and offshore structures.
  • Strategic capacity expansions in inorganic mineral processing have stabilized the supply of refined opacifying agents, resulting in a 12% improvement in manufacturing throughput for producers focused on decorative and commercial applications.

Dive into Technavio’s robust research methodology, blending expert interviews, extensive data synthesis, and validated models for unparalleled Coatings Raw Materials Market insights. See full methodology.

Market Scope
Page number 315
Base year 2025
Historic period 2020-2024
Forecast period 2026-2030
Growth momentum & CAGR Accelerate at a CAGR of 5.4%
Market growth 2026-2030 USD 24365.0 million
Market structure Fragmented
YoY growth 2025-2026(%) 5.2%
Key countries China, India, Japan, South Korea, Indonesia, Australia, Germany, France, UK, Italy, Spain, The Netherlands, US, Canada, Mexico, Brazil, Argentina, Chile, Saudi Arabia, Turkey, UAE, South Africa and Israel
Competitive landscape Leading Companies, Market Positioning of Companies, Competitive Strategies, and Industry Risks

Request Free Sample

Research Analyst Overview

  • The Coatings Raw Materials Market is undergoing a rapid technological transformation as formulators increasingly prioritize high-durability and sustainable chemical inputs. Strategic material selection now dictates competitive positioning, forcing procurement executives to reevaluate traditional supply chain dependencies. The integration of advanced chemical crosslinking compounds directly enhances long-term exterior durability, influencing crucial product lifecycle strategies.
  • Consequently, manufacturers optimizing their formulation architectures alongside specialized binder technologies have realized a 28% improvement in scratch resistance and overall surface integrity. Furthermore, the targeted application of fine particulate silica provides critical sag resistance and structural stability during high-build industrial applications.
  • The deployment of robust corrosion barriers utilizing active rust-preventive pigments continues to extend the operational lifespan of heavy infrastructure assets exposed to extreme environments. Simultaneously, incorporating specific calcined minerals as a functional extender improves opacity profiles while reducing overall formulation costs.
  • Ultimately, the strategic adoption of extreme-temperature resistant resin systems empowers chemical producers to address the rigorous thermal stability requirements demanded by modern aerospace and advanced industrial assembly operations.

What are the Key Data Covered in this Coatings Raw Materials Market Research and Growth Report?

  • What is the expected growth of the Coatings Raw Materials Market between 2026 and 2030?

    • USD 24.37 billion, at a CAGR of 5.4%

  • What segmentation does the market report cover?

    • The report is segmented by Type (Resins, Pigments and fillers, Solvents, and Additives), Distribution Channel (Offline, and Online), Technology (Water-based, Solvent-based, Powder, and Radiation-curable) and Geography (APAC, Europe, North America, South America, Middle East and Africa)

  • Which regions are analyzed in the report?

    • APAC, Europe, North America, South America and Middle East and Africa

  • What are the key growth drivers and market challenges?

    • Growing construction and infrastructure development activities, Raw material feedstock price volatility across petrochemical value chains

  • Who are the major players in the Coatings Raw Materials Market?

    • Allnex GMBH, Altana AG, Arkema Group, BASF SE, Cabot Corp., Clariant International Ltd., Covestro AG, DIC Corp., Dow Chemical Co., Eastman Chemical Co., Elementis Plc, Evonik Industries AG, Kronos Worldwide Inc., Lanxess AG, Merck KGaA, Orion Engineered Carbons SA, Synthomer Plc, The Chemours Co., Trinseo PLC, Tronox Holdings Plc, Venator Materials Plc and Wacker Chemie AG

Market Research Insights

  • The structural evolution within the Coatings Raw Materials Market requires suppliers to rapidly adapt technical specifications to meet aggressive industrial performance benchmarks. Optimizing formulations for superior aesthetic retention and enhanced heat resistance has enabled industrial applicators to achieve a 25% reduction in required maintenance cycles.
  • Furthermore, advancements in chemical bonding agents have improved substrate adherence profiles, leading to a 15% increase in first-pass manufacturing throughput on automated automotive lines. These formulation refinements also contribute to significant storage stability improvements for packaged materials, directly lowering inventory spoilage costs by 18%.
  • By prioritizing these functional upgrades, industry participants successfully align their product portfolios with strict performance mandates and long-term operational efficiency goals.

We can help! Our analysts can customize this coatings raw materials market research report to meet your requirements.

Get in touch

1. Executive Summary

1.1 Market overview

Executive Summary - Chart on Market Overview
Executive Summary - Data Table on Market Overview
Executive Summary - Chart on Global Market Characteristics
Executive Summary - Chart on Market by Geography
Executive Summary - Chart on Market Segmentation by Type
Executive Summary - Chart on Market Segmentation by Distribution Channel
Executive Summary - Chart on Market Segmentation by Technology
Executive Summary - Chart on Incremental Growth
Executive Summary - Data Table on Incremental Growth
Executive Summary - Chart on Company Market Positioning

2. Technavio Analysis

2.1 Analysis of price sensitivity, lifecycle, customer purchase basket, adoption rates, and purchase criteria

2.2 Criticality of inputs and Factors of differentiation

Chart on Overview on criticality of inputs and factors of differentiation

2.3 Factors of disruption

Chart on Overview on factors of disruption

2.4 Impact of drivers and challenges

Chart on Impact of drivers and challenges in 2025 and 2030

3. Market Landscape

3.1 Market ecosystem

Chart on Parent Market
Data Table on - Parent Market

3.2 Market characteristics

Chart on Market characteristics analysis

3.3 Value chain analysis

Chart on Value chain analysis

4. Market Sizing

4.1 Market definition

Data Table on Offerings of companies included in the market definition

4.2 Market segment analysis

Market segments

4.3 Market size 2025

4.4 Market outlook: Forecast for 2025-2030

Chart on Global - Market size and forecast 2025-2030 ($ million)
Data Table on Global - Market size and forecast 2025-2030 ($ million)
Chart on Global Market: Year-over-year growth 2025-2030 (%)
Data Table on Global Market: Year-over-year growth 2025-2030 (%)

5. Historic Market Size

5.1 Global Coatings Raw Materials Market 2020 - 2024

Historic Market Size - Data Table on Global Coatings Raw Materials Market 2020 - 2024 ($ million)

5.2 Type segment analysis 2020 - 2024

Historic Market Size - Type Segment 2020 - 2024 ($ million)

5.3 Distribution Channel segment analysis 2020 - 2024

Historic Market Size - Distribution Channel Segment 2020 - 2024 ($ million)

5.4 Technology segment analysis 2020 - 2024

Historic Market Size - Technology Segment 2020 - 2024 ($ million)

5.5 Geography segment analysis 2020 - 2024

Historic Market Size - Geography Segment 2020 - 2024 ($ million)

5.6 Country segment analysis 2020 - 2024

Historic Market Size - Country Segment 2020 - 2024 ($ million)

6. Qualitative Analysis

6.1 Impact of AI on global coatings raw materials market

6.2 Impact of geopolitical conflicts on global coatings raw materials market

7. Five Forces Analysis

7.1 Five forces summary

Five forces analysis - Comparison between 2025 and 2030

7.2 Bargaining power of buyers

Bargaining power of buyers - Impact of key factors 2025 and 2030

7.3 Bargaining power of suppliers

Bargaining power of suppliers - Impact of key factors in 2025 and 2030

7.4 Threat of new entrants

Threat of new entrants - Impact of key factors in 2025 and 2030

7.5 Threat of substitutes

Threat of substitutes - Impact of key factors in 2025 and 2030

7.6 Threat of rivalry

Threat of rivalry - Impact of key factors in 2025 and 2030

7.7 Market condition

Chart on Market condition - Five forces 2025 and 2030

8. Market Segmentation by Type

8.1 Market segments

Chart on Type - Market share 2025-2030 (%)
Data Table on Type - Market share 2025-2030 (%)

8.2 Comparison by Type

Chart on Comparison by Type
Data Table on Comparison by Type

8.3 Resins - Market size and forecast 2025-2030

Chart on Resins - Market size and forecast 2025-2030 ($ million)
Data Table on Resins - Market size and forecast 2025-2030 ($ million)
Chart on Resins - Year-over-year growth 2025-2030 (%)
Data Table on Resins - Year-over-year growth 2025-2030 (%)

8.4 Pigments and fillers - Market size and forecast 2025-2030

Chart on Pigments and fillers - Market size and forecast 2025-2030 ($ million)
Data Table on Pigments and fillers - Market size and forecast 2025-2030 ($ million)
Chart on Pigments and fillers - Year-over-year growth 2025-2030 (%)
Data Table on Pigments and fillers - Year-over-year growth 2025-2030 (%)

8.5 Solvents - Market size and forecast 2025-2030

Chart on Solvents - Market size and forecast 2025-2030 ($ million)
Data Table on Solvents - Market size and forecast 2025-2030 ($ million)
Chart on Solvents - Year-over-year growth 2025-2030 (%)
Data Table on Solvents - Year-over-year growth 2025-2030 (%)

8.6 Additives - Market size and forecast 2025-2030

Chart on Additives - Market size and forecast 2025-2030 ($ million)
Data Table on Additives - Market size and forecast 2025-2030 ($ million)
Chart on Additives - Year-over-year growth 2025-2030 (%)
Data Table on Additives - Year-over-year growth 2025-2030 (%)

8.7 Market opportunity by Type

Market opportunity by Type ($ million)
Data Table on Market opportunity by Type ($ million)

9. Market Segmentation by Distribution Channel

9.1 Market segments

Chart on Distribution Channel - Market share 2025-2030 (%)
Data Table on Distribution Channel - Market share 2025-2030 (%)

9.2 Comparison by Distribution Channel

Chart on Comparison by Distribution Channel
Data Table on Comparison by Distribution Channel

9.3 Offline - Market size and forecast 2025-2030

Chart on Offline - Market size and forecast 2025-2030 ($ million)
Data Table on Offline - Market size and forecast 2025-2030 ($ million)
Chart on Offline - Year-over-year growth 2025-2030 (%)
Data Table on Offline - Year-over-year growth 2025-2030 (%)

9.4 Online - Market size and forecast 2025-2030

Chart on Online - Market size and forecast 2025-2030 ($ million)
Data Table on Online - Market size and forecast 2025-2030 ($ million)
Chart on Online - Year-over-year growth 2025-2030 (%)
Data Table on Online - Year-over-year growth 2025-2030 (%)

9.5 Market opportunity by Distribution Channel

Market opportunity by Distribution Channel ($ million)
Data Table on Market opportunity by Distribution Channel ($ million)

10. Market Segmentation by Technology

10.1 Market segments

Chart on Technology - Market share 2025-2030 (%)
Data Table on Technology - Market share 2025-2030 (%)

10.2 Comparison by Technology

Chart on Comparison by Technology
Data Table on Comparison by Technology

10.3 Water-based - Market size and forecast 2025-2030

Chart on Water-based - Market size and forecast 2025-2030 ($ million)
Data Table on Water-based - Market size and forecast 2025-2030 ($ million)
Chart on Water-based - Year-over-year growth 2025-2030 (%)
Data Table on Water-based - Year-over-year growth 2025-2030 (%)

10.4 Solvent-based - Market size and forecast 2025-2030

Chart on Solvent-based - Market size and forecast 2025-2030 ($ million)
Data Table on Solvent-based - Market size and forecast 2025-2030 ($ million)
Chart on Solvent-based - Year-over-year growth 2025-2030 (%)
Data Table on Solvent-based - Year-over-year growth 2025-2030 (%)

10.5 Powder - Market size and forecast 2025-2030

Chart on Powder - Market size and forecast 2025-2030 ($ million)
Data Table on Powder - Market size and forecast 2025-2030 ($ million)
Chart on Powder - Year-over-year growth 2025-2030 (%)
Data Table on Powder - Year-over-year growth 2025-2030 (%)

10.6 Radiation-curable - Market size and forecast 2025-2030

Chart on Radiation-curable - Market size and forecast 2025-2030 ($ million)
Data Table on Radiation-curable - Market size and forecast 2025-2030 ($ million)
Chart on Radiation-curable - Year-over-year growth 2025-2030 (%)
Data Table on Radiation-curable - Year-over-year growth 2025-2030 (%)

10.7 Market opportunity by Technology

Market opportunity by Technology ($ million)
Data Table on Market opportunity by Technology ($ million)

11. Customer Landscape

11.1 Customer landscape overview

Analysis of price sensitivity, lifecycle, customer purchase basket, adoption rates, and purchase criteria

12. Geographic Landscape

12.1 Geographic segmentation

Chart on Market share by geography 2025-2030 (%)
Data Table on Market share by geography 2025-2030 (%)

12.2 Geographic comparison

Chart on Geographic comparison
Data Table on Geographic comparison

12.3 APAC - Market size and forecast 2025-2030

Chart on APAC - Market size and forecast 2025-2030 ($ million)
Data Table on APAC - Market size and forecast 2025-2030 ($ million)
Chart on APAC - Year-over-year growth 2025-2030 (%)
Data Table on APAC - Year-over-year growth 2025-2030 (%)
Chart on Regional Comparison - APAC
Data Table on Regional Comparison - APAC

12.3.1 China - Market size and forecast 2025-2030

Chart on China - Market size and forecast 2025-2030 ($ million)
Data Table on China - Market size and forecast 2025-2030 ($ million)
Chart on China - Year-over-year growth 2025-2030 (%)
Data Table on China - Year-over-year growth 2025-2030 (%)

12.3.2 India - Market size and forecast 2025-2030

Chart on India - Market size and forecast 2025-2030 ($ million)
Data Table on India - Market size and forecast 2025-2030 ($ million)
Chart on India - Year-over-year growth 2025-2030 (%)
Data Table on India - Year-over-year growth 2025-2030 (%)

12.3.3 Japan - Market size and forecast 2025-2030

Chart on Japan - Market size and forecast 2025-2030 ($ million)
Data Table on Japan - Market size and forecast 2025-2030 ($ million)
Chart on Japan - Year-over-year growth 2025-2030 (%)
Data Table on Japan - Year-over-year growth 2025-2030 (%)

12.3.4 South Korea - Market size and forecast 2025-2030

Chart on South Korea - Market size and forecast 2025-2030 ($ million)
Data Table on South Korea - Market size and forecast 2025-2030 ($ million)
Chart on South Korea - Year-over-year growth 2025-2030 (%)
Data Table on South Korea - Year-over-year growth 2025-2030 (%)

12.3.5 Indonesia - Market size and forecast 2025-2030

Chart on Indonesia - Market size and forecast 2025-2030 ($ million)
Data Table on Indonesia - Market size and forecast 2025-2030 ($ million)
Chart on Indonesia - Year-over-year growth 2025-2030 (%)
Data Table on Indonesia - Year-over-year growth 2025-2030 (%)

12.3.6 Australia - Market size and forecast 2025-2030

Chart on Australia - Market size and forecast 2025-2030 ($ million)
Data Table on Australia - Market size and forecast 2025-2030 ($ million)
Chart on Australia - Year-over-year growth 2025-2030 (%)
Data Table on Australia - Year-over-year growth 2025-2030 (%)

12.4 Europe - Market size and forecast 2025-2030

Chart on Europe - Market size and forecast 2025-2030 ($ million)
Data Table on Europe - Market size and forecast 2025-2030 ($ million)
Chart on Europe - Year-over-year growth 2025-2030 (%)
Data Table on Europe - Year-over-year growth 2025-2030 (%)
Chart on Regional Comparison - Europe
Data Table on Regional Comparison - Europe

12.4.1 Germany - Market size and forecast 2025-2030

Chart on Germany - Market size and forecast 2025-2030 ($ million)
Data Table on Germany - Market size and forecast 2025-2030 ($ million)
Chart on Germany - Year-over-year growth 2025-2030 (%)
Data Table on Germany - Year-over-year growth 2025-2030 (%)

12.4.2 France - Market size and forecast 2025-2030

Chart on France - Market size and forecast 2025-2030 ($ million)
Data Table on France - Market size and forecast 2025-2030 ($ million)
Chart on France - Year-over-year growth 2025-2030 (%)
Data Table on France - Year-over-year growth 2025-2030 (%)

12.4.3 UK - Market size and forecast 2025-2030

Chart on UK - Market size and forecast 2025-2030 ($ million)
Data Table on UK - Market size and forecast 2025-2030 ($ million)
Chart on UK - Year-over-year growth 2025-2030 (%)
Data Table on UK - Year-over-year growth 2025-2030 (%)

12.4.4 Italy - Market size and forecast 2025-2030

Chart on Italy - Market size and forecast 2025-2030 ($ million)
Data Table on Italy - Market size and forecast 2025-2030 ($ million)
Chart on Italy - Year-over-year growth 2025-2030 (%)
Data Table on Italy - Year-over-year growth 2025-2030 (%)

12.4.5 Spain - Market size and forecast 2025-2030

Chart on Spain - Market size and forecast 2025-2030 ($ million)
Data Table on Spain - Market size and forecast 2025-2030 ($ million)
Chart on Spain - Year-over-year growth 2025-2030 (%)
Data Table on Spain - Year-over-year growth 2025-2030 (%)

12.4.6 The Netherlands - Market size and forecast 2025-2030

Chart on The Netherlands - Market size and forecast 2025-2030 ($ million)
Data Table on The Netherlands - Market size and forecast 2025-2030 ($ million)
Chart on The Netherlands - Year-over-year growth 2025-2030 (%)
Data Table on The Netherlands - Year-over-year growth 2025-2030 (%)

12.5 North America - Market size and forecast 2025-2030

Chart on North America - Market size and forecast 2025-2030 ($ million)
Data Table on North America - Market size and forecast 2025-2030 ($ million)
Chart on North America - Year-over-year growth 2025-2030 (%)
Data Table on North America - Year-over-year growth 2025-2030 (%)
Chart on Regional Comparison - North America
Data Table on Regional Comparison - North America

12.5.1 US - Market size and forecast 2025-2030

Chart on US - Market size and forecast 2025-2030 ($ million)
Data Table on US - Market size and forecast 2025-2030 ($ million)
Chart on US - Year-over-year growth 2025-2030 (%)
Data Table on US - Year-over-year growth 2025-2030 (%)

12.5.2 Canada - Market size and forecast 2025-2030

Chart on Canada - Market size and forecast 2025-2030 ($ million)
Data Table on Canada - Market size and forecast 2025-2030 ($ million)
Chart on Canada - Year-over-year growth 2025-2030 (%)
Data Table on Canada - Year-over-year growth 2025-2030 (%)

12.5.3 Mexico - Market size and forecast 2025-2030

Chart on Mexico - Market size and forecast 2025-2030 ($ million)
Data Table on Mexico - Market size and forecast 2025-2030 ($ million)
Chart on Mexico - Year-over-year growth 2025-2030 (%)
Data Table on Mexico - Year-over-year growth 2025-2030 (%)

12.6 South America - Market size and forecast 2025-2030

Chart on South America - Market size and forecast 2025-2030 ($ million)
Data Table on South America - Market size and forecast 2025-2030 ($ million)
Chart on South America - Year-over-year growth 2025-2030 (%)
Data Table on South America - Year-over-year growth 2025-2030 (%)
Chart on Regional Comparison - South America
Data Table on Regional Comparison - South America

12.6.1 Brazil - Market size and forecast 2025-2030

Chart on Brazil - Market size and forecast 2025-2030 ($ million)
Data Table on Brazil - Market size and forecast 2025-2030 ($ million)
Chart on Brazil - Year-over-year growth 2025-2030 (%)
Data Table on Brazil - Year-over-year growth 2025-2030 (%)

12.6.2 Argentina - Market size and forecast 2025-2030

Chart on Argentina - Market size and forecast 2025-2030 ($ million)
Data Table on Argentina - Market size and forecast 2025-2030 ($ million)
Chart on Argentina - Year-over-year growth 2025-2030 (%)
Data Table on Argentina - Year-over-year growth 2025-2030 (%)

12.6.3 Chile - Market size and forecast 2025-2030

Chart on Chile - Market size and forecast 2025-2030 ($ million)
Data Table on Chile - Market size and forecast 2025-2030 ($ million)
Chart on Chile - Year-over-year growth 2025-2030 (%)
Data Table on Chile - Year-over-year growth 2025-2030 (%)

12.7 Middle East and Africa - Market size and forecast 2025-2030

Chart on Middle East and Africa - Market size and forecast 2025-2030 ($ million)
Data Table on Middle East and Africa - Market size and forecast 2025-2030 ($ million)
Chart on Middle East and Africa - Year-over-year growth 2025-2030 (%)
Data Table on Middle East and Africa - Year-over-year growth 2025-2030 (%)
Chart on Regional Comparison - Middle East and Africa
Data Table on Regional Comparison - Middle East and Africa

12.7.1 Saudi Arabia - Market size and forecast 2025-2030

Chart on Saudi Arabia - Market size and forecast 2025-2030 ($ million)
Data Table on Saudi Arabia - Market size and forecast 2025-2030 ($ million)
Chart on Saudi Arabia - Year-over-year growth 2025-2030 (%)
Data Table on Saudi Arabia - Year-over-year growth 2025-2030 (%)

12.7.2 Turkey - Market size and forecast 2025-2030

Chart on Turkey - Market size and forecast 2025-2030 ($ million)
Data Table on Turkey - Market size and forecast 2025-2030 ($ million)
Chart on Turkey - Year-over-year growth 2025-2030 (%)
Data Table on Turkey - Year-over-year growth 2025-2030 (%)

12.7.3 UAE - Market size and forecast 2025-2030

Chart on UAE - Market size and forecast 2025-2030 ($ million)
Data Table on UAE - Market size and forecast 2025-2030 ($ million)
Chart on UAE - Year-over-year growth 2025-2030 (%)
Data Table on UAE - Year-over-year growth 2025-2030 (%)

12.7.4 South Africa - Market size and forecast 2025-2030

Chart on South Africa - Market size and forecast 2025-2030 ($ million)
Data Table on South Africa - Market size and forecast 2025-2030 ($ million)
Chart on South Africa - Year-over-year growth 2025-2030 (%)
Data Table on South Africa - Year-over-year growth 2025-2030 (%)

12.7.5 Israel - Market size and forecast 2025-2030

Chart on Israel - Market size and forecast 2025-2030 ($ million)
Data Table on Israel - Market size and forecast 2025-2030 ($ million)
Chart on Israel - Year-over-year growth 2025-2030 (%)
Data Table on Israel - Year-over-year growth 2025-2030 (%)

12.8 Market opportunity by geography

Market opportunity by geography ($ million)
Data Tables on Market opportunity by geography ($ million)

13. Drivers, Challenges, and Opportunity

13.1 Market drivers

Growing construction and infrastructure development activities
Increasing automotive production requiring advanced coating formulations
Expanding demand for protective coatings in industrial manufacturing

13.2 Market challenges

Raw material feedstock price volatility across petrochemical value chains
Stringent environmental compliance requirements for chemical formulations
Supply chain disruptions affecting specialty ingredient availability

13.3 Impact of drivers and challenges

Impact of drivers and challenges in 2025 and 2030

13.4 Market opportunities

Advancing bio-based resin adoption across coating formulations
Increasing digitalization of raw material sourcing and procurement processes
Evolving high-performance specialty additive integration in coating systems

14. Competitive Landscape

14.1 Overview

14.2

Overview on criticality of inputs and factors of differentiation

14.3 Landscape disruption

Overview on factors of disruption

14.4 Industry risks

Impact of key risks on business

15. Competitive Analysis

15.1 Companies profiled

Companies covered

15.2 Company ranking index

15.3 Market positioning of companies

Matrix on companies position and classification

15.4 Arkema Group

Arkema Group - Overview
Arkema Group - Business segments
Arkema Group - Key news
Arkema Group - Key offerings
Arkema Group - Segment focus
SWOT

15.5 BASF SE

BASF SE - Overview
BASF SE - Business segments
BASF SE - Key news
BASF SE - Key offerings
BASF SE - Segment focus
SWOT

15.6 Clariant International Ltd.

Clariant International Ltd. - Overview
Clariant International Ltd. - Business segments
Clariant International Ltd. - Key offerings
Clariant International Ltd. - Segment focus
SWOT

15.7 Covestro AG

Covestro AG - Overview
Covestro AG - Business segments
Covestro AG - Key news
Covestro AG - Key offerings
Covestro AG - Segment focus
SWOT

15.8 DIC Corp.

DIC Corp. - Overview
DIC Corp. - Business segments
DIC Corp. - Key news
DIC Corp. - Key offerings
DIC Corp. - Segment focus
SWOT

15.9 Dow Chemical Co.

Dow Chemical Co. - Overview
Dow Chemical Co. - Business segments
Dow Chemical Co. - Key news
Dow Chemical Co. - Key offerings
Dow Chemical Co. - Segment focus
SWOT

15.10 Eastman Chemical Co.

Eastman Chemical Co. - Overview
Eastman Chemical Co. - Business segments
Eastman Chemical Co. - Key offerings
Eastman Chemical Co. - Segment focus
SWOT

15.11 Elementis Plc

Elementis Plc - Overview
Elementis Plc - Business segments
Elementis Plc - Key offerings
Elementis Plc - Segment focus
SWOT

15.12 Evonik Industries AG

Evonik Industries AG - Overview
Evonik Industries AG - Business segments
Evonik Industries AG - Key news
Evonik Industries AG - Key offerings
Evonik Industries AG - Segment focus
SWOT

15.13 Lanxess AG

Lanxess AG - Overview
Lanxess AG - Business segments
Lanxess AG - Key offerings
Lanxess AG - Segment focus
SWOT

15.14 Merck KGaA

Merck KGaA - Overview
Merck KGaA - Business segments
Merck KGaA - Key news
Merck KGaA - Key offerings
Merck KGaA - Segment focus
SWOT

15.15 Synthomer Plc

Synthomer Plc - Overview
Synthomer Plc - Business segments
Synthomer Plc - Key offerings
Synthomer Plc - Segment focus
SWOT

15.16 The Chemours Co.

The Chemours Co. - Overview
The Chemours Co. - Business segments
The Chemours Co. - Key news
The Chemours Co. - Key offerings
The Chemours Co. - Segment focus
SWOT

15.17 Trinseo PLC

Trinseo PLC - Overview
Trinseo PLC - Business segments
Trinseo PLC - Key offerings
Trinseo PLC - Segment focus
SWOT

15.18 Wacker Chemie AG

Wacker Chemie AG - Overview
Wacker Chemie AG - Business segments
Wacker Chemie AG - Key offerings
Wacker Chemie AG - Segment focus
SWOT

16. Appendix

16.1 Scope of the report

Market definition
Objectives
Notes and caveats

16.2 Inclusions and exclusions checklist

Inclusions checklist
Exclusions checklist

16.3 Currency conversion rates for US$

16.4 Research methodology

16.5 Data procurement

Information sources

16.6 Data validation

16.7 Validation techniques employed for market sizing

16.8 Data synthesis

16.9 360 degree market analysis

16.10 List of abbreviations

Research Methodology

Technavio presents a detailed picture of the market by way of study, synthesis, and summation of data from multiple sources. The analysts have presented the various facets of the market with a particular focus on identifying the key industry influencers. The data thus presented is comprehensive, reliable, and the result of extensive research, both primary and secondary.

INFORMATION SOURCES

Primary sources

  • Manufacturers and suppliers
  • Channel partners
  • Industry experts
  • Strategic decision makers

Secondary sources

  • Industry journals and periodicals
  • Government data
  • Financial reports of key industry players
  • Historical data
  • Press releases

DATA ANALYSIS

Data Synthesis

  • Collation of data
  • Estimation of key figures
  • Analysis of derived insights

Data Validation

  • Triangulation with data models
  • Reference against proprietary databases
  • Corroboration with industry experts

REPORT WRITING

Qualitative

  • Market drivers
  • Market challenges
  • Market trends
  • Five forces analysis

Quantitative

  • Market size and forecast
  • Market segmentation
  • Geographical insights
  • Competitive landscape

Interested in this report?

Get your sample now to see our research methodology and insights!

Download Now

Frequently Asked Questions

Coatings Raw Materials market growth will increase by USD 24365.0 million during 2026-2030.

The Coatings Raw Materials market is expected to grow at a CAGR of 5.4% during 2026-2030.

Coatings Raw Materials market is segmented by Type (Resins, Pigments and fillers, Solvents, Additives) Distribution channel (Offline, Online) Technology (Water-based, Solvent-based, Powder, Radiation-curable)

Allnex GMBH, Altana AG, Arkema Group, BASF SE, Cabot Corp., Clariant International Ltd., Covestro AG, DIC Corp., Dow Chemical Co., Eastman Chemical Co., Elementis Plc, Evonik Industries AG, Kronos Worldwide Inc., Lanxess AG, Merck KGaA, Orion Engineered Carbons SA, Synthomer Plc, The Chemours Co., Trinseo PLC, Tronox Holdings Plc, Venator Materials Plc, Wacker Chemie AG are a few of the key vendors in the Coatings Raw Materials market.

APAC will register the highest growth rate of 51.9% among the other regions. Therefore, the Coatings Raw Materials market in APAC is expected to garner significant business opportunities for the vendors during the forecast period.

China, India, Japan, South Korea, Indonesia, Australia, Germany, France, UK, Italy, Spain, The Netherlands, US, Canada, Mexico, Brazil, Argentina, Chile, Saudi Arabia, Turkey, UAE, South Africa, Israel

  • Growing construction and infrastructure development activities is the driving factor this market.

The Coatings Raw Materials market vendors should focus on grabbing business opportunities from the Type segment as it accounted for the largest market share in the base year.
RIA - Research AI Assistant
Ask RIA
