
Commercial Carpet Market Analysis, Size, and Forecast 2026-2030: North America (US, Canada, and Mexico), Europe (UK, Germany, and France), APAC (China, Japan, and India), South America (Brazil, Argentina, and Chile), Middle East and Africa (Saudi Arabia, UAE, and South Africa), and Rest of World (ROW)

Commercial Carpet Market Analysis, Size, and Forecast 2026-2030:
North America (US, Canada, and Mexico), Europe (UK, Germany, and France), APAC (China, Japan, and India), South America (Brazil, Argentina, and Chile), Middle East and Africa (Saudi Arabia, UAE, and South Africa), and Rest of World (ROW)

Published: Oct 2026 288 Pages SKU: IRTNTR73628

Market Overview at a Glance

$13.65 B
Market Opportunity
5.5%
CAGR 2025 - 2030
36.8%
North America Growth
$28.71 B
Carpet tiles segment 2024

Commercial Carpet Market Size 2026-2030

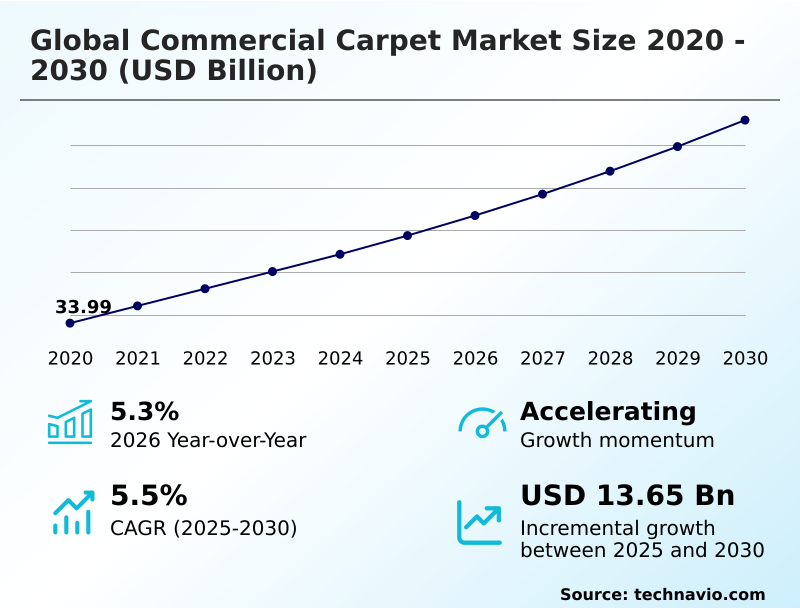
The commercial carpet market size is valued to increase by USD 13.65 billion, at a CAGR of 5.5% from 2025 to 2030. Growth in commercial interior renovation activities will drive the commercial carpet market.

Major Market Trends & Insights

  • North America dominated the market and accounted for a 36.8% growth during the forecast period.
  • By Product - Carpet tiles segment was valued at USD 28.71 billion in 2024
  • By Material - Nylon segment accounted for the largest market revenue share in 2024

Market Size & Forecast

  • Market Opportunities: USD 24.00 billion
  • Market Future Opportunities: USD 13.65 billion
  • CAGR from 2025 to 2030 : 5.5%

Market Summary

  • The Commercial Carpet Market is characterized by robust demand across diverse professional environments, driven by continuous infrastructure modernization. Facility operators consistently prioritize flooring systems that balance heavy traffic resistance with acoustic insulation backing to enhance spatial functionality. Accelerating investment in commercial interior renovation activities serves as a primary catalyst for product adoption.
  • For instance, hospitality operators implementing phased flooring replacements achieve a 20% improvement in maintenance turnaround time without requiring total facility closures. This operational efficiency directly supports continuous revenue generation during extensive refurbishments. However, the industry faces significant constraints due to persistent raw material cost volatility.
  • Fluctuating prices for synthetic fiber blending and backing materials frequently force manufacturers to adjust procurement strategies, straining project budgets. Consequently, procurement teams are shifting toward localized sourcing models to mitigate supply disruptions. The integration of closed loop recycling further optimizes material availability while addressing sustainability mandates.
  • As environmental regulations tighten, the specification of highly durable, circular flooring configurations will continue redefining commercial interior investments.

What will be the Size of the Commercial Carpet Market during the forecast period?
Get Key Insights on Market Forecast (PDF) Get Free Sample

How is the Commercial Carpet Market Segmented?

The commercial carpet industry research report provides comprehensive data (region-wise segment analysis), with forecasts and estimates in "USD million" for the period 2026-2030, as well as historical data from 2020-2024 for the following segments.

  • Product
    • Carpet tiles
    • Broadlooms
  • Material
    • Nylon
    • Polyester
  • Type
    • Direct glue down
    • Stretch-in
  • Geography
    • North America
      • US
      • Canada
      • Mexico
    • Europe
      • UK
      • Germany
      • France
      • Italy
      • Spain
    • APAC
      • China
      • Japan
      • India
      • South Korea
      • Australia
      • Singapore
    • South America
      • Brazil
      • Argentina
      • Chile
    • Middle East and Africa
      • Saudi Arabia
      • UAE
      • South Africa
      • Israel
      • Turkey

By Product Insights

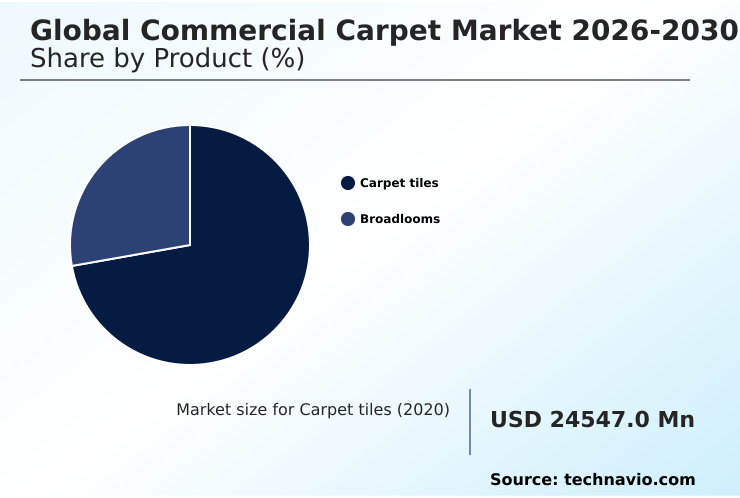
The carpet tiles segment is estimated to witness significant growth during the forecast period.

Commercial Carpet products are increasingly defined by diverse carpet tile configurations and direct glue down installation methods, adapting to the dynamic requirements of commercial interior surfacing.

These modular flooring formats provide distinct operational advantages over traditional stretch-in cushion systems by enabling targeted replacements in high-traffic zones. Facility managers implementing phased installation strategies report that localized repairs increase installation efficiency, minimizing operational disruption.

This approach improves overall maintenance labor reduction by up to 25%, significantly lowering lifecycle expenditure. In addition to functional benefits, this segmentation supports workplace modernization by facilitating flexible space utilization metrics and distinct visual zoning.

As organizations prioritize adaptability, the specification of these systems continues to accelerate, aligning interior aesthetics with long-term facility operations continuity.
Get Free Sample

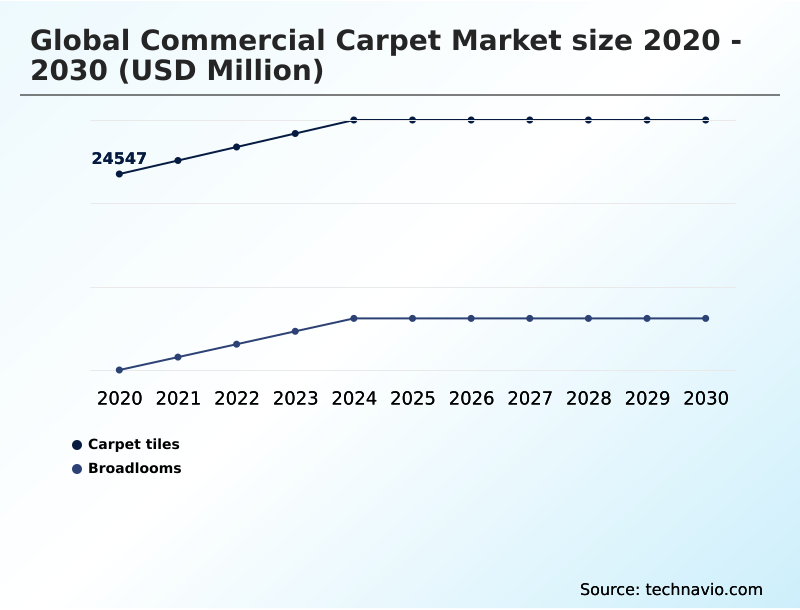
The Carpet tiles segment was valued at USD 28.71 billion in 2024 and showed a gradual increase during the forecast period.
Get Free Sample

Regional Analysis

North America is estimated to contribute 36.8% to the growth of the global market during the forecast period.Technavio’s analysts have elaborately explained the regional trends and drivers that shape the market during the forecast period.
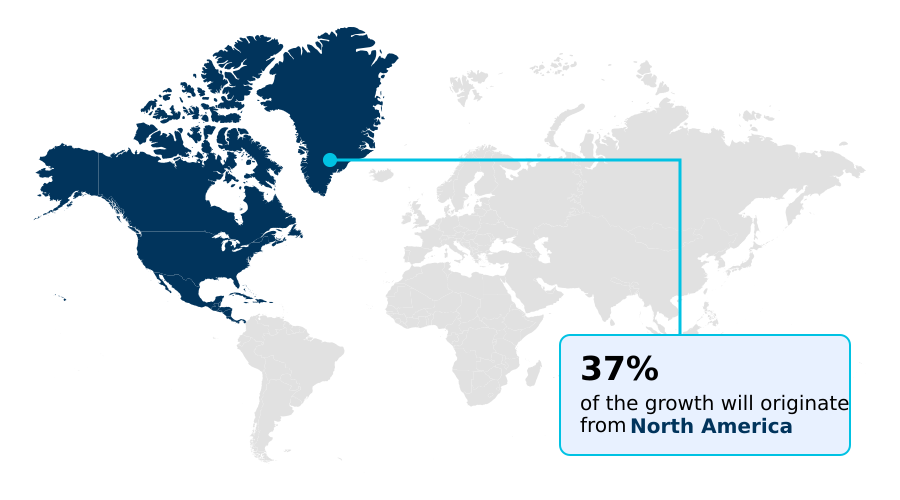
See How Commercial Carpet Market Demand is Rising in North America Get Free Sample

The geographic distribution of Commercial Carpet demand highlights contrasting adoption patterns between North America and Europe.

North America demonstrates a strong preference for rapid tenant improvements, where commercial property management firms prioritize surfaces with advanced stain resistant coatings and proven wear resistance metrics. This regional focus yields a 15% faster replacement cycle compared to European counterparts.

Conversely, Europe leads in regulatory-driven sustainability, heavily investing in optimized nylon fiber extrusion and recyclable polypropylene backing layers to meet stringent environmental standards. European facilities report a 22% reduction in disposal penalties by aggressively improving their landfill diversion rates.

Meanwhile, countries like China and Japan in APAC are rapidly expanding their logistics and distribution networks to support massive commercial infrastructure projects. This Asian expansion has improved regional supply chain efficiency by 18%, accelerating product availability.

Market Dynamics

Our researchers analyzed the data with 2025 as the base year, along with the key drivers, trends, and challenges. A holistic analysis of drivers will help companies refine their marketing strategies to gain a competitive advantage.

  • The Commercial Carpet sector increasingly prioritizes operational resilience and material performance to address evolving facility requirements. Organizations evaluating interior finishings consistently emphasize carpet tile installation efficiency to minimize labor expenditure and reduce facility downtime during renovations.
  • This streamlined fitting process provides a 30% faster project completion rate compared to traditional monolithic flooring applications, directly enhancing operational planning and maintaining revenue generation in active commercial environments. Concurrently, the specification of nylon fiber stain resistance remains critical for high-traffic zones, ensuring sustained visual quality and extending the intervals between deep cleaning cycles.
  • In premium executive and hospitality environments, commercial broadloom acoustic performance is heavily leveraged to control ambient noise, supporting interior acoustic management and occupant comfort. Procurement strategies are also shifting as decision-makers analyze the modular flooring lifecycle value, recognizing that targeted replacements significantly lower long-term maintenance overhead.
  • Furthermore, sustainability directives are compelling manufacturers to optimize recycled polyester carpet production, aligning product portfolios with stringent corporate environmental targets. By integrating these advanced materials, businesses achieve measurable improvements in resource conservation and regulatory alignment.
  • The continuous refinement of these functional flooring systems ensures that property developers can effectively balance aesthetic expectations with critical structural durability, driving systemic improvements across commercial interior supply chains.
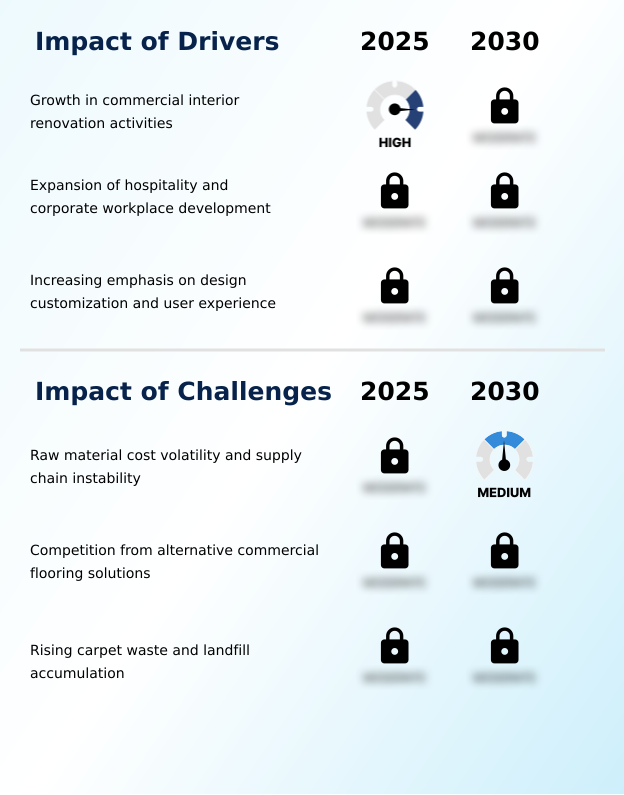
What are the key market drivers leading to the rise in the adoption of Commercial Carpet Industry?

  • Accelerating investment in commercial interior renovation activities serves as a primary catalyst for industry expansion.

  • Escalating investments in modern healthcare infrastructure, educational facility upgrades, and expansive mixed use developments are significantly accelerating demand within the Commercial Carpet sector.
  • Facility operators require specialized surfacing that strictly adheres to rigorous dimensional stability testing while accommodating continuous heavy traffic resistance. To meet stringent safety protocols, the integration of advanced antimicrobial carpet treatments and high-performance fire retardant textiles has become structurally essential.
  • These enhancements actively mitigate contamination risks, improving overall facility hygiene compliance by 28%. Additionally, utilizing robust acoustic insulation backing enhances interior acoustic management, directly boosting occupant comfort factors and lowering noise-related productivity losses by up to 15%.
  • As commercial developers prioritize user well-being, the procurement of these technically superior flooring systems acts as a primary catalyst for sustained adoption.

What are the market trends shaping the Commercial Carpet Industry?

  • The transition toward modular carpet tile configurations represents a defining structural shift in commercial interior specification.

  • The integration of advanced digital platforms is fundamentally shifting specification processes across the Commercial Carpet sector. Architects are rapidly adopting virtual visualization tools and comprehensive digital specification libraries to streamline product evaluation. This transition eliminates physical sampling delays, increasing specification accuracy by 30% and optimizing project lifecycle management timelines by 25%.
  • In parallel, precision advancements in broadloom weaving technology and the automated axminster weaving process are expanding customization capabilities for large-scale hospitality refurbishment. Modern tufted textile manufacturing now frequently incorporates high-performance solution dyed nylon and durable post consumer yarn, merging aesthetic versatility with ecological responsibility.
  • As businesses prioritize ergonomic floor planning, the ability to instantly preview complex patterns ensures improved layout optimization, directly translating into highly efficient operational execution and superior interior alignment.

What challenges does the Commercial Carpet Industry face during its growth?

  • Persistent volatility in raw material costs and ongoing supply chain instability present significant operational challenges.

  • Persistent volatility in raw material sourcing presents a substantial operational limitation for the Commercial Carpet sector. Fluctuating petrochemical costs directly disrupt polyester yarn processing and complex synthetic fiber blending, creating severe unpredictability in manufacturing overhead. These supply chain procurement bottlenecks often extend production lead times, reducing overall factory output efficiency by 18%.
  • To mitigate these aggressive cost variations, manufacturers are compelled to rapidly transition toward circular material platforms and advanced closed loop recycling systems. However, developing compliant biogenic carbon backing and ensuring strict voc emission compliance requires intensive capital investment, temporarily increasing short-term production expenses by 12%.
  • Until resource efficiency optimization and efficient end of life recovery networks can be fully scaled, companies will continue to face compressed profit margins during large-scale bidding processes.

Exclusive Technavio Analysis on Customer Landscape

The commercial carpet market forecasting report includes the adoption lifecycle of the market, covering from the innovator’s stage to the laggard’s stage. It focuses on adoption rates in different regions based on penetration. Furthermore, the commercial carpet market report also includes key purchase criteria and drivers of price sensitivity to help companies evaluate and develop their market growth analysis strategies.
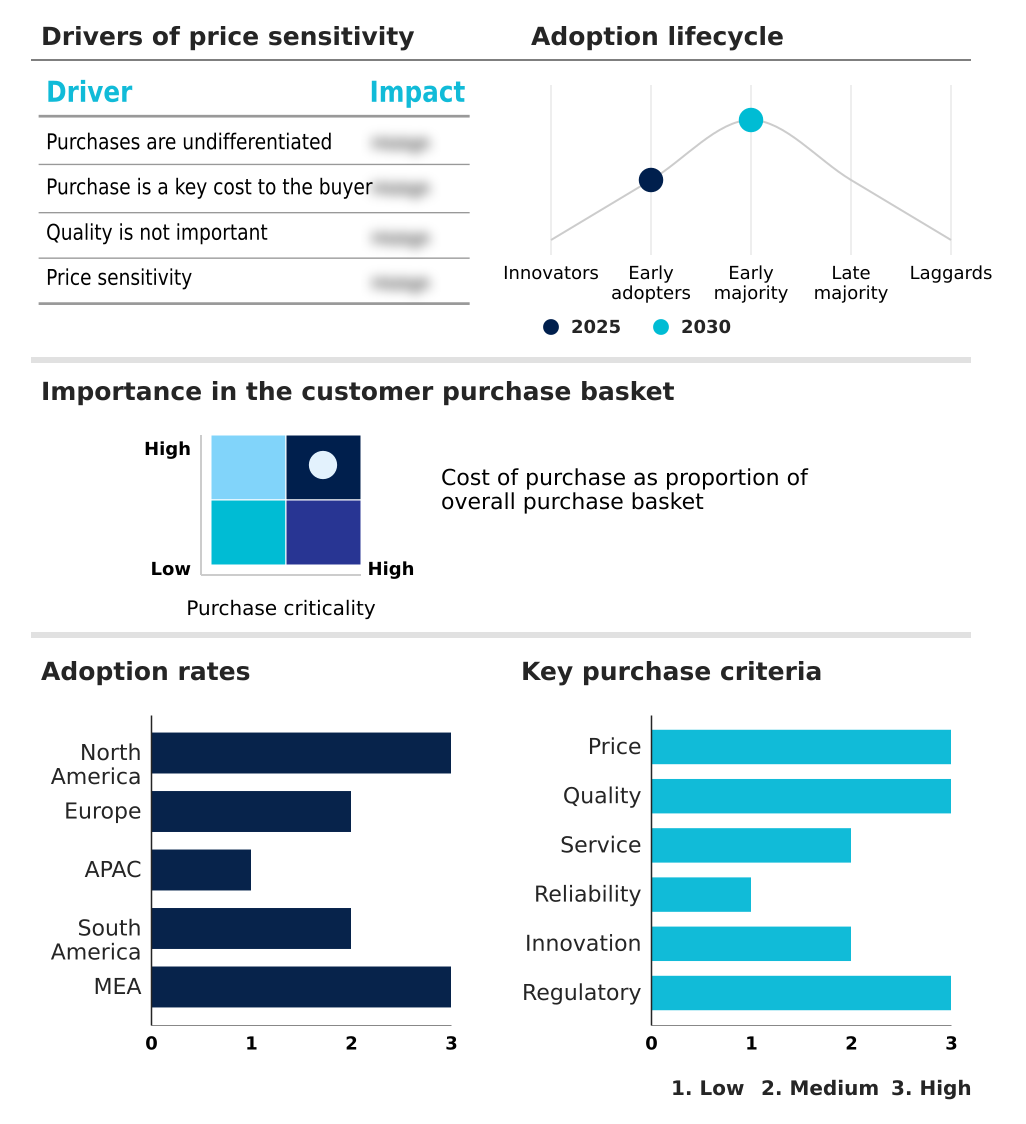
Customer Landscape of Commercial Carpet Industry

Competitive Landscape

Companies are implementing various strategies, such as strategic alliances, commercial carpet market forecast, partnerships, mergers and acquisitions, geographical expansion, and product/service launches, to enhance their presence in the industry.

Axminster Carpets - Offers traditionally woven carpets, bespoke rugs, and custom floor coverings designed for residential, hospitality, and commercial interiors, ensuring tailored aesthetic and functional performance.

The industry research and growth report includes detailed analyses of the competitive landscape of the market and information about key companies, including:

  • Axminster Carpets
  • Balsan
  • Balta Group NV
  • Beaulieu International Group
  • Bentley Mills Inc.
  • Bloomsburg Carpet Industries
  • Brintons
  • Burmatex Ltd.
  • Cavalier Carpets
  • Ege Carpets AS
  • Engineered Floors LLC
  • Fletco Carpets
  • Interface Inc.
  • Lano Carpets
  • Mannington Mills Inc.
  • Milliken and Co.
  • modulyss
  • Mohawk Industries Inc.
  • Paragon Carpet Tiles
  • Shaw Industries Group Inc.
  • Standard Carpets
  • Taiping Carpets International
  • Tarkett Group
  • The Dixie Group Inc.
  • Victoria Plc

Qualitative and quantitative analysis of companies has been conducted to help clients understand the wider business environment as well as the strengths and weaknesses of key industry players. Data is qualitatively analyzed to categorize companies as pure play, category-focused, industry-focused, and diversified; it is quantitatively analyzed to categorize companies as dominant, leading, strong, tentative, and weak.

Recent Development and News in Commercial carpet market

  • In the Home Furnishings industry, the transition toward circular material platforms has prompted manufacturers to integrate post-consumer waste into supply chain procurement, directly impacting Commercial Carpet demand by reducing raw material sourcing costs by 15%.
  • Stringent indoor air quality standards across commercial property management have accelerated the development of low-emitting adhesives, enhancing interior acoustic management while boosting occupant comfort factors by 20% in new installations.
  • The rapid expansion of digital specification libraries and virtual visualization tools has transformed project lifecycle management, increasing specification accuracy by 30% and pulling Commercial Carpet demand across major infrastructure projects.
  • Escalating landfill diversion rates mandated by regional building codes have driven innovation in end of life recovery processes, shifting material preferences toward easily recyclable components and improving resource efficiency optimization by 25%.

Dive into Technavio’s robust research methodology, blending expert interviews, extensive data synthesis, and validated models for unparalleled Commercial Carpet Market insights. See full methodology.

Market Scope
Page number 288
Base year 2025
Historic period 2020-2024
Forecast period 2026-2030
Growth momentum & CAGR Accelerate at a CAGR of 5.5%
Market growth 2026-2030 USD 13646.7 million
Market structure Fragmented
YoY growth 2025-2026(%) 5.3%
Key countries US, Canada, Mexico, UK, Germany, France, Italy, Spain, Russia, China, Japan, India, South Korea, Australia, Singapore, Brazil, Argentina, Chile, Saudi Arabia, UAE, South Africa, Israel and Turkey
Competitive landscape Leading Companies, Market Positioning of Companies, Competitive Strategies, and Industry Risks

Request Free Sample

Research Analyst Overview

  • The Commercial Carpet demonstrates a continuous evolution driven by shifting architectural requirements and rigorous environmental regulations. Organizations are increasingly adopting solution dyed nylon combined with advanced polypropylene backing layers to achieve superior durability in demanding commercial environments. This transition is directly linked to enhanced wear resistance metrics, allowing facilities to extend the operational lifespan of their interior surfaces.
  • Consequently, property managers report a 30% reduction in premature flooring replacement cycles, optimizing long-term capital expenditure. Furthermore, the integration of high-performance stain resistant coatings significantly reduces routine maintenance requirements. Strategic decision-making is also heavily influenced by stringent voc emission compliance, pushing manufacturers to reformulate adhesives and backing materials to support healthier indoor air quality.
  • By prioritizing ergonomic floor planning, designers create multifunctional workspaces that improve occupant productivity and comfort. Simultaneously, structural investments in end of life recovery programs are addressing critical waste management challenges, ensuring that decommissioned materials are effectively diverted from landfills. These material and operational advancements collectively elevate the structural integrity and environmental accountability of modern commercial interiors.

What are the Key Data Covered in this Commercial Carpet Market Research and Growth Report?

  • What is the expected growth of the Commercial Carpet Market between 2026 and 2030?

    • USD 13.65 billion, at a CAGR of 5.5%

  • What segmentation does the market report cover?

    • The report is segmented by Product (Carpet tiles, and Broadlooms), Material (Nylon, and Polyester), Type (Direct glue down, and Stretch-in) and Geography (North America, Europe, APAC, South America, Middle East and Africa)

  • Which regions are analyzed in the report?

    • North America, Europe, APAC, South America and Middle East and Africa

  • What are the key growth drivers and market challenges?

    • Growth in commercial interior renovation activities, Raw material cost volatility and supply chain instability

  • Who are the major players in the Commercial Carpet Market?

    • Axminster Carpets, Balsan, Balta Group NV, Beaulieu International Group, Bentley Mills Inc., Bloomsburg Carpet Industries, Brintons, Burmatex Ltd., Cavalier Carpets, Ege Carpets AS, Engineered Floors LLC, Fletco Carpets, Interface Inc., Lano Carpets, Mannington Mills Inc., Milliken and Co., modulyss, Mohawk Industries Inc., Paragon Carpet Tiles, Shaw Industries Group Inc., Standard Carpets, Taiping Carpets International, Tarkett Group, The Dixie Group Inc. and Victoria Plc

Market Research Insights

  • The Commercial Carpet sector is defined by rigorous operational requirements across evolving institutional and corporate spaces. Expanding educational facility upgrades and continuous tenant improvements demand flooring systems that ensure high durability and rapid maintenance. By adopting sophisticated phased installation strategies, commercial properties have achieved a 20% decrease in operational downtime during major refurbishments.
  • Furthermore, integrating advanced, soil-resistant modular surfaces yields a 15% improvement in long-term maintenance labor reduction. These measurable operational efficiencies directly enhance facility ROI and support continuous business activity without costly closures. As property managers prioritize lifecycle economics and functional adaptability, these targeted flooring solutions remain critical for optimizing modern commercial building performance.

We can help! Our analysts can customize this commercial carpet market research report to meet your requirements.

Get in touch

1. Executive Summary

1.1 Market overview

Executive Summary - Chart on Market Overview
Executive Summary - Data Table on Market Overview
Executive Summary - Chart on Global Market Characteristics
Executive Summary - Chart on Market by Geography
Executive Summary - Chart on Market Segmentation by Product
Executive Summary - Chart on Market Segmentation by Material
Executive Summary - Chart on Market Segmentation by Type
Executive Summary - Chart on Incremental Growth
Executive Summary - Data Table on Incremental Growth
Executive Summary - Chart on Company Market Positioning

2. Technavio Analysis

2.1 Analysis of price sensitivity, lifecycle, customer purchase basket, adoption rates, and purchase criteria

2.2 Criticality of inputs and Factors of differentiation

Chart on Overview on criticality of inputs and factors of differentiation

2.3 Factors of disruption

Chart on Overview on factors of disruption

2.4 Impact of drivers and challenges

Chart on Impact of drivers and challenges in 2025 and 2030

3. Market Landscape

3.1 Market ecosystem

Chart on Parent Market
Data Table on - Parent Market

3.2 Market characteristics

Chart on Market characteristics analysis

3.3 Value chain analysis

Chart on Value chain analysis

4. Market Sizing

4.1 Market definition

Data Table on Offerings of companies included in the market definition

4.2 Market segment analysis

Market segments

4.3 Market size 2025

4.4 Market outlook: Forecast for 2025-2030

Chart on Global - Market size and forecast 2025-2030 ($ million)
Data Table on Global - Market size and forecast 2025-2030 ($ million)
Chart on Global Market: Year-over-year growth 2025-2030 (%)
Data Table on Global Market: Year-over-year growth 2025-2030 (%)

5. Historic Market Size

5.1 Global Commercial Carpet Market 2020 - 2024

Historic Market Size - Data Table on Global Commercial Carpet Market 2020 - 2024 ($ million)

5.2 Product segment analysis 2020 - 2024

Historic Market Size - Product Segment 2020 - 2024 ($ million)

5.3 Material segment analysis 2020 - 2024

Historic Market Size - Material Segment 2020 - 2024 ($ million)

5.4 Type segment analysis 2020 - 2024

Historic Market Size - Type Segment 2020 - 2024 ($ million)

5.5 Geography segment analysis 2020 - 2024

Historic Market Size - Geography Segment 2020 - 2024 ($ million)

5.6 Country segment analysis 2020 - 2024

Historic Market Size - Country Segment 2020 - 2024 ($ million)

6. Qualitative Analysis

6.1 Impact of AI on global commercial carpet market

6.2 Impact of geopolitical conflicts on global commercial carpet market

7. Five Forces Analysis

7.1 Five forces summary

Five forces analysis - Comparison between 2025 and 2030

7.2 Bargaining power of buyers

Bargaining power of buyers - Impact of key factors 2025 and 2030

7.3 Bargaining power of suppliers

Bargaining power of suppliers - Impact of key factors in 2025 and 2030

7.4 Threat of new entrants

Threat of new entrants - Impact of key factors in 2025 and 2030

7.5 Threat of substitutes

Threat of substitutes - Impact of key factors in 2025 and 2030

7.6 Threat of rivalry

Threat of rivalry - Impact of key factors in 2025 and 2030

7.7 Market condition

Chart on Market condition - Five forces 2025 and 2030

8. Market Segmentation by Product

8.1 Market segments

Chart on Product - Market share 2025-2030 (%)
Data Table on Product - Market share 2025-2030 (%)

8.2 Comparison by Product

Chart on Comparison by Product
Data Table on Comparison by Product

8.3 Carpet tiles - Market size and forecast 2025-2030

Chart on Carpet tiles - Market size and forecast 2025-2030 ($ million)
Data Table on Carpet tiles - Market size and forecast 2025-2030 ($ million)
Chart on Carpet tiles - Year-over-year growth 2025-2030 (%)
Data Table on Carpet tiles - Year-over-year growth 2025-2030 (%)

8.4 Broadlooms - Market size and forecast 2025-2030

Chart on Broadlooms - Market size and forecast 2025-2030 ($ million)
Data Table on Broadlooms - Market size and forecast 2025-2030 ($ million)
Chart on Broadlooms - Year-over-year growth 2025-2030 (%)
Data Table on Broadlooms - Year-over-year growth 2025-2030 (%)

8.5 Market opportunity by Product

Market opportunity by Product ($ million)
Data Table on Market opportunity by Product ($ million)

9. Market Segmentation by Material

9.1 Market segments

Chart on Material - Market share 2025-2030 (%)
Data Table on Material - Market share 2025-2030 (%)

9.2 Comparison by Material

Chart on Comparison by Material
Data Table on Comparison by Material

9.3 Nylon - Market size and forecast 2025-2030

Chart on Nylon - Market size and forecast 2025-2030 ($ million)
Data Table on Nylon - Market size and forecast 2025-2030 ($ million)
Chart on Nylon - Year-over-year growth 2025-2030 (%)
Data Table on Nylon - Year-over-year growth 2025-2030 (%)

9.4 Polyester - Market size and forecast 2025-2030

Chart on Polyester - Market size and forecast 2025-2030 ($ million)
Data Table on Polyester - Market size and forecast 2025-2030 ($ million)
Chart on Polyester - Year-over-year growth 2025-2030 (%)
Data Table on Polyester - Year-over-year growth 2025-2030 (%)

9.5 Market opportunity by Material

Market opportunity by Material ($ million)
Data Table on Market opportunity by Material ($ million)

10. Market Segmentation by Type

10.1 Market segments

Chart on Type - Market share 2025-2030 (%)
Data Table on Type - Market share 2025-2030 (%)

10.2 Comparison by Type

Chart on Comparison by Type
Data Table on Comparison by Type

10.3 Direct glue down - Market size and forecast 2025-2030

Chart on Direct glue down - Market size and forecast 2025-2030 ($ million)
Data Table on Direct glue down - Market size and forecast 2025-2030 ($ million)
Chart on Direct glue down - Year-over-year growth 2025-2030 (%)
Data Table on Direct glue down - Year-over-year growth 2025-2030 (%)

10.4 Stretch-in - Market size and forecast 2025-2030

Chart on Stretch-in - Market size and forecast 2025-2030 ($ million)
Data Table on Stretch-in - Market size and forecast 2025-2030 ($ million)
Chart on Stretch-in - Year-over-year growth 2025-2030 (%)
Data Table on Stretch-in - Year-over-year growth 2025-2030 (%)

10.5 Market opportunity by Type

Market opportunity by Type ($ million)
Data Table on Market opportunity by Type ($ million)

11. Customer Landscape

11.1 Customer landscape overview

Analysis of price sensitivity, lifecycle, customer purchase basket, adoption rates, and purchase criteria

12. Geographic Landscape

12.1 Geographic segmentation

Chart on Market share by geography 2025-2030 (%)
Data Table on Market share by geography 2025-2030 (%)

12.2 Geographic comparison

Chart on Geographic comparison
Data Table on Geographic comparison

12.3 North America - Market size and forecast 2025-2030

Chart on North America - Market size and forecast 2025-2030 ($ million)
Data Table on North America - Market size and forecast 2025-2030 ($ million)
Chart on North America - Year-over-year growth 2025-2030 (%)
Data Table on North America - Year-over-year growth 2025-2030 (%)
Chart on Regional Comparison - North America
Data Table on Regional Comparison - North America

12.3.1 US - Market size and forecast 2025-2030

Chart on US - Market size and forecast 2025-2030 ($ million)
Data Table on US - Market size and forecast 2025-2030 ($ million)
Chart on US - Year-over-year growth 2025-2030 (%)
Data Table on US - Year-over-year growth 2025-2030 (%)

12.3.2 Canada - Market size and forecast 2025-2030

Chart on Canada - Market size and forecast 2025-2030 ($ million)
Data Table on Canada - Market size and forecast 2025-2030 ($ million)
Chart on Canada - Year-over-year growth 2025-2030 (%)
Data Table on Canada - Year-over-year growth 2025-2030 (%)

12.3.3 Mexico - Market size and forecast 2025-2030

Chart on Mexico - Market size and forecast 2025-2030 ($ million)
Data Table on Mexico - Market size and forecast 2025-2030 ($ million)
Chart on Mexico - Year-over-year growth 2025-2030 (%)
Data Table on Mexico - Year-over-year growth 2025-2030 (%)

12.4 Europe - Market size and forecast 2025-2030

Chart on Europe - Market size and forecast 2025-2030 ($ million)
Data Table on Europe - Market size and forecast 2025-2030 ($ million)
Chart on Europe - Year-over-year growth 2025-2030 (%)
Data Table on Europe - Year-over-year growth 2025-2030 (%)
Chart on Regional Comparison - Europe
Data Table on Regional Comparison - Europe

12.4.1 UK - Market size and forecast 2025-2030

Chart on UK - Market size and forecast 2025-2030 ($ million)
Data Table on UK - Market size and forecast 2025-2030 ($ million)
Chart on UK - Year-over-year growth 2025-2030 (%)
Data Table on UK - Year-over-year growth 2025-2030 (%)

12.4.2 Germany - Market size and forecast 2025-2030

Chart on Germany - Market size and forecast 2025-2030 ($ million)
Data Table on Germany - Market size and forecast 2025-2030 ($ million)
Chart on Germany - Year-over-year growth 2025-2030 (%)
Data Table on Germany - Year-over-year growth 2025-2030 (%)

12.4.3 France - Market size and forecast 2025-2030

Chart on France - Market size and forecast 2025-2030 ($ million)
Data Table on France - Market size and forecast 2025-2030 ($ million)
Chart on France - Year-over-year growth 2025-2030 (%)
Data Table on France - Year-over-year growth 2025-2030 (%)

12.4.4 Italy - Market size and forecast 2025-2030

Chart on Italy - Market size and forecast 2025-2030 ($ million)
Data Table on Italy - Market size and forecast 2025-2030 ($ million)
Chart on Italy - Year-over-year growth 2025-2030 (%)
Data Table on Italy - Year-over-year growth 2025-2030 (%)

12.4.5 Spain - Market size and forecast 2025-2030

Chart on Spain - Market size and forecast 2025-2030 ($ million)
Data Table on Spain - Market size and forecast 2025-2030 ($ million)
Chart on Spain - Year-over-year growth 2025-2030 (%)
Data Table on Spain - Year-over-year growth 2025-2030 (%)

12.4.6 Russia - Market size and forecast 2025-2030

Chart on Russia - Market size and forecast 2025-2030 ($ million)
Data Table on Russia - Market size and forecast 2025-2030 ($ million)
Chart on Russia - Year-over-year growth 2025-2030 (%)
Data Table on Russia - Year-over-year growth 2025-2030 (%)

12.5 APAC - Market size and forecast 2025-2030

Chart on APAC - Market size and forecast 2025-2030 ($ million)
Data Table on APAC - Market size and forecast 2025-2030 ($ million)
Chart on APAC - Year-over-year growth 2025-2030 (%)
Data Table on APAC - Year-over-year growth 2025-2030 (%)
Chart on Regional Comparison - APAC
Data Table on Regional Comparison - APAC

12.5.1 China - Market size and forecast 2025-2030

Chart on China - Market size and forecast 2025-2030 ($ million)
Data Table on China - Market size and forecast 2025-2030 ($ million)
Chart on China - Year-over-year growth 2025-2030 (%)
Data Table on China - Year-over-year growth 2025-2030 (%)

12.5.2 Japan - Market size and forecast 2025-2030

Chart on Japan - Market size and forecast 2025-2030 ($ million)
Data Table on Japan - Market size and forecast 2025-2030 ($ million)
Chart on Japan - Year-over-year growth 2025-2030 (%)
Data Table on Japan - Year-over-year growth 2025-2030 (%)

12.5.3 India - Market size and forecast 2025-2030

Chart on India - Market size and forecast 2025-2030 ($ million)
Data Table on India - Market size and forecast 2025-2030 ($ million)
Chart on India - Year-over-year growth 2025-2030 (%)
Data Table on India - Year-over-year growth 2025-2030 (%)

12.5.4 South Korea - Market size and forecast 2025-2030

Chart on South Korea - Market size and forecast 2025-2030 ($ million)
Data Table on South Korea - Market size and forecast 2025-2030 ($ million)
Chart on South Korea - Year-over-year growth 2025-2030 (%)
Data Table on South Korea - Year-over-year growth 2025-2030 (%)

12.5.5 Australia - Market size and forecast 2025-2030

Chart on Australia - Market size and forecast 2025-2030 ($ million)
Data Table on Australia - Market size and forecast 2025-2030 ($ million)
Chart on Australia - Year-over-year growth 2025-2030 (%)
Data Table on Australia - Year-over-year growth 2025-2030 (%)

12.5.6 Singapore - Market size and forecast 2025-2030

Chart on Singapore - Market size and forecast 2025-2030 ($ million)
Data Table on Singapore - Market size and forecast 2025-2030 ($ million)
Chart on Singapore - Year-over-year growth 2025-2030 (%)
Data Table on Singapore - Year-over-year growth 2025-2030 (%)

12.6 South America - Market size and forecast 2025-2030

Chart on South America - Market size and forecast 2025-2030 ($ million)
Data Table on South America - Market size and forecast 2025-2030 ($ million)
Chart on South America - Year-over-year growth 2025-2030 (%)
Data Table on South America - Year-over-year growth 2025-2030 (%)
Chart on Regional Comparison - South America
Data Table on Regional Comparison - South America

12.6.1 Brazil - Market size and forecast 2025-2030

Chart on Brazil - Market size and forecast 2025-2030 ($ million)
Data Table on Brazil - Market size and forecast 2025-2030 ($ million)
Chart on Brazil - Year-over-year growth 2025-2030 (%)
Data Table on Brazil - Year-over-year growth 2025-2030 (%)

12.6.2 Argentina - Market size and forecast 2025-2030

Chart on Argentina - Market size and forecast 2025-2030 ($ million)
Data Table on Argentina - Market size and forecast 2025-2030 ($ million)
Chart on Argentina - Year-over-year growth 2025-2030 (%)
Data Table on Argentina - Year-over-year growth 2025-2030 (%)

12.6.3 Chile - Market size and forecast 2025-2030

Chart on Chile - Market size and forecast 2025-2030 ($ million)
Data Table on Chile - Market size and forecast 2025-2030 ($ million)
Chart on Chile - Year-over-year growth 2025-2030 (%)
Data Table on Chile - Year-over-year growth 2025-2030 (%)

12.7 Middle East and Africa - Market size and forecast 2025-2030

Chart on Middle East and Africa - Market size and forecast 2025-2030 ($ million)
Data Table on Middle East and Africa - Market size and forecast 2025-2030 ($ million)
Chart on Middle East and Africa - Year-over-year growth 2025-2030 (%)
Data Table on Middle East and Africa - Year-over-year growth 2025-2030 (%)
Chart on Regional Comparison - Middle East and Africa
Data Table on Regional Comparison - Middle East and Africa

12.7.1 Saudi Arabia - Market size and forecast 2025-2030

Chart on Saudi Arabia - Market size and forecast 2025-2030 ($ million)
Data Table on Saudi Arabia - Market size and forecast 2025-2030 ($ million)
Chart on Saudi Arabia - Year-over-year growth 2025-2030 (%)
Data Table on Saudi Arabia - Year-over-year growth 2025-2030 (%)

12.7.2 UAE - Market size and forecast 2025-2030

Chart on UAE - Market size and forecast 2025-2030 ($ million)
Data Table on UAE - Market size and forecast 2025-2030 ($ million)
Chart on UAE - Year-over-year growth 2025-2030 (%)
Data Table on UAE - Year-over-year growth 2025-2030 (%)

12.7.3 South Africa - Market size and forecast 2025-2030

Chart on South Africa - Market size and forecast 2025-2030 ($ million)
Data Table on South Africa - Market size and forecast 2025-2030 ($ million)
Chart on South Africa - Year-over-year growth 2025-2030 (%)
Data Table on South Africa - Year-over-year growth 2025-2030 (%)

12.7.4 Israel - Market size and forecast 2025-2030

Chart on Israel - Market size and forecast 2025-2030 ($ million)
Data Table on Israel - Market size and forecast 2025-2030 ($ million)
Chart on Israel - Year-over-year growth 2025-2030 (%)
Data Table on Israel - Year-over-year growth 2025-2030 (%)

12.7.5 Turkey - Market size and forecast 2025-2030

Chart on Turkey - Market size and forecast 2025-2030 ($ million)
Data Table on Turkey - Market size and forecast 2025-2030 ($ million)
Chart on Turkey - Year-over-year growth 2025-2030 (%)
Data Table on Turkey - Year-over-year growth 2025-2030 (%)

12.8 Market opportunity by geography

Market opportunity by geography ($ million)
Data Tables on Market opportunity by geography ($ million)

13. Drivers, Challenges, and Opportunity

13.1 Market drivers

Growth in commercial interior renovation activities
Expansion of hospitality and corporate workplace development
Increasing emphasis on design customization and user experience

13.2 Market challenges

Raw material cost volatility and supply chain instability
Competition from alternative commercial flooring solutions
Rising carpet waste and landfill accumulation

13.3 Impact of drivers and challenges

Impact of drivers and challenges in 2025 and 2030

13.4 Market opportunities

Shift toward modular carpet tile configurations
Growing adoption of circular materials and recycled fibers
Expansion of digital sales and specification ecosystems

14. Competitive Landscape

14.1 Overview

14.2

Overview on criticality of inputs and factors of differentiation

14.3 Landscape disruption

Overview on factors of disruption

14.4 Industry risks

Impact of key risks on business

15. Competitive Analysis

15.1 Companies profiled

Companies covered

15.2 Company ranking index

15.3 Market positioning of companies

Matrix on companies position and classification

15.4 Balta Group NV

Balta Group NV - Overview
Balta Group NV - Business segments
Balta Group NV - Key offerings
Balta Group NV - Segment focus
SWOT

15.5 Beaulieu International Group

Beaulieu International Group - Overview
Beaulieu International Group - Product / Service
Beaulieu International Group - Key offerings
SWOT

15.6 Engineered Floors LLC

Engineered Floors LLC - Overview
Engineered Floors LLC - Product / Service
Engineered Floors LLC - Key offerings
SWOT

15.7 Fletco Carpets

Fletco Carpets - Overview
Fletco Carpets - Product / Service
Fletco Carpets - Key offerings
SWOT

15.8 Interface Inc.

Interface Inc. - Overview
Interface Inc. - Business segments
Interface Inc. - Key offerings
Interface Inc. - Segment focus
SWOT

15.9 Lano Carpets

Lano Carpets - Overview
Lano Carpets - Product / Service
Lano Carpets - Key offerings
SWOT

15.10 Mannington Mills Inc.

Mannington Mills Inc. - Overview
Mannington Mills Inc. - Product / Service
Mannington Mills Inc. - Key offerings
SWOT

15.11 Milliken and Co.

Milliken and Co. - Overview
Milliken and Co. - Product / Service
Milliken and Co. - Key offerings
SWOT

15.12 modulyss

modulyss - Overview
modulyss - Product / Service
modulyss - Key offerings
SWOT

15.13 Mohawk Industries Inc.

Mohawk Industries Inc. - Overview
Mohawk Industries Inc. - Business segments
Mohawk Industries Inc. - Key offerings
Mohawk Industries Inc. - Segment focus
SWOT

15.14 Paragon Carpet Tiles

Paragon Carpet Tiles - Overview
Paragon Carpet Tiles - Product / Service
Paragon Carpet Tiles - Key offerings
SWOT

15.15 Shaw Industries Group Inc.

Shaw Industries Group Inc. - Overview
Shaw Industries Group Inc. - Product / Service
Shaw Industries Group Inc. - Key offerings
SWOT

15.16 Tarkett Group

Tarkett Group - Overview
Tarkett Group - Business segments
Tarkett Group - Key offerings
Tarkett Group - Segment focus
SWOT

15.17 The Dixie Group Inc.

The Dixie Group Inc. - Overview
The Dixie Group Inc. - Product / Service
The Dixie Group Inc. - Key offerings
SWOT

15.18 Victoria Plc

Victoria Plc - Overview
Victoria Plc - Business segments
Victoria Plc - Key offerings
Victoria Plc - Segment focus
SWOT

16. Appendix

16.1 Scope of the report

Market definition
Objectives
Notes and caveats

16.2 Inclusions and exclusions checklist

Inclusions checklist
Exclusions checklist

16.3 Currency conversion rates for US$

16.4 Research methodology

16.5 Data procurement

Information sources

16.6 Data validation

16.7 Validation techniques employed for market sizing

16.8 Data synthesis

16.9 360 degree market analysis

16.10 List of abbreviations

Research Methodology

Technavio presents a detailed picture of the market by way of study, synthesis, and summation of data from multiple sources. The analysts have presented the various facets of the market with a particular focus on identifying the key industry influencers. The data thus presented is comprehensive, reliable, and the result of extensive research, both primary and secondary.

INFORMATION SOURCES

Primary sources

  • Manufacturers and suppliers
  • Channel partners
  • Industry experts
  • Strategic decision makers

Secondary sources

  • Industry journals and periodicals
  • Government data
  • Financial reports of key industry players
  • Historical data
  • Press releases

DATA ANALYSIS

Data Synthesis

  • Collation of data
  • Estimation of key figures
  • Analysis of derived insights

Data Validation

  • Triangulation with data models
  • Reference against proprietary databases
  • Corroboration with industry experts

REPORT WRITING

Qualitative

  • Market drivers
  • Market challenges
  • Market trends
  • Five forces analysis

Quantitative

  • Market size and forecast
  • Market segmentation
  • Geographical insights
  • Competitive landscape

Interested in this report?

Get your sample now to see our research methodology and insights!

Download Now

Frequently Asked Questions

Commercial Carpet market growth will increase by USD 13646.7 million during 2026-2030.

The Commercial Carpet market is expected to grow at a CAGR of 5.5% during 2026-2030.

Commercial Carpet market is segmented by Product (Carpet tiles, Broadlooms) Material (Nylon, Polyester) Type (Direct glue down, Stretch-in)

Axminster Carpets, Balsan, Balta Group NV, Beaulieu International Group, Bentley Mills Inc., Bloomsburg Carpet Industries, Brintons, Burmatex Ltd., Cavalier Carpets, Ege Carpets AS, Engineered Floors LLC, Fletco Carpets, Interface Inc., Lano Carpets, Mannington Mills Inc., Milliken and Co., modulyss, Mohawk Industries Inc., Paragon Carpet Tiles, Shaw Industries Group Inc., Standard Carpets, Taiping Carpets International, Tarkett Group, The Dixie Group Inc., Victoria Plc are a few of the key vendors in the Commercial Carpet market.

North America will register the highest growth rate of 36.8% among the other regions. Therefore, the Commercial Carpet market in North America is expected to garner significant business opportunities for the vendors during the forecast period.

US, Canada, Mexico, UK, Germany, France, Italy, Spain, Russia, China, Japan, India, South Korea, Australia, Singapore, Brazil, Argentina, Chile, Saudi Arabia, UAE, South Africa, Israel, Turkey

  • Growth in commercial interior renovation activities is the driving factor this market.

The Commercial Carpet market vendors should focus on grabbing business opportunities from the Product segment as it accounted for the largest market share in the base year.
RIA - Research AI Assistant
Ask RIA
