
Commercial Coffee Bean Grinders Market Analysis, Size, and Forecast 2026-2030: APAC (China, Japan, and India), North America (US, Canada, and Mexico), Europe (Germany, Italy, and UK), South America (Brazil, Argentina, and Chile), Middle East and Africa (Saudi Arabia, UAE, and South Africa), and Rest of World (ROW)

Commercial Coffee Bean Grinders Market Analysis, Size, and Forecast 2026-2030:
APAC (China, Japan, and India), North America (US, Canada, and Mexico), Europe (Germany, Italy, and UK), South America (Brazil, Argentina, and Chile), Middle East and Africa (Saudi Arabia, UAE, and South Africa), and Rest of World (ROW)

Published: Oct 2026 294 Pages SKU: IRTNTR44529

Market Overview at a Glance

$6.49 Mn
Market Opportunity
2.2%
CAGR 2025 - 2030
42.8%
APAC Growth
$29.99 Mn
Commercial electric burr CBG segment 2024

Commercial Coffee Bean Grinders Market Size 2026-2030

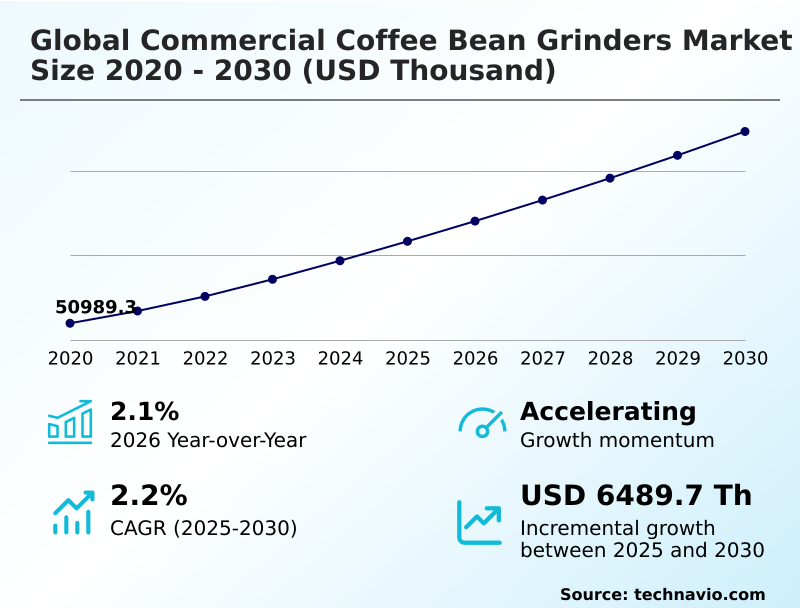
The commercial coffee bean grinders market size is valued to increase by USD 6.49 million, at a CAGR of 2.2% from 2025 to 2030. Expansion of specialty coffee culture driving high precision grinding demand will drive the commercial coffee bean grinders market.

Major Market Trends & Insights

  • APAC dominated the market and accounted for a 42.8% growth during the forecast period.
  • By Product - Commercial electric burr CBG segment was valued at USD 29.99 million in 2024
  • By End-user - Coffee shops segment accounted for the largest market revenue share in 2024

Market Size & Forecast

  • Market Opportunities:
  • Market Future Opportunities: USD 6.49 million
  • CAGR from 2025 to 2030 : 2.2%

Market Summary

  • The Commercial Coffee Bean Grinders Market demonstrates accelerating technological sophistication, driven by the operational mandates of high-volume cafe environments.
  • In complex cafe supply chain integration scenarios, enterprise hospitality brands are upgrading their baseline beverage equipment to include a smart network controller and load cell calibration, which collectively reduce daily coffee bean waste by up to 20% compared to traditional manual dosing methods.
  • This systemic modernization is propelled by the continuous expansion of specialty coffee extraction standards, forcing operators to demand ultra-precise zero-retention grinding chamber designs and absolute beverage flavor consistency. Unpredictable fluctuations in the procurement costs of a high-carbon steel burr and industrial-grade stainless steel heavily strain manufacturer margins, slowing down fleet upgrade cycles for smaller independent operators.
  • Despite these pricing pressures, the shift toward gravimetric dosing and predictive burr wear diagnostic tools establishes a new operational baseline. This transformation fundamentally upgrades barista workflow efficiency, allowing commercial venues to deliver rapid processing speed without compromising the delicate single-origin bean profiling required by modern consumers.

What will be the Size of the Commercial Coffee Bean Grinders Market during the forecast period?
Get Key Insights on Market Forecast (PDF) Get Free Sample

How is the Commercial Coffee Bean Grinders Market Segmented?

The commercial coffee bean grinders industry research report provides comprehensive data (region-wise segment analysis), with forecasts and estimates in "USD thousand" for the period 2026-2030, as well as historical data from 2020-2024 for the following segments.

  • Product
    • Commercial electric burr CBG
    • Commercial electric blade CBG
    • Commercial manual CBG
  • End-user
    • Coffee shops
    • Restaurants
    • Others
  • Distribution channel
    • Offline
    • Online
  • Geography
    • APAC
      • China
      • Japan
      • India
      • South Korea
      • Australia
      • Indonesia
    • North America
      • US
      • Canada
      • Mexico
    • Europe
      • Germany
      • Italy
      • UK
      • France
      • Spain
      • The Netherlands
    • South America
      • Brazil
      • Argentina
      • Chile
    • Middle East and Africa
      • Saudi Arabia
      • UAE
      • South Africa
      • Turkey
      • Israel

By Product Insights

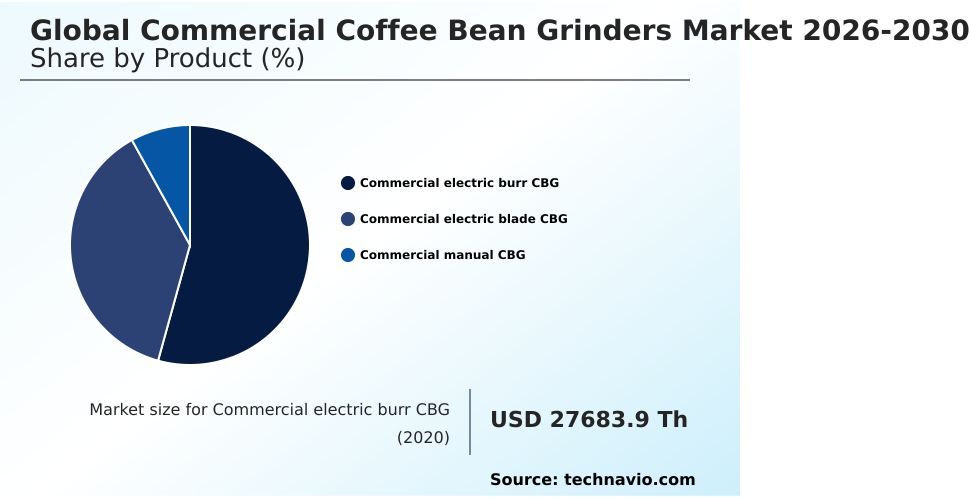
The commercial electric burr cbg segment is estimated to witness significant growth during the forecast period.

The commercial electric burr grinder sub-segment dominates premium hospitality infrastructure by delivering exceptional precision dose accuracy and operational reliability.

Utilizing precision flat burr geometry and titanium-coated burr sets, these advanced systems crush coffee beans into highly uniform particles without generating excessive frictional heat.

Aromatic compound preservation remains critical for specialty coffee extraction, as consistent particle sizing directly dictates water flow resistance and espresso crema formation.

Modern commercial systems increasingly feature active dual-fan cooling and stepless micrometric adjustment mechanisms, allowing operators to achieve a 15% improvement in barista workflow efficiency during peak service hours.

By mitigating heat transfer and utilizing a heavy-duty electric motor, these automated platforms satisfy stringent quality mandates across global high-volume hospitality environments.
Get Free Sample

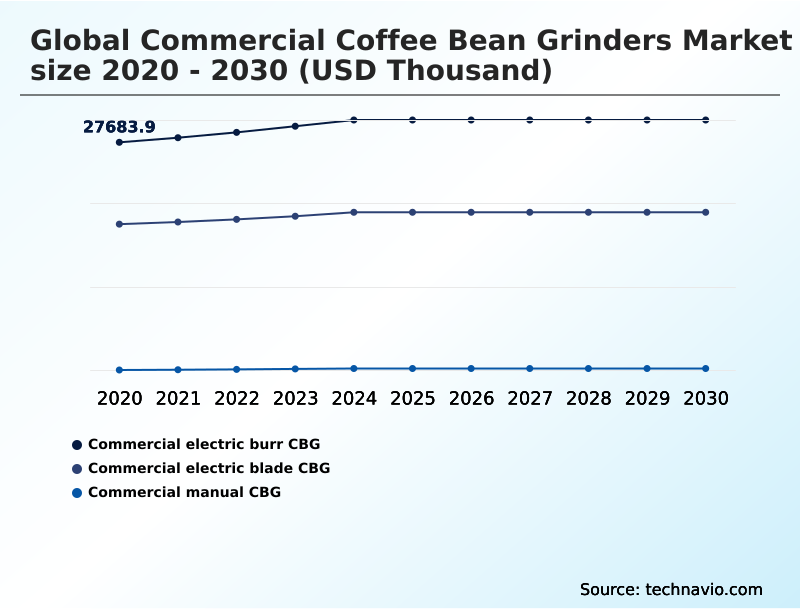
The Commercial electric burr CBG segment was valued at USD 29.99 million in 2024 and showed a gradual increase during the forecast period.
Get Free Sample

Regional Analysis

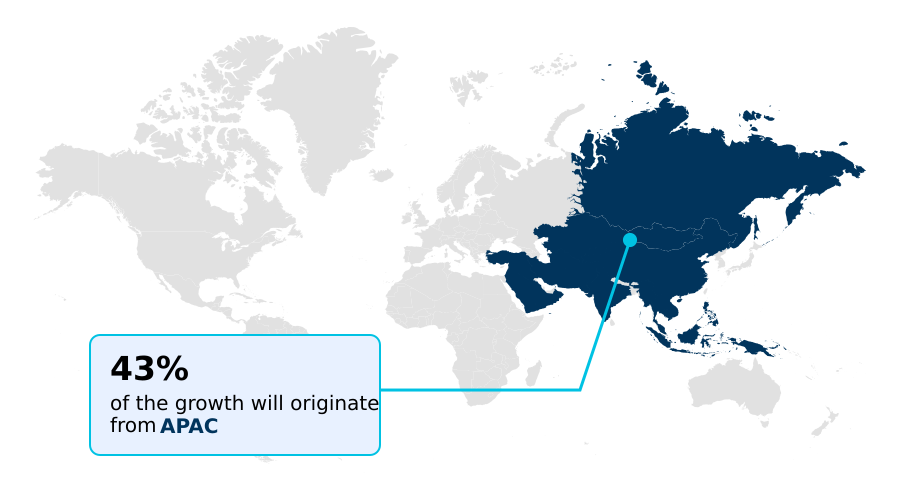
APAC is estimated to contribute 42.8% to the growth of the global market during the forecast period.Technavio’s analysts have elaborately explained the regional trends and drivers that shape the market during the forecast period.
See How Commercial Coffee Bean Grinders Market Demand is Rising in APAC Get Free Sample

The geographic landscape of the Commercial Coffee Bean Grinders Market highlights a distinct divergence in adoption rates and operational priorities between North America and APAC.

North America commands a mature market position where established premium hospitality infrastructure relies heavily on automated electronic dosing control and gravimetric grind-by-weight sensor technologies.

Operators in this region report a 30% improvement in barista workflow efficiency by integrating smart network controller systems.

Conversely, the APAC region is experiencing rapid infrastructure modernization, registering a 42.8% incremental volume share driven by surging investments in automated cafe machinery.

While North American buyers prioritize replacing aging durable capital equipment to maintain beverage flavor consistency, APAC enterprises focus on scalable high-throughput operation solutions to support booming urban cafe expansions.

This regional acceleration in APAC yields a 25% faster adoption rate of stepless micrometric adjustment platforms compared to European markets, optimizing precision dose accuracy across newly established specialty pour-over application venues.

Market Dynamics

Our researchers analyzed the data with 2025 as the base year, along with the key drivers, trends, and challenges. A holistic analysis of drivers will help companies refine their marketing strategies to gain a competitive advantage.

  • The technological evolution within the Commercial Coffee Bean Grinders Market reflects a broader industrial mandate to minimize operational friction and maximize extraction quality. High-volume operators are increasingly transitioning away from timer-based models toward a gravimetric dosing espresso grinder equipment ecosystem, which ensures unparalleled consistency regardless of bean density variations.
  • This shift yields up to a 15% reduction in material waste compared to legacy timed systems, significantly optimizing supply chain cost structures for multi-unit cafe networks.
  • Achieving optimal thermal stability in coffee grinding remains a cornerstone of premium beverage preparation, driving manufacturers to implement active dual-fan cooling mechanisms that protect delicate aromatic profiles and provide essential friction heat reduction during peak service cycles.
  • Furthermore, the integration of an IoT enabled automated coffee grinder allows fleet managers to monitor burr degradation and daily output metrics remotely, effectively transforming reactive repair protocols into proactive maintenance strategies.
  • To support the precise dialing-in required for artisanal roastery workflow environments and bulk drip coffee preparation, the adoption of a stepless micrometric adjustment grinder mechanism provides baristas with infinite control over particle distribution, directly elevating extraction yields. The foundation of this exactness lies in the high precision commercial burr grinder architecture, which minimizes heat transfer and automated batch grinding limitations.
  • By leveraging these intelligent hardware configurations, modern hospitality enterprises can maintain superior quality standards while simultaneously accelerating service velocity.
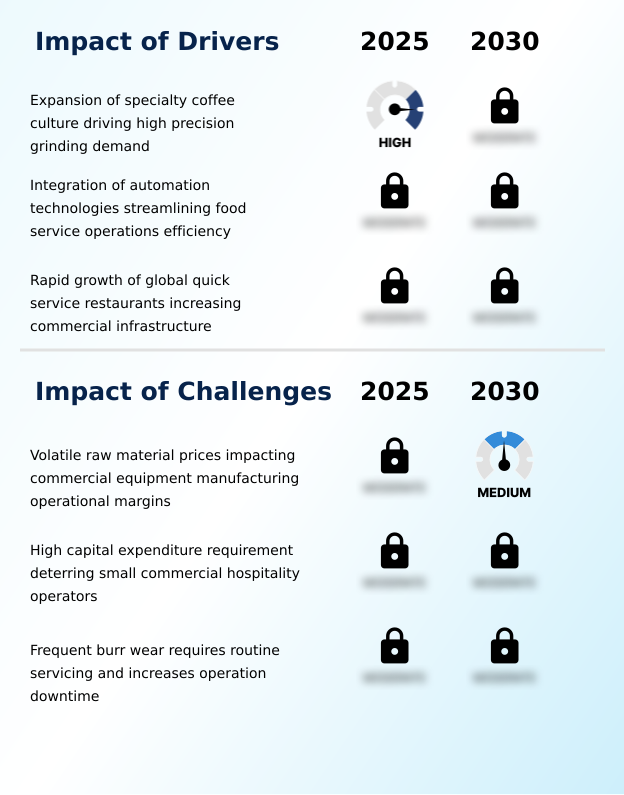
What are the key market drivers leading to the rise in the adoption of Commercial Coffee Bean Grinders Industry?

  • The continuous expansion of specialty coffee culture globally acts as a primary market driver, fueling the demand for high-precision grinding equipment capable of delivering consistent particle distribution.

  • The continuous global expansion of specialty coffee chains acts as a primary catalyst accelerating demand within the Commercial Coffee Bean Grinders Market.
  • As consumer palates mature, premium hospitality infrastructure operators demand exceptional precision dose accuracy to execute complex single-origin bean profiling. This shifting consumer expectation forces commercial establishments to procure high-capacity systems featuring stepless micrometric adjustment and conical burr assembly architectures.
  • By upgrading to gravimetric grind-by-weight sensor technology, enterprise cafes achieve a 22% reduction in material waste while ensuring absolute beverage flavor consistency across different barista skill levels.
  • This behavioral change impacts businesses by streamlining workforce training and delivering rapid processing speed, ultimately driving higher daily transaction volumes and enhancing long-term commercial beverage management profitability.

What are the market trends shaping the Commercial Coffee Bean Grinders Industry?

  • Widespread adoption of grind-by-weight systems is an emerging market trend that significantly enhances portion accuracy. This technological shift optimizes operational workflow and minimizes material waste in high-volume beverage environments.

  • The integration of digital telemetry and active thermal management represents a dominant trend reshaping the Commercial Coffee Bean Grinders Market. High-volume hospitality venues are rapidly adopting IoT telemetry connectivity and temperature-controlled grinding chamber designs to prevent heat-induced flavor degradation during peak service. This technological shift occurs because continuous high-speed grinding generates friction that compromises aromatic compound preservation.
  • By implementing active dual-fan cooling and predictive burr wear diagnostic systems, operators effectively minimize heat transfer and monitor equipment health in real-time. This structural modernization impacts businesses by reducing unexpected equipment failures by up to 20% and improving overall barista workflow efficiency by 15%.
  • Consequently, the deployment of a zero-retention grinding chamber and smart network controller platforms is standardizing specialty coffee extraction across global enterprise operations.

What challenges does the Commercial Coffee Bean Grinders Industry face during its growth?

  • Volatile raw material prices significantly impact the operational margins of commercial equipment manufacturers, presenting a structural challenge that restricts long-term capital equipment procurement capabilities.

  • Unpredictable fluctuations in the procurement costs of essential raw materials present a severe structural barrier within the Commercial Coffee Bean Grinders Market. The manufacturing of precision equipment relies heavily on premium industrial-grade stainless steel and high-carbon steel burr components to ensure long-term durability.
  • When geopolitical tensions and supply chain bottlenecks inflate the cost of aerospace-grade aluminum body materials, equipment manufacturers struggle to maintain stable operational margins. This economic friction forces original equipment manufacturers to either absorb elevated costs or pass them onto price-sensitive independent operators.
  • Consequently, capital-constrained cafes delay upgrading their durable capital equipment, slowing down the adoption of advanced automated electronic dosing control systems and reducing new fleet deployment efficiency by up to 18% in emerging regions.

Exclusive Technavio Analysis on Customer Landscape

The commercial coffee bean grinders market forecasting report includes the adoption lifecycle of the market, covering from the innovator’s stage to the laggard’s stage. It focuses on adoption rates in different regions based on penetration. Furthermore, the commercial coffee bean grinders market report also includes key purchase criteria and drivers of price sensitivity to help companies evaluate and develop their market growth analysis strategies.
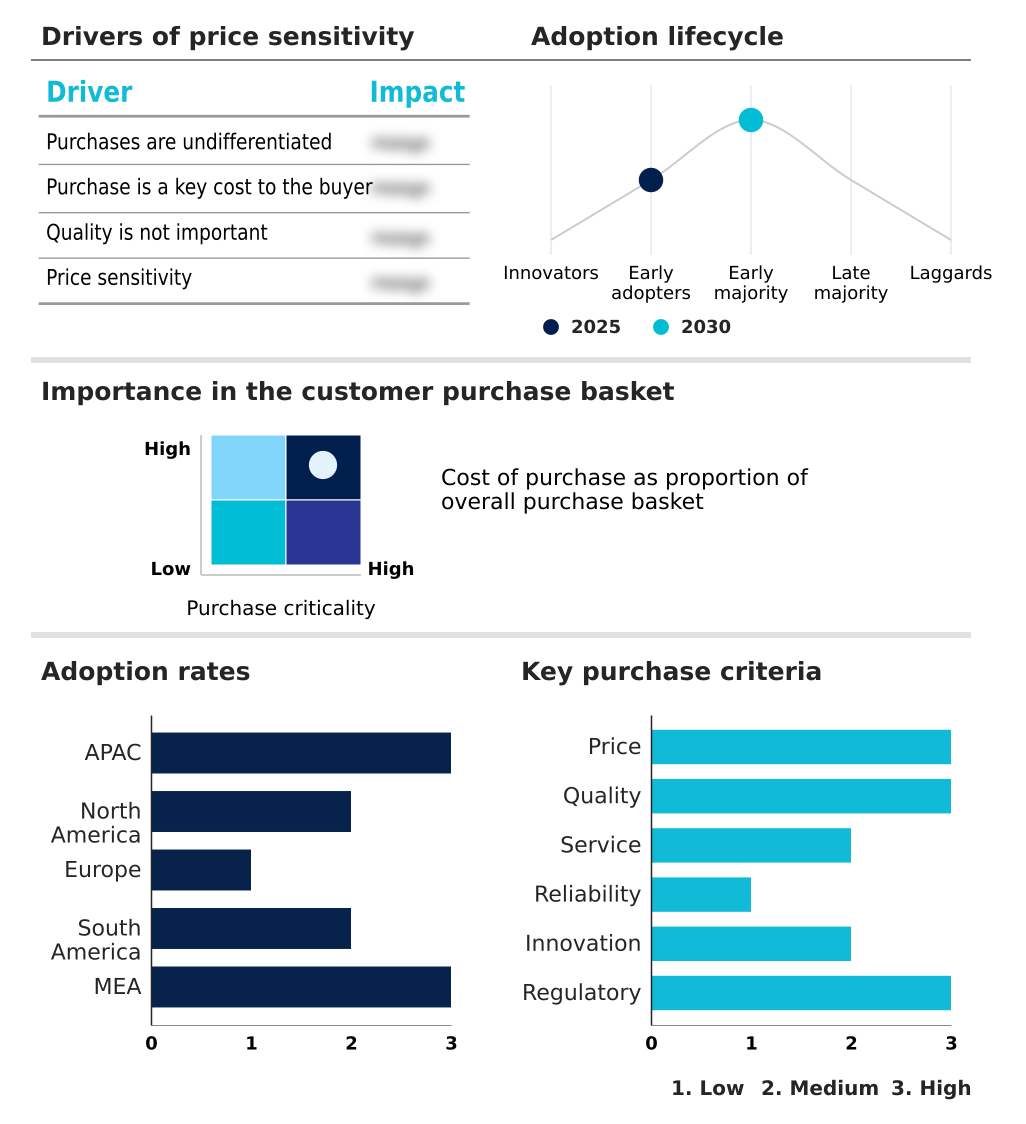
Customer Landscape of Commercial Coffee Bean Grinders Industry

Competitive Landscape

Companies are implementing various strategies, such as strategic alliances, commercial coffee bean grinders market forecast, partnerships, mergers and acquisitions, geographical expansion, and product/service launches, to enhance their presence in the industry.

Ali Group Srl - The unified portfolio provides a comprehensive range of hot and cold beverage vending machines and professional commercial espresso equipment engineered for high-volume hospitality and automated vending environments.

The industry research and growth report includes detailed analyses of the competitive landscape of the market and information about key companies, including:

  • Ali Group Srl
  • Bianchi Industry S.p.A.
  • Bunn O Matic Corp.
  • Ceado Srl
  • Compak Coffee Grinders SA
  • Cunill
  • Electrolux Professional AB
  • Etzinger AG
  • Eureka
  • Fiorenzato M.C. S.r.l.
  • Food Equipment Technologies Co.
  • Groupe SEB
  • Gruppo Cimbali S.p.A.
  • Hemro AG
  • Macap Srl
  • Markibar
  • Ryoma MC S.p.A.
  • Sanremo Coffee Machines Srl
  • SANTOS SAS
  • Simonelli Group Spa

Qualitative and quantitative analysis of companies has been conducted to help clients understand the wider business environment as well as the strengths and weaknesses of key industry players. Data is qualitatively analyzed to categorize companies as pure play, category-focused, industry-focused, and diversified; it is quantitatively analyzed to categorize companies as dominant, leading, strong, tentative, and weak.

Recent Development and News in Commercial coffee bean grinders market

  • In the Household Appliances industry, the rapid integration of smart kitchen integration protocols has enabled remote equipment monitoring, directly impacting Commercial Coffee Bean Grinders demand by driving a 25% increase in automated cafe machinery procurement among enterprise hospitality chains.
  • The widespread adoption of predictive maintenance software across durable capital equipment networks has lowered unexpected mechanical failures by 18%, accelerating the transition toward IoT telemetry connectivity within high-throughput operation environments.
  • Stringent energy efficiency mandates imposed on commercial kitchen procurement have accelerated the development of low-power heavy-duty electric motors, shifting commercial beverage management toward systems that reduce overall energy consumption by 15%.
  • The global supply chain disruption in industrial-grade stainless steel availability has increased manufacturing overheads by 12%, forcing equipment manufacturers to optimize material sourcing strategies for conical burr assembly and aerospace-grade aluminum body components.

Dive into Technavio’s robust research methodology, blending expert interviews, extensive data synthesis, and validated models for unparalleled Commercial Coffee Bean Grinders Market insights. See full methodology.

Market Scope
Page number 294
Base year 2025
Historic period 2020-2024
Forecast period 2026-2030
Growth momentum & CAGR Accelerate at a CAGR of 2.2%
Market growth 2026-2030 USD 6489.7 thousand
Market structure Fragmented
YoY growth 2025-2026(%) 2.1%
Key countries China, Japan, India, South Korea, Australia, Indonesia, US, Canada, Mexico, Germany, Italy, UK, France, Spain, The Netherlands, Brazil, Argentina, Chile, Saudi Arabia, UAE, South Africa, Turkey and Israel
Competitive landscape Leading Companies, Market Positioning of Companies, Competitive Strategies, and Industry Risks

Request Free Sample

Research Analyst Overview

  • The Commercial Coffee Bean Grinders Market is experiencing a structural paradigm shift as enterprise food service operators systematically prioritize consistency, speed, and advanced digital telemetry. Modern high-volume cafe environment configurations heavily depend on direct-drive high-torque motor systems and precision flat burr geometry to handle continuous throughput without mechanical degradation.
  • The strategic integration of a predictive burr wear diagnostic capability enables facility managers to track equipment health remotely, yielding a 25% decrease in unexpected operational stoppages. This transition directly influences boardroom-level capital expenditure strategies, as executives authorize the procurement of advanced aluminum heat sink designs and titanium-coated burr sets to extend hardware longevity.
  • Maintaining absolute particle size distribution variance control ensures consistent specialty coffee extraction and protects delicate aromatic compound preservation. By embedding a digital user interface alongside load cell calibration technology, operators eliminate manual measurement errors and dramatically enhance barista workflow efficiency. These continuous technological enhancements ensure that premium hospitality venues can reliably execute complex beverage programs while optimizing long-term profitability.

What are the Key Data Covered in this Commercial Coffee Bean Grinders Market Research and Growth Report?

  • What is the expected growth of the Commercial Coffee Bean Grinders Market between 2026 and 2030?

    • USD 6.49 million, at a CAGR of 2.2%

  • What segmentation does the market report cover?

    • The report is segmented by Product (Commercial electric burr CBG, Commercial electric blade CBG, and Commercial manual CBG), End-user (Coffee shops, Restaurants, and Others), Distribution Channel (Offline, and Online) and Geography (APAC, North America, Europe, South America, Middle East and Africa)

  • Which regions are analyzed in the report?

    • APAC, North America, Europe, South America and Middle East and Africa

  • What are the key growth drivers and market challenges?

    • Expansion of specialty coffee culture driving high precision grinding demand, Volatile raw material prices impacting commercial equipment manufacturing operational margins

  • Who are the major players in the Commercial Coffee Bean Grinders Market?

    • Ali Group Srl, Bianchi Industry S.p.A., Bunn O Matic Corp., Ceado Srl, Compak Coffee Grinders SA, Cunill, Electrolux Professional AB, Etzinger AG, Eureka, Fiorenzato M.C. S.r.l., Food Equipment Technologies Co., Groupe SEB, Gruppo Cimbali S.p.A., Hemro AG, Macap Srl, Markibar, Ryoma MC S.p.A., Sanremo Coffee Machines Srl, SANTOS SAS and Simonelli Group Spa

Market Research Insights

  • The Commercial Coffee Bean Grinders Market is rapidly transitioning toward digitized commercial beverage management and smart kitchen integration. High-volume cafe environments now utilize automated electronic dosing control and predictive preventative maintenance alerts, achieving a 22% reduction in equipment downtime reduction and a 15% improvement in rapid processing speed.
  • These high-throughput operation platforms utilize advanced sensors to ensure absolute precision dose accuracy, directly mitigating material waste and enhancing operational cost mitigation. As enterprise hospitality chains standardize their commercial kitchen procurement protocols, the widespread deployment of automated cafe machinery streamlines workforce training while guaranteeing consistent beverage flavor consistency across distributed multi-location operations.

We can help! Our analysts can customize this commercial coffee bean grinders market research report to meet your requirements.

Get in touch

1. Executive Summary

1.1 Market overview

Executive Summary - Chart on Market Overview
Executive Summary - Data Table on Market Overview
Executive Summary - Chart on Global Market Characteristics
Executive Summary - Chart on Market by Geography
Executive Summary - Chart on Market Segmentation by Product
Executive Summary - Chart on Market Segmentation by End-user
Executive Summary - Chart on Market Segmentation by Distribution Channel
Executive Summary - Chart on Incremental Growth
Executive Summary - Data Table on Incremental Growth
Executive Summary - Chart on Company Market Positioning

2. Technavio Analysis

2.1 Analysis of price sensitivity, lifecycle, customer purchase basket, adoption rates, and purchase criteria

2.2 Criticality of inputs and Factors of differentiation

Chart on Overview on criticality of inputs and factors of differentiation

2.3 Factors of disruption

Chart on Overview on factors of disruption

2.4 Impact of drivers and challenges

Chart on Impact of drivers and challenges in 2025 and 2030

3. Market Landscape

3.1 Market ecosystem

Chart on Parent Market
Data Table on - Parent Market

3.2 Market characteristics

Chart on Market characteristics analysis

3.3 Value chain analysis

Chart on Value chain analysis

4. Market Sizing

4.1 Market definition

Data Table on Offerings of companies included in the market definition

4.2 Market segment analysis

Market segments

4.3 Market size 2025

4.4 Market outlook: Forecast for 2025-2030

Chart on Global - Market size and forecast 2025-2030 ($ thousand)
Data Table on Global - Market size and forecast 2025-2030 ($ thousand)
Chart on Global Market: Year-over-year growth 2025-2030 (%)
Data Table on Global Market: Year-over-year growth 2025-2030 (%)

5. Historic Market Size

5.1 Global Commercial Coffee Bean Grinders Market 2020 - 2024

Historic Market Size - Data Table on Global Commercial Coffee Bean Grinders Market 2020 - 2024 ($ thousand)

5.2 Product segment analysis 2020 - 2024

Historic Market Size - Product Segment 2020 - 2024 ($ thousand)

5.3 End-user segment analysis 2020 - 2024

Historic Market Size - End-user Segment 2020 - 2024 ($ thousand)

5.4 Distribution Channel segment analysis 2020 - 2024

Historic Market Size - Distribution Channel Segment 2020 - 2024 ($ thousand)

5.5 Geography segment analysis 2020 - 2024

Historic Market Size - Geography Segment 2020 - 2024 ($ thousand)

5.6 Country segment analysis 2020 - 2024

Historic Market Size - Country Segment 2020 - 2024 ($ thousand)

6. Qualitative Analysis

6.1 Impact of AI on global commercial coffee bean grinders market

6.2 Impact of geopolitical conflicts on global commercial coffee bean grinders market

7. Five Forces Analysis

7.1 Five forces summary

Five forces analysis - Comparison between 2025 and 2030

7.2 Bargaining power of buyers

Bargaining power of buyers - Impact of key factors 2025 and 2030

7.3 Bargaining power of suppliers

Bargaining power of suppliers - Impact of key factors in 2025 and 2030

7.4 Threat of new entrants

Threat of new entrants - Impact of key factors in 2025 and 2030

7.5 Threat of substitutes

Threat of substitutes - Impact of key factors in 2025 and 2030

7.6 Threat of rivalry

Threat of rivalry - Impact of key factors in 2025 and 2030

7.7 Market condition

Chart on Market condition - Five forces 2025 and 2030

8. Market Segmentation by Product

8.1 Market segments

Chart on Product - Market share 2025-2030 (%)
Data Table on Product - Market share 2025-2030 (%)

8.2 Comparison by Product

Chart on Comparison by Product
Data Table on Comparison by Product

8.3 Commercial electric burr CBG - Market size and forecast 2025-2030

Chart on Commercial electric burr CBG - Market size and forecast 2025-2030 ($ thousand)
Data Table on Commercial electric burr CBG - Market size and forecast 2025-2030 ($ thousand)
Chart on Commercial electric burr CBG - Year-over-year growth 2025-2030 (%)
Data Table on Commercial electric burr CBG - Year-over-year growth 2025-2030 (%)

8.4 Commercial electric blade CBG - Market size and forecast 2025-2030

Chart on Commercial electric blade CBG - Market size and forecast 2025-2030 ($ thousand)
Data Table on Commercial electric blade CBG - Market size and forecast 2025-2030 ($ thousand)
Chart on Commercial electric blade CBG - Year-over-year growth 2025-2030 (%)
Data Table on Commercial electric blade CBG - Year-over-year growth 2025-2030 (%)

8.5 Commercial manual CBG - Market size and forecast 2025-2030

Chart on Commercial manual CBG - Market size and forecast 2025-2030 ($ thousand)
Data Table on Commercial manual CBG - Market size and forecast 2025-2030 ($ thousand)
Chart on Commercial manual CBG - Year-over-year growth 2025-2030 (%)
Data Table on Commercial manual CBG - Year-over-year growth 2025-2030 (%)

8.6 Market opportunity by Product

Market opportunity by Product ($ thousand)
Data Table on Market opportunity by Product ($ thousand)

9. Market Segmentation by End-user

9.1 Market segments

Chart on End-user - Market share 2025-2030 (%)
Data Table on End-user - Market share 2025-2030 (%)

9.2 Comparison by End-user

Chart on Comparison by End-user
Data Table on Comparison by End-user

9.3 Coffee shops - Market size and forecast 2025-2030

Chart on Coffee shops - Market size and forecast 2025-2030 ($ thousand)
Data Table on Coffee shops - Market size and forecast 2025-2030 ($ thousand)
Chart on Coffee shops - Year-over-year growth 2025-2030 (%)
Data Table on Coffee shops - Year-over-year growth 2025-2030 (%)

9.4 Restaurants - Market size and forecast 2025-2030

Chart on Restaurants - Market size and forecast 2025-2030 ($ thousand)
Data Table on Restaurants - Market size and forecast 2025-2030 ($ thousand)
Chart on Restaurants - Year-over-year growth 2025-2030 (%)
Data Table on Restaurants - Year-over-year growth 2025-2030 (%)

9.5 Others - Market size and forecast 2025-2030

Chart on Others - Market size and forecast 2025-2030 ($ thousand)
Data Table on Others - Market size and forecast 2025-2030 ($ thousand)
Chart on Others - Year-over-year growth 2025-2030 (%)
Data Table on Others - Year-over-year growth 2025-2030 (%)

9.6 Market opportunity by End-user

Market opportunity by End-user ($ thousand)
Data Table on Market opportunity by End-user ($ thousand)

10. Market Segmentation by Distribution Channel

10.1 Market segments

Chart on Distribution Channel - Market share 2025-2030 (%)
Data Table on Distribution Channel - Market share 2025-2030 (%)

10.2 Comparison by Distribution Channel

Chart on Comparison by Distribution Channel
Data Table on Comparison by Distribution Channel

10.3 Offline - Market size and forecast 2025-2030

Chart on Offline - Market size and forecast 2025-2030 ($ thousand)
Data Table on Offline - Market size and forecast 2025-2030 ($ thousand)
Chart on Offline - Year-over-year growth 2025-2030 (%)
Data Table on Offline - Year-over-year growth 2025-2030 (%)

10.4 Online - Market size and forecast 2025-2030

Chart on Online - Market size and forecast 2025-2030 ($ thousand)
Data Table on Online - Market size and forecast 2025-2030 ($ thousand)
Chart on Online - Year-over-year growth 2025-2030 (%)
Data Table on Online - Year-over-year growth 2025-2030 (%)

10.5 Market opportunity by Distribution Channel

Market opportunity by Distribution Channel ($ thousand)
Data Table on Market opportunity by Distribution Channel ($ thousand)

11. Customer Landscape

11.1 Customer landscape overview

Analysis of price sensitivity, lifecycle, customer purchase basket, adoption rates, and purchase criteria

12. Geographic Landscape

12.1 Geographic segmentation

Chart on Market share by geography 2025-2030 (%)
Data Table on Market share by geography 2025-2030 (%)

12.2 Geographic comparison

Chart on Geographic comparison
Data Table on Geographic comparison

12.3 APAC - Market size and forecast 2025-2030

Chart on APAC - Market size and forecast 2025-2030 ($ thousand)
Data Table on APAC - Market size and forecast 2025-2030 ($ thousand)
Chart on APAC - Year-over-year growth 2025-2030 (%)
Data Table on APAC - Year-over-year growth 2025-2030 (%)
Chart on Regional Comparison - APAC
Data Table on Regional Comparison - APAC

12.3.1 China - Market size and forecast 2025-2030

Chart on China - Market size and forecast 2025-2030 ($ thousand)
Data Table on China - Market size and forecast 2025-2030 ($ thousand)
Chart on China - Year-over-year growth 2025-2030 (%)
Data Table on China - Year-over-year growth 2025-2030 (%)

12.3.2 Japan - Market size and forecast 2025-2030

Chart on Japan - Market size and forecast 2025-2030 ($ thousand)
Data Table on Japan - Market size and forecast 2025-2030 ($ thousand)
Chart on Japan - Year-over-year growth 2025-2030 (%)
Data Table on Japan - Year-over-year growth 2025-2030 (%)

12.3.3 India - Market size and forecast 2025-2030

Chart on India - Market size and forecast 2025-2030 ($ thousand)
Data Table on India - Market size and forecast 2025-2030 ($ thousand)
Chart on India - Year-over-year growth 2025-2030 (%)
Data Table on India - Year-over-year growth 2025-2030 (%)

12.3.4 South Korea - Market size and forecast 2025-2030

Chart on South Korea - Market size and forecast 2025-2030 ($ thousand)
Data Table on South Korea - Market size and forecast 2025-2030 ($ thousand)
Chart on South Korea - Year-over-year growth 2025-2030 (%)
Data Table on South Korea - Year-over-year growth 2025-2030 (%)

12.3.5 Australia - Market size and forecast 2025-2030

Chart on Australia - Market size and forecast 2025-2030 ($ thousand)
Data Table on Australia - Market size and forecast 2025-2030 ($ thousand)
Chart on Australia - Year-over-year growth 2025-2030 (%)
Data Table on Australia - Year-over-year growth 2025-2030 (%)

12.3.6 Indonesia - Market size and forecast 2025-2030

Chart on Indonesia - Market size and forecast 2025-2030 ($ thousand)
Data Table on Indonesia - Market size and forecast 2025-2030 ($ thousand)
Chart on Indonesia - Year-over-year growth 2025-2030 (%)
Data Table on Indonesia - Year-over-year growth 2025-2030 (%)

12.4 North America - Market size and forecast 2025-2030

Chart on North America - Market size and forecast 2025-2030 ($ thousand)
Data Table on North America - Market size and forecast 2025-2030 ($ thousand)
Chart on North America - Year-over-year growth 2025-2030 (%)
Data Table on North America - Year-over-year growth 2025-2030 (%)
Chart on Regional Comparison - North America
Data Table on Regional Comparison - North America

12.4.1 US - Market size and forecast 2025-2030

Chart on US - Market size and forecast 2025-2030 ($ thousand)
Data Table on US - Market size and forecast 2025-2030 ($ thousand)
Chart on US - Year-over-year growth 2025-2030 (%)
Data Table on US - Year-over-year growth 2025-2030 (%)

12.4.2 Canada - Market size and forecast 2025-2030

Chart on Canada - Market size and forecast 2025-2030 ($ thousand)
Data Table on Canada - Market size and forecast 2025-2030 ($ thousand)
Chart on Canada - Year-over-year growth 2025-2030 (%)
Data Table on Canada - Year-over-year growth 2025-2030 (%)

12.4.3 Mexico - Market size and forecast 2025-2030

Chart on Mexico - Market size and forecast 2025-2030 ($ thousand)
Data Table on Mexico - Market size and forecast 2025-2030 ($ thousand)
Chart on Mexico - Year-over-year growth 2025-2030 (%)
Data Table on Mexico - Year-over-year growth 2025-2030 (%)

12.5 Europe - Market size and forecast 2025-2030

Chart on Europe - Market size and forecast 2025-2030 ($ thousand)
Data Table on Europe - Market size and forecast 2025-2030 ($ thousand)
Chart on Europe - Year-over-year growth 2025-2030 (%)
Data Table on Europe - Year-over-year growth 2025-2030 (%)
Chart on Regional Comparison - Europe
Data Table on Regional Comparison - Europe

12.5.1 Germany - Market size and forecast 2025-2030

Chart on Germany - Market size and forecast 2025-2030 ($ thousand)
Data Table on Germany - Market size and forecast 2025-2030 ($ thousand)
Chart on Germany - Year-over-year growth 2025-2030 (%)
Data Table on Germany - Year-over-year growth 2025-2030 (%)

12.5.2 Italy - Market size and forecast 2025-2030

Chart on Italy - Market size and forecast 2025-2030 ($ thousand)
Data Table on Italy - Market size and forecast 2025-2030 ($ thousand)
Chart on Italy - Year-over-year growth 2025-2030 (%)
Data Table on Italy - Year-over-year growth 2025-2030 (%)

12.5.3 UK - Market size and forecast 2025-2030

Chart on UK - Market size and forecast 2025-2030 ($ thousand)
Data Table on UK - Market size and forecast 2025-2030 ($ thousand)
Chart on UK - Year-over-year growth 2025-2030 (%)
Data Table on UK - Year-over-year growth 2025-2030 (%)

12.5.4 France - Market size and forecast 2025-2030

Chart on France - Market size and forecast 2025-2030 ($ thousand)
Data Table on France - Market size and forecast 2025-2030 ($ thousand)
Chart on France - Year-over-year growth 2025-2030 (%)
Data Table on France - Year-over-year growth 2025-2030 (%)

12.5.5 Spain - Market size and forecast 2025-2030

Chart on Spain - Market size and forecast 2025-2030 ($ thousand)
Data Table on Spain - Market size and forecast 2025-2030 ($ thousand)
Chart on Spain - Year-over-year growth 2025-2030 (%)
Data Table on Spain - Year-over-year growth 2025-2030 (%)

12.5.6 The Netherlands - Market size and forecast 2025-2030

Chart on The Netherlands - Market size and forecast 2025-2030 ($ thousand)
Data Table on The Netherlands - Market size and forecast 2025-2030 ($ thousand)
Chart on The Netherlands - Year-over-year growth 2025-2030 (%)
Data Table on The Netherlands - Year-over-year growth 2025-2030 (%)

12.6 South America - Market size and forecast 2025-2030

Chart on South America - Market size and forecast 2025-2030 ($ thousand)
Data Table on South America - Market size and forecast 2025-2030 ($ thousand)
Chart on South America - Year-over-year growth 2025-2030 (%)
Data Table on South America - Year-over-year growth 2025-2030 (%)
Chart on Regional Comparison - South America
Data Table on Regional Comparison - South America

12.6.1 Brazil - Market size and forecast 2025-2030

Chart on Brazil - Market size and forecast 2025-2030 ($ thousand)
Data Table on Brazil - Market size and forecast 2025-2030 ($ thousand)
Chart on Brazil - Year-over-year growth 2025-2030 (%)
Data Table on Brazil - Year-over-year growth 2025-2030 (%)

12.6.2 Argentina - Market size and forecast 2025-2030

Chart on Argentina - Market size and forecast 2025-2030 ($ thousand)
Data Table on Argentina - Market size and forecast 2025-2030 ($ thousand)
Chart on Argentina - Year-over-year growth 2025-2030 (%)
Data Table on Argentina - Year-over-year growth 2025-2030 (%)

12.6.3 Chile - Market size and forecast 2025-2030

Chart on Chile - Market size and forecast 2025-2030 ($ thousand)
Data Table on Chile - Market size and forecast 2025-2030 ($ thousand)
Chart on Chile - Year-over-year growth 2025-2030 (%)
Data Table on Chile - Year-over-year growth 2025-2030 (%)

12.7 Middle East and Africa - Market size and forecast 2025-2030

Chart on Middle East and Africa - Market size and forecast 2025-2030 ($ thousand)
Data Table on Middle East and Africa - Market size and forecast 2025-2030 ($ thousand)
Chart on Middle East and Africa - Year-over-year growth 2025-2030 (%)
Data Table on Middle East and Africa - Year-over-year growth 2025-2030 (%)
Chart on Regional Comparison - Middle East and Africa
Data Table on Regional Comparison - Middle East and Africa

12.7.1 Saudi Arabia - Market size and forecast 2025-2030

Chart on Saudi Arabia - Market size and forecast 2025-2030 ($ thousand)
Data Table on Saudi Arabia - Market size and forecast 2025-2030 ($ thousand)
Chart on Saudi Arabia - Year-over-year growth 2025-2030 (%)
Data Table on Saudi Arabia - Year-over-year growth 2025-2030 (%)

12.7.2 UAE - Market size and forecast 2025-2030

Chart on UAE - Market size and forecast 2025-2030 ($ thousand)
Data Table on UAE - Market size and forecast 2025-2030 ($ thousand)
Chart on UAE - Year-over-year growth 2025-2030 (%)
Data Table on UAE - Year-over-year growth 2025-2030 (%)

12.7.3 South Africa - Market size and forecast 2025-2030

Chart on South Africa - Market size and forecast 2025-2030 ($ thousand)
Data Table on South Africa - Market size and forecast 2025-2030 ($ thousand)
Chart on South Africa - Year-over-year growth 2025-2030 (%)
Data Table on South Africa - Year-over-year growth 2025-2030 (%)

12.7.4 Turkey - Market size and forecast 2025-2030

Chart on Turkey - Market size and forecast 2025-2030 ($ thousand)
Data Table on Turkey - Market size and forecast 2025-2030 ($ thousand)
Chart on Turkey - Year-over-year growth 2025-2030 (%)
Data Table on Turkey - Year-over-year growth 2025-2030 (%)

12.7.5 Israel - Market size and forecast 2025-2030

Chart on Israel - Market size and forecast 2025-2030 ($ thousand)
Data Table on Israel - Market size and forecast 2025-2030 ($ thousand)
Chart on Israel - Year-over-year growth 2025-2030 (%)
Data Table on Israel - Year-over-year growth 2025-2030 (%)

12.8 Market opportunity by geography

Market opportunity by geography ($ thousand)
Data Tables on Market opportunity by geography ($ thousand)

13. Drivers, Challenges, and Opportunity

13.1 Market drivers

Expansion of specialty coffee culture driving high precision grinding demand
Integration of automation technologies streamlining food service operations efficiency
Rapid growth of global quick service restaurants increasing commercial infrastructure

13.2 Market challenges

Volatile raw material prices impacting commercial equipment manufacturing operational margins
High capital expenditure requirement deterring small commercial hospitality operators
Frequent burr wear requires routine servicing and increases operation downtime

13.3 Impact of drivers and challenges

Impact of drivers and challenges in 2025 and 2030

13.4 Market opportunities

Widespread adoption of grind by weight systems enhancing portion accuracy
Implementation of advanced thermal management features preserving coffee flavor profiles
Integration of IoT connectivity enhancing predictive equipment maintenance

14. Competitive Landscape

14.1 Overview

14.2

Overview on criticality of inputs and factors of differentiation

14.3 Landscape disruption

Overview on factors of disruption

14.4 Industry risks

Impact of key risks on business

15. Competitive Analysis

15.1 Companies profiled

Companies covered

15.2 Company ranking index

15.3 Market positioning of companies

Matrix on companies position and classification

15.4 Ali Group Srl

Ali Group Srl - Overview
Ali Group Srl - Product / Service
Ali Group Srl - Key offerings
SWOT

15.5 Bianchi Industry S.p.A.

Bianchi Industry S.p.A. - Overview
Bianchi Industry S.p.A. - Product / Service
Bianchi Industry S.p.A. - Key offerings
SWOT

15.6 Bunn O Matic Corp.

Bunn O Matic Corp. - Overview
Bunn O Matic Corp. - Product / Service
Bunn O Matic Corp. - Key offerings
SWOT

15.7 Ceado Srl

Ceado Srl - Overview
Ceado Srl - Product / Service
Ceado Srl - Key offerings
SWOT

15.8 Compak Coffee Grinders SA

Compak Coffee Grinders SA - Overview
Compak Coffee Grinders SA - Product / Service
Compak Coffee Grinders SA - Key offerings
SWOT

15.9 Cunill

Cunill - Overview
Cunill - Product / Service
Cunill - Key offerings
SWOT

15.10 Electrolux Professional AB

Electrolux Professional AB - Overview
Electrolux Professional AB - Business segments
Electrolux Professional AB - Key offerings
Electrolux Professional AB - Segment focus
SWOT

15.11 Fiorenzato M.C. S.r.l.

Fiorenzato M.C. S.r.l. - Overview
Fiorenzato M.C. S.r.l. - Product / Service
Fiorenzato M.C. S.r.l. - Key offerings
SWOT

15.12 Food Equipment Technologies Co.

Food Equipment Technologies Co. - Overview
Food Equipment Technologies Co. - Product / Service
Food Equipment Technologies Co. - Key offerings
SWOT

15.13 Groupe SEB

Groupe SEB - Overview
Groupe SEB - Business segments
Groupe SEB - Key offerings
Groupe SEB - Segment focus
SWOT

15.14 Gruppo Cimbali S.p.A.

Gruppo Cimbali S.p.A. - Overview
Gruppo Cimbali S.p.A. - Product / Service
Gruppo Cimbali S.p.A. - Key offerings
SWOT

15.15 Ryoma MC S.p.A.

Ryoma MC S.p.A. - Overview
Ryoma MC S.p.A. - Product / Service
Ryoma MC S.p.A. - Key offerings
SWOT

15.16 Sanremo Coffee Machines Srl

Sanremo Coffee Machines Srl - Overview
Sanremo Coffee Machines Srl - Product / Service
Sanremo Coffee Machines Srl - Key offerings
SWOT

15.17 SANTOS SAS

SANTOS SAS - Overview
SANTOS SAS - Product / Service
SANTOS SAS - Key offerings
SWOT

15.18 Simonelli Group Spa

Simonelli Group Spa - Overview
Simonelli Group Spa - Product / Service
Simonelli Group Spa - Key offerings
SWOT

16. Appendix

16.1 Scope of the report

Market definition
Objectives
Notes and caveats

16.2 Inclusions and exclusions checklist

Inclusions checklist
Exclusions checklist

16.3 Currency conversion rates for US$

16.4 Research methodology

16.5 Data procurement

Information sources

16.6 Data validation

16.7 Validation techniques employed for market sizing

16.8 Data synthesis

16.9 360 degree market analysis

16.10 List of abbreviations

Research Methodology

Technavio presents a detailed picture of the market by way of study, synthesis, and summation of data from multiple sources. The analysts have presented the various facets of the market with a particular focus on identifying the key industry influencers. The data thus presented is comprehensive, reliable, and the result of extensive research, both primary and secondary.

INFORMATION SOURCES

Primary sources

  • Manufacturers and suppliers
  • Channel partners
  • Industry experts
  • Strategic decision makers

Secondary sources

  • Industry journals and periodicals
  • Government data
  • Financial reports of key industry players
  • Historical data
  • Press releases

DATA ANALYSIS

Data Synthesis

  • Collation of data
  • Estimation of key figures
  • Analysis of derived insights

Data Validation

  • Triangulation with data models
  • Reference against proprietary databases
  • Corroboration with industry experts

REPORT WRITING

Qualitative

  • Market drivers
  • Market challenges
  • Market trends
  • Five forces analysis

Quantitative

  • Market size and forecast
  • Market segmentation
  • Geographical insights
  • Competitive landscape

Interested in this report?

Get your sample now to see our research methodology and insights!

Download Now

Frequently Asked Questions

Commercial Coffee Bean Grinders market growth will increase by USD 6489.7 thousand thousand during 2026-2030.

The Commercial Coffee Bean Grinders market is expected to grow at a CAGR of 2.2% during 2026-2030.

Commercial Coffee Bean Grinders market is segmented by Product (Commercial electric burr CBG, Commercial electric blade CBG, Commercial manual CBG) End-user (Coffee shops, Restaurants, Others) Distribution channel (Offline, Online)

Ali Group Srl, Bianchi Industry S.p.A., Bunn O Matic Corp., Ceado Srl, Compak Coffee Grinders SA, Cunill, Electrolux Professional AB, Etzinger AG, Eureka, Fiorenzato M.C. S.r.l., Food Equipment Technologies Co., Groupe SEB, Gruppo Cimbali S.p.A., Hemro AG, Macap Srl, Markibar, Ryoma MC S.p.A., Sanremo Coffee Machines Srl, SANTOS SAS, Simonelli Group Spa are a few of the key vendors in the Commercial Coffee Bean Grinders market.

APAC will register the highest growth rate of 42.8% among the other regions. Therefore, the Commercial Coffee Bean Grinders market in APAC is expected to garner significant business opportunities for the vendors during the forecast period.

China, Japan, India, South Korea, Australia, Indonesia, US, Canada, Mexico, Germany, Italy, UK, France, Spain, The Netherlands, Brazil, Argentina, Chile, Saudi Arabia, UAE, South Africa, Turkey, Israel

  • Expansion of specialty coffee culture driving high precision grinding demand is the driving factor this market.

The Commercial Coffee Bean Grinders market vendors should focus on grabbing business opportunities from the Product segment as it accounted for the largest market share in the base year.
RIA - Research AI Assistant
Ask RIA
