Commercial Kitchen Equipment Market Analysis, Size, and Forecast 2026-2030: North America (US, Canada, and Mexico), Europe (Germany, UK, and France), APAC (China, Japan, and India), Middle East and Africa (Saudi Arabia, UAE, and South Africa), South America (Brazil, Argentina, and Chile), and Rest of World (ROW)

Commercial Kitchen Equipment Market Analysis, Size, and Forecast 2026-2030:
North America (US, Canada, and Mexico), Europe (Germany, UK, and France), APAC (China, Japan, and India), Middle East and Africa (Saudi Arabia, UAE, and South Africa), South America (Brazil, Argentina, and Chile), and Rest of World (ROW)

Published: Oct 2026 308 Pages SKU: IRTNTR80429

Market Overview at a Glance

$44.53 B
Market Opportunity
7.4%
CAGR 2025 - 2030
33.7%
North America Growth
$24.26 B
Oven segment 2024

Commercial Kitchen Equipment Market Size 2026-2030

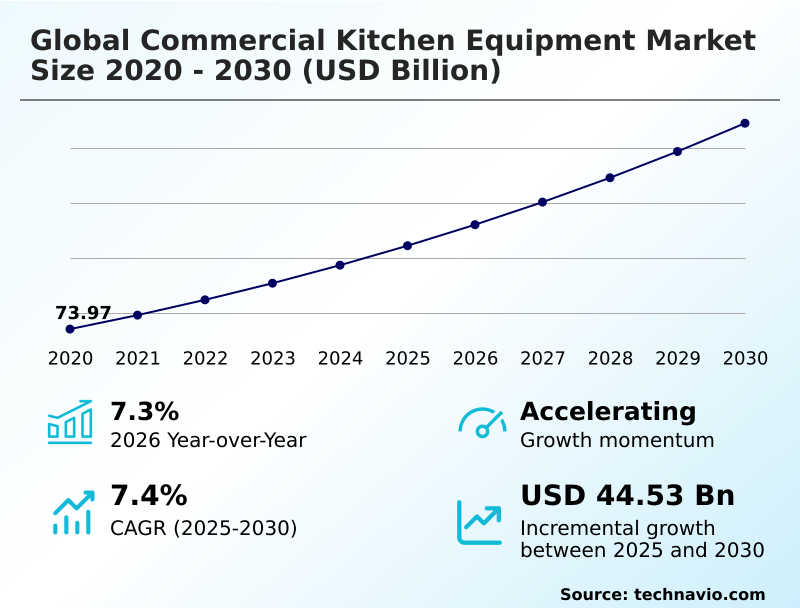
The commercial kitchen equipment market size is valued to increase by USD 44.53 billion, at a CAGR of 7.4% from 2025 to 2030. Expansion of global foodservice outlets and proliferation of quick service restaurants will drive the commercial kitchen equipment market.

Major Market Trends & Insights

  • North America dominated the market and accounted for a 33.7% growth during the forecast period.
  • By Product - Oven segment was valued at USD 24.26 billion in 2024
  • By End-user - Food service segment accounted for the largest market revenue share in 2024

Market Size & Forecast

  • Market Opportunities: USD 74.86 billion
  • Market Future Opportunities: USD 44.53 billion
  • CAGR from 2025 to 2030 : 7.4%

Market Summary

  • The Commercial Kitchen Equipment Market is defined by the rapid adoption of automated, high-efficiency culinary infrastructure tailored for high-volume foodservice operations. Expanding quick-service restaurant networks heavily propel this demand, requiring standardized, modular machinery that guarantees consistent food quality across multi-unit locations.
  • For instance, operators deploying smart interconnected appliances and predictive sensors experience fewer equipment failures, achieving a 20% reduction in unplanned downtime compared to those relying on legacy reactive servicing. This strategic digitization allows enterprise supply chains to streamline spare parts procurement and optimize lifecycle management.
  • However, severe volatility in raw material pricing for industrial-grade stainless steel and electronic components constrains manufacturing capacity, forcing prolonged lead times for critical installations. Navigating these supply chain disruptions remains a formidable challenge for facility planners scaling new locations.
  • Despite these constraints, the transition toward eco-friendly refrigerants and advanced energy recovery systems continues to reshape procurement strategies, ensuring compliance with stringent sustainability mandates while driving long-term operational resilience.

What will be the Size of the Commercial Kitchen Equipment Market during the forecast period?
Get Key Insights on Market Forecast (PDF) Get Free Sample

How is the Commercial Kitchen Equipment Market Segmented?

The commercial kitchen equipment industry research report provides comprehensive data (region-wise segment analysis), with forecasts and estimates in "USD million" for the period 2026-2030, as well as historical data from 2020-2024 for the following segments.

  • Product
    • Oven
    • Refrigerator
    • Dishwasher and dryer
    • Grilling equipment
    • Others
  • End-user
    • Food service
    • Hotels and resorts
    • Institutional kitchens
    • Food and beverage retail
    • Others
  • Distribution channel
    • Offline
    • Online
  • Geography
    • North America
      • US
      • Canada
      • Mexico
    • Europe
      • Germany
      • UK
      • France
      • Italy
      • Spain
      • The Netherlands
    • APAC
      • China
      • Japan
      • India
      • South Korea
      • Australia
      • Indonesia
    • Middle East and Africa
      • Saudi Arabia
      • UAE
      • South Africa
      • Turkey
      • Israel
    • South America
      • Brazil
      • Argentina
      • Chile

By Product Insights

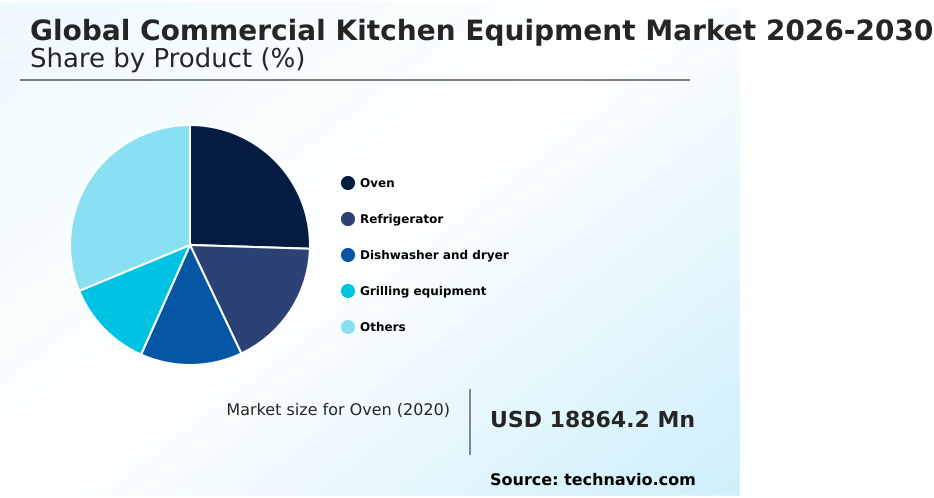
The oven segment is estimated to witness significant growth during the forecast period.

The oven segment represents a foundational element of thermal processing machinery in high-volume culinary operations. Advanced platforms integrating high speed convection and a precise steam injection mechanism are replacing conventional units to accelerate output.

By leveraging humidity control automation, operators achieve consistent product quality while reducing reliance on specialized labor. These systems feature programmable menu configurations that standardize preparation protocols across multi-unit chains.

The shift toward ventless designs enables operational footprint optimization, allowing installations in non-traditional spaces without extensive ductwork. Upgrading to these units improves thermal efficiency metrics by 25%, drastically lowering utility overhead.

This transition supports cross contamination mitigation during rapid preparation cycles, ensuring compliance with strict safety mandates while circumventing cold chain preservation bottlenecks and streamlining perishable inventory management.
Get Free Sample

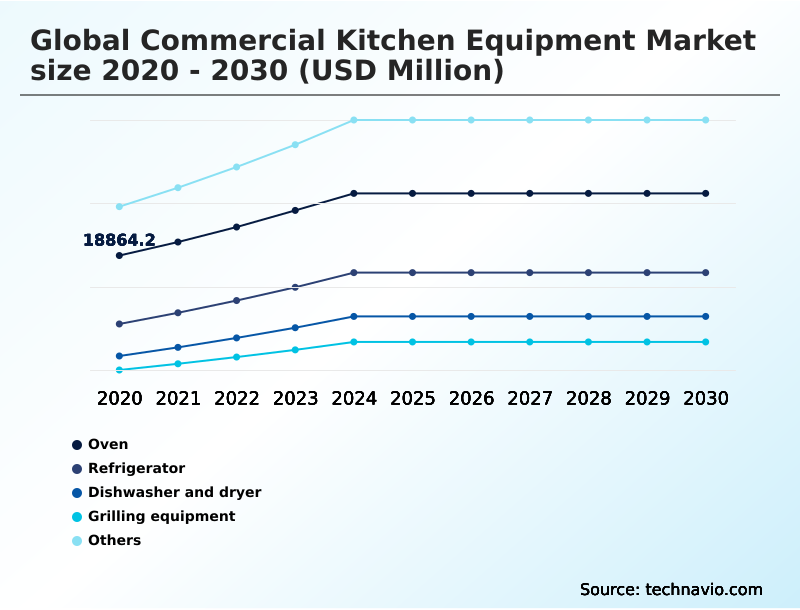
The Oven segment was valued at USD 24.26 billion in 2024 and showed a gradual increase during the forecast period.
Get Free Sample

Regional Analysis

North America is estimated to contribute 33.7% to the growth of the global market during the forecast period.Technavio’s analysts have elaborately explained the regional trends and drivers that shape the market during the forecast period.
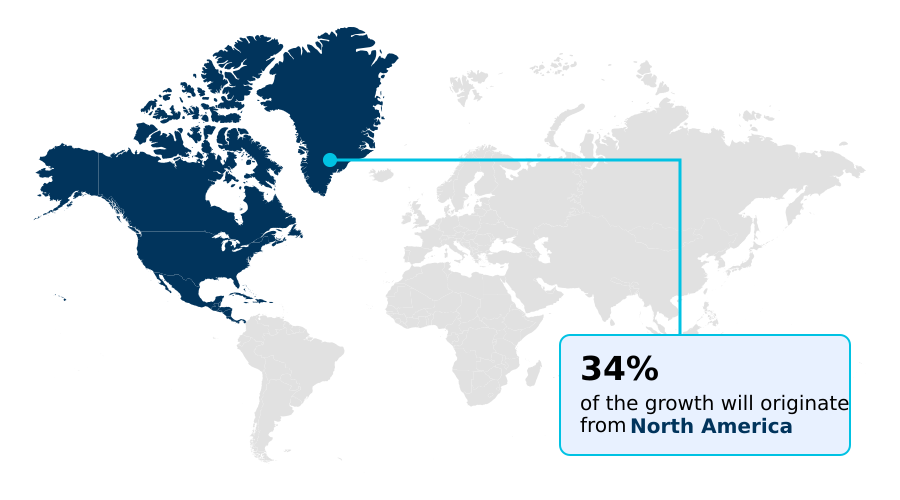
See How Commercial Kitchen Equipment Market Demand is Rising in North America Get Free Sample

The regional dynamics reveal stark contrasts. North American operators, driven by strict mandates, accelerate the hydrofluorocarbon phase out by deploying variable speed compressors and vacuum insulation panels. This alignment drives a 35% improvement in thermal efficiency compared to legacy systems.

Conversely, space constraints in APAC prioritize footprint optimization, resulting in a 40% higher adoption of ventless hood engineering and induction heat retention platforms. These compact systems provide a 20% lifecycle operating reduction, significantly lowering utility overhead.

Additionally, stringent regional sanitation laws compel APAC facilities to integrate antimicrobial surface coatings and water conservation plumbing, cutting resource waste by 15%.

Meanwhile, European chains utilize cloud based performance reporting to monitor these metrics across borders, ensuring unified ambient heat emission reduction targets are met globally.

Market Dynamics

Our researchers analyzed the data with 2025 as the base year, along with the key drivers, trends, and challenges. A holistic analysis of drivers will help companies refine their marketing strategies to gain a competitive advantage.

  • The continuous evolution of culinary infrastructure heavily relies on the strategic implementation of advanced technologies to navigate escalating operational complexities. Modern foodservice facilities increasingly adopt automated thermal holding optimization solutions to ensure precise temperature control, thereby minimizing food waste and maximizing yield during peak service intervals.
  • Simultaneously, urban dining establishments facing severe real estate constraints are rigorously evaluating ventless induction cooking space requirements to maximize front-of-house square footage without compromising back-of-house throughput. This shift allows operators to expand their service capacity by approximately 15% compared to layouts constrained by traditional HVAC exhaust ducting.
  • In the refrigeration sector, stringent environmental compliance mandates necessitate the rapid execution of eco friendly refrigerant transition protocols. Upgrading to natural hydrocarbon systems not only aligns with global sustainability directives but also yields superior thermal stability for critical perishable inventories. Furthermore, facility managers are prioritizing predictive maintenance for thermal machinery to circumvent catastrophic equipment failures.
  • By analyzing real-time performance telemetry, supply chain planners can proactively stage replacement components, dramatically reducing unplanned downtime. Complementing these thermal and diagnostic advancements, the integration of low water consumption warewashing systems addresses both resource scarcity and utility overhead.
  • These sophisticated sanitation platforms recycle thermal energy and optimize rinse cycles, establishing a highly efficient operational framework that directly supports aggressive corporate sustainability targets and enhances overall business resilience.
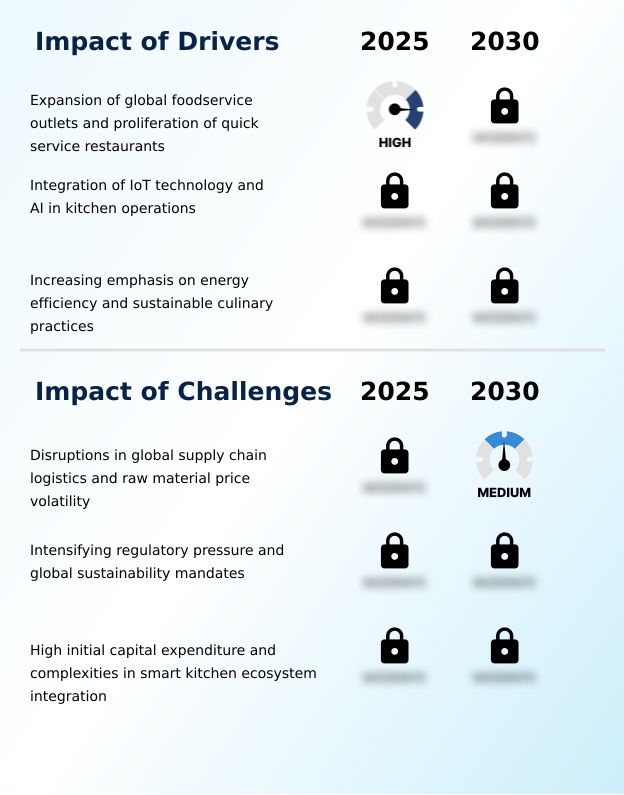
What are the key market drivers leading to the rise in the adoption of Commercial Kitchen Equipment Industry?

  • The accelerated expansion of global foodservice outlets and the rapid proliferation of quick service restaurants serve as the primary drivers propelling demand for high-capacity culinary infrastructure.

  • The critical need to mitigate labor shortages and reduce rising energy overhead acts as a primary catalyst for modernization. Facilities are rapidly adopting centralized cook chill production methods to decouple preparation from peak hours, improving labor utilization by 30%.
  • Simultaneously, the deployment of predictive maintenance sensors and diagnostic alert systems provides real-time telemetry, decreasing catastrophic equipment failure rates by 22%.
  • By utilizing precise infrared burner distribution and zoned heating isolation, kitchens optimize thermal transfer and reduce energy consumption by 15%. The transition to natural hydrocarbon refrigerants alongside robust energy recovery integration further lowers utility expenditures.
  • Additionally, implementing heat recovery wash systems equipped with low water consumption cycles and advanced booster heater calibration drastically reduces active resource waste, directly boosting overall operational profitability.

What are the market trends shaping the Commercial Kitchen Equipment Industry?

  • The technological integration of automation and robotics within high-volume operations functions as a defining trend. This shift significantly enhances processing consistency and operational efficiency across professional culinary environments.

  • A defining trend within professional culinary operations is the aggressive shift toward multi functional combi cooking platforms and rapid rethermalization units. Real estate constraints compel facilities to consolidate their equipment footprint through smart kitchen interoperability. By replacing disparate appliances with centralized systems, operators improve floor space utilization by 25% and reduce meal preparation times by 18%.
  • The integration of rigorous blast chilling protocols alongside ultraviolet sanitation integration further ensures pathogen elimination compliance without interrupting workflows. This directly impacts businesses by minimizing foodborne risks. Furthermore, the deployment of automated beverage dispensing systems accelerates service delivery, boosting peak hour transactions by 20%.
  • To enhance environmental profiles, manufacturers are leveraging recycled component manufacturing and incorporating moisture wicking substrates, fundamentally optimizing sanitation workflow automation while safeguarding product consistency in high-stress environments.

What challenges does the Commercial Kitchen Equipment Industry face during its growth?

  • Disruptions in supply chain logistics and persistent volatility in raw material pricing present critical challenges that constrain manufacturing output and operational planning.

  • The complex integration of advanced ecosystems into aging facility infrastructure presents a formidable structural limitation for operators. High density utility utilization requires robust electrical upgrades to support automated oil filtration and heavy-duty brushless motor drives, as legacy buildings often lack sufficient capacity. This incompatibility forces businesses to incur retrofitting costs 40% higher than standard replacement budgets.
  • Furthermore, implementing sophisticated smoke mitigation exhaust and grease particulate filtration systems demands strict compliance with municipal fire codes, causing permitting delays that extend project timelines by 25%. While demand controlled ventilation and advanced drying mechanisms powered by high velocity air knives offer long-term efficiency, their steep initial capital expenditure deters immediate adoption.
  • These structural hurdles, combined with the difficulty of retrofitting ergonomic layout configurations in confined spaces, critically disrupt expansion planning for enterprise chains.

Exclusive Technavio Analysis on Customer Landscape

The commercial kitchen equipment market forecasting report includes the adoption lifecycle of the market, covering from the innovator’s stage to the laggard’s stage. It focuses on adoption rates in different regions based on penetration. Furthermore, the commercial kitchen equipment market report also includes key purchase criteria and drivers of price sensitivity to help companies evaluate and develop their market growth analysis strategies.
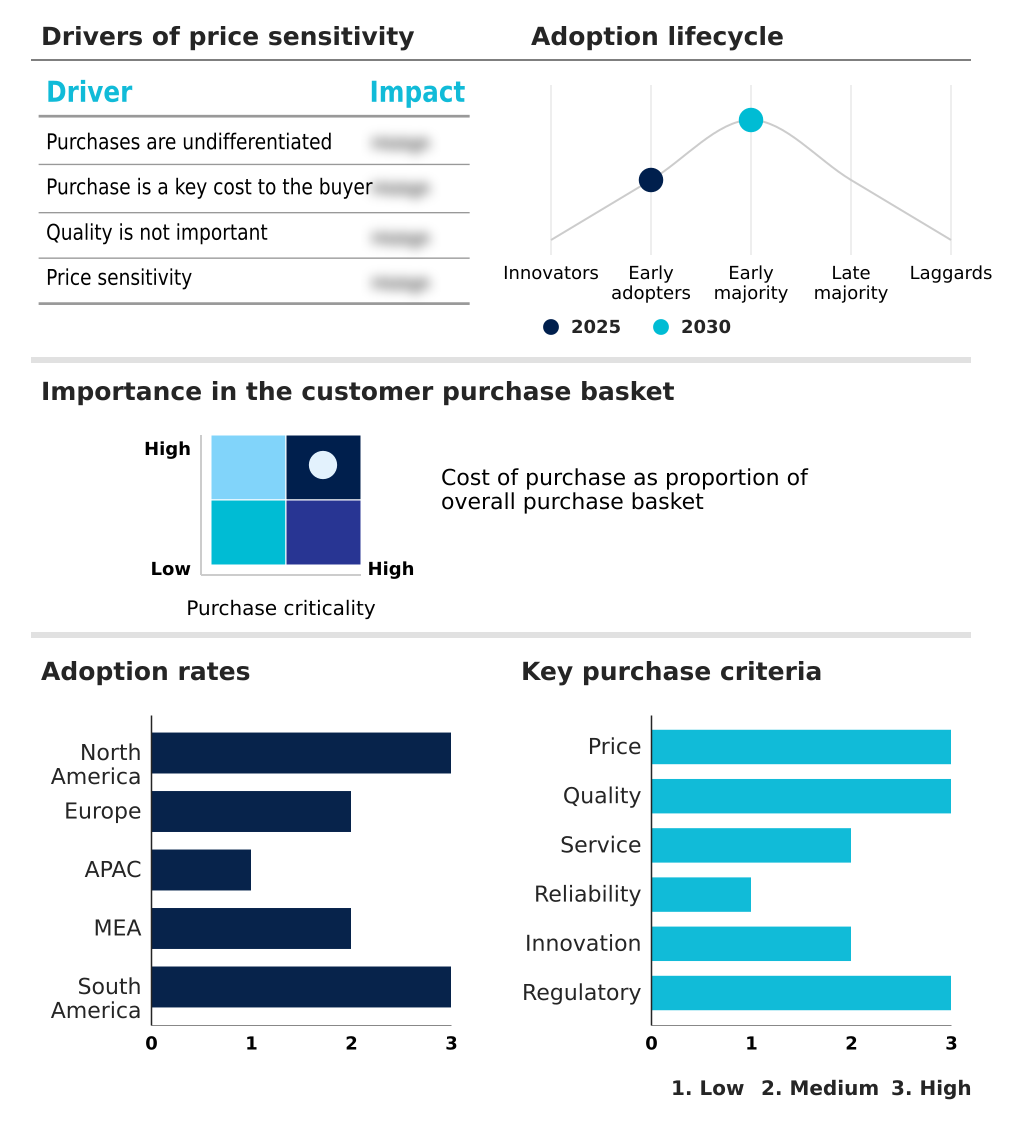
Customer Landscape of Commercial Kitchen Equipment Industry

Competitive Landscape

Companies are implementing various strategies, such as strategic alliances, commercial kitchen equipment market forecast, partnerships, mergers and acquisitions, geographical expansion, and product/service launches, to enhance their presence in the industry.

Alto Shaam Inc. - Advanced thermal processing machinery, including combi ovens and high-capacity boiling pans, delivers superior operational space optimization and energy efficiency for high-volume professional culinary environments.

The industry research and growth report includes detailed analyses of the competitive landscape of the market and information about key companies, including:

  • Alto Shaam Inc.
  • Bizerba SE and Co. KG
  • Cambro Manufacturing Co.
  • Duke Manufacturing
  • Electrolux Professional AB
  • Fagor Industrial S. Coop
  • Hatco Corp.
  • Henny Penny Corp.
  • HOSHIZAKI Corp.
  • Maschinenfabrik GmbH Co. KG
  • Meiko Clean Solutions
  • RATIONAL Group
  • Robot Coupe SNC
  • Sammic SL
  • Sirman Spa
  • The Vollrath Co. LLC
  • True Manufacturing Co. Inc.
  • UNOX S.p.A.
  • Winterhalter Gastronom GmbH

Qualitative and quantitative analysis of companies has been conducted to help clients understand the wider business environment as well as the strengths and weaknesses of key industry players. Data is qualitatively analyzed to categorize companies as pure play, category-focused, industry-focused, and diversified; it is quantitatively analyzed to categorize companies as dominant, leading, strong, tentative, and weak.

Recent Development and News in Commercial kitchen equipment market

  • In the Household Appliances industry, the enforcement of stringent environmental protocols has accelerated the transition to natural hydrocarbon refrigerants, directly impacting Commercial Kitchen Equipment demand by forcing large-scale culinary facilities to replace legacy cold storage units with compliant, low-emission systems.
  • The widespread integration of smart kitchen interoperability architectures in consumer white goods has established new connectivity baselines, compelling Commercial Kitchen Equipment manufacturers to embed diagnostic alert systems that reduce equipment lifecycle costs and minimize unplanned downtime for high-volume operators.
  • Stricter energy recovery integration standards targeting ambient heat emission reduction in heavy-duty appliances have driven the mass adoption of vacuum insulation panels, significantly lowering utility overhead and accelerating the procurement of high-efficiency thermal processing machinery across institutional environments.
  • The rapid advancement of water conservation plumbing technologies designed for residential dishwashers has scaled into commercial applications, allowing Commercial Kitchen Equipment producers to deploy low water consumption cycles and precise booster heater calibration systems that decrease water usage by 30% in high-capacity warewashing.

Dive into Technavio’s robust research methodology, blending expert interviews, extensive data synthesis, and validated models for unparalleled Commercial Kitchen Equipment Market insights. See full methodology.

Market Scope
Page number 308
Base year 2025
Historic period 2020-2024
Forecast period 2026-2030
Growth momentum & CAGR Accelerate at a CAGR of 7.4%
Market growth 2026-2030 USD 44534.2 million
Market structure Fragmented
YoY growth 2025-2026(%) 7.3%
Key countries US, Canada, Mexico, Germany, UK, France, Italy, Spain, The Netherlands, China, Japan, India, South Korea, Australia, Indonesia, Saudi Arabia, UAE, South Africa, Turkey, Israel, Brazil, Argentina and Chile
Competitive landscape Leading Companies, Market Positioning of Companies, Competitive Strategies, and Industry Risks

Request Free Sample

Research Analyst Overview

  • The modernization of high-volume culinary infrastructure fundamentally alters strategic resource planning and capital allocation within the hospitality sector. Boardroom executives are prioritizing the integration of demand controlled ventilation and natural hydrocarbon refrigerants to aggressively align facility operations with stringent corporate sustainability mandates.
  • This strategic transition directly impacts budgetary forecasting, as organizations deploying heat recovery wash systems and low water consumption cycles achieve a 30% reduction in utility overhead compared to those utilizing conventional sanitation platforms.
  • Advanced drying mechanisms, powered by high velocity air knives and durable brushless motor drives, further streamline operations by eliminating manual interventions and ensuring immediate reuse of essential service ware. Furthermore, the implementation of automated oil filtration technology optimizes consumable lifecycle management, mitigating supply chain vulnerabilities associated with cooking oil procurement.
  • These technological upgrades are no longer merely operational enhancements; they are critical compliance and profitability levers. By standardizing high-efficiency infrastructure across multi-unit portfolios, enterprise leadership solidifies long-term operational resilience and maximizes return on invested capital.

What are the Key Data Covered in this Commercial Kitchen Equipment Market Research and Growth Report?

  • What is the expected growth of the Commercial Kitchen Equipment Market between 2026 and 2030?

    • USD 44.53 billion, at a CAGR of 7.4%

  • What segmentation does the market report cover?

    • The report is segmented by Product (Oven, Refrigerator, Dishwasher and dryer, Grilling equipment, and Others), End-user (Food service, Hotels and resorts, Institutional kitchens, Food and beverage retail, and Others), Distribution Channel (Offline, and Online) and Geography (North America, Europe, APAC, Middle East and Africa, South America)

  • Which regions are analyzed in the report?

    • North America, Europe, APAC, Middle East and Africa and South America

  • What are the key growth drivers and market challenges?

    • Expansion of global foodservice outlets and proliferation of quick service restaurants, Disruptions in global supply chain logistics and raw material price volatility

  • Who are the major players in the Commercial Kitchen Equipment Market?

    • Alto Shaam Inc., Bizerba SE and Co. KG, Cambro Manufacturing Co., Duke Manufacturing, Electrolux Professional AB, Fagor Industrial S. Coop, Hatco Corp., Henny Penny Corp., HOSHIZAKI Corp., Maschinenfabrik GmbH Co. KG, Meiko Clean Solutions, RATIONAL Group, Robot Coupe SNC, Sammic SL, Sirman Spa, The Vollrath Co. LLC, True Manufacturing Co. Inc., UNOX S.p.A. and Winterhalter Gastronom GmbH

Market Research Insights

  • The integration of sophisticated machinery within the Commercial Kitchen Equipment Market fundamentally optimizes high-volume culinary operations. Facilities implementing sanitation workflow automation achieve strict pathogen elimination compliance while reducing active water consumption by 28%. Additionally, the deployment of diagnostic alert systems facilitates proactive maintenance scheduling, contributing to a 15% lifecycle operating reduction by mitigating catastrophic equipment failures.
  • This data-driven approach allows operators to reallocate labor resources effectively, improving overall service throughput by 22% during peak intervals. Consequently, the strategic modernization of thermal and refrigeration infrastructure remains critical for maximizing operational efficiency and maintaining rigorous food safety standards in high-demand environments.

We can help! Our analysts can customize this commercial kitchen equipment market research report to meet your requirements.

Get in touch

1. Executive Summary

1.1 Market overview

Executive Summary - Chart on Market Overview
Executive Summary - Data Table on Market Overview
Executive Summary - Chart on Global Market Characteristics
Executive Summary - Chart on Market by Geography
Executive Summary - Chart on Market Segmentation by Product
Executive Summary - Chart on Market Segmentation by End-user
Executive Summary - Chart on Market Segmentation by Distribution Channel
Executive Summary - Chart on Incremental Growth
Executive Summary - Data Table on Incremental Growth
Executive Summary - Chart on Company Market Positioning

2. Technavio Analysis

2.1 Analysis of price sensitivity, lifecycle, customer purchase basket, adoption rates, and purchase criteria

2.2 Criticality of inputs and Factors of differentiation

Chart on Overview on criticality of inputs and factors of differentiation

2.3 Factors of disruption

Chart on Overview on factors of disruption

2.4 Impact of drivers and challenges

Chart on Impact of drivers and challenges in 2025 and 2030

3. Market Landscape

3.1 Market ecosystem

Chart on Parent Market
Data Table on - Parent Market

3.2 Market characteristics

Chart on Market characteristics analysis

3.3 Value chain analysis

Chart on Value chain analysis

4. Market Sizing

4.1 Market definition

Data Table on Offerings of companies included in the market definition

4.2 Market segment analysis

Market segments

4.3 Market size 2025

4.4 Market outlook: Forecast for 2025-2030

Chart on Global - Market size and forecast 2025-2030 ($ million)
Data Table on Global - Market size and forecast 2025-2030 ($ million)
Chart on Global Market: Year-over-year growth 2025-2030 (%)
Data Table on Global Market: Year-over-year growth 2025-2030 (%)

5. Historic Market Size

5.1 Global Commercial Kitchen Equipment Market 2020 - 2024

Historic Market Size - Data Table on Global Commercial Kitchen Equipment Market 2020 - 2024 ($ million)

5.2 Product segment analysis 2020 - 2024

Historic Market Size - Product Segment 2020 - 2024 ($ million)

5.3 End-user segment analysis 2020 - 2024

Historic Market Size - End-user Segment 2020 - 2024 ($ million)

5.4 Distribution Channel segment analysis 2020 - 2024

Historic Market Size - Distribution Channel Segment 2020 - 2024 ($ million)

5.5 Geography segment analysis 2020 - 2024

Historic Market Size - Geography Segment 2020 - 2024 ($ million)

5.6 Country segment analysis 2020 - 2024

Historic Market Size - Country Segment 2020 - 2024 ($ million)

6. Qualitative Analysis

6.1 Impact of AI on Global Commercial Kitchen Equipment Market

6.2 Impact of Geopolitical Conflict on Global Commercial Kitchen Equipment Market

7. Five Forces Analysis

7.1 Five forces summary

Five forces analysis - Comparison between 2025 and 2030

7.2 Bargaining power of buyers

Bargaining power of buyers - Impact of key factors 2025 and 2030

7.3 Bargaining power of suppliers

Bargaining power of suppliers - Impact of key factors in 2025 and 2030

7.4 Threat of new entrants

Threat of new entrants - Impact of key factors in 2025 and 2030

7.5 Threat of substitutes

Threat of substitutes - Impact of key factors in 2025 and 2030

7.6 Threat of rivalry

Threat of rivalry - Impact of key factors in 2025 and 2030

7.7 Market condition

Chart on Market condition - Five forces 2025 and 2030

8. Market Segmentation by Product

8.1 Market segments

Chart on Product - Market share 2025-2030 (%)
Data Table on Product - Market share 2025-2030 (%)

8.2 Comparison by Product

Chart on Comparison by Product
Data Table on Comparison by Product

8.3 Oven - Market size and forecast 2025-2030

Chart on Oven - Market size and forecast 2025-2030 ($ million)
Data Table on Oven - Market size and forecast 2025-2030 ($ million)
Chart on Oven - Year-over-year growth 2025-2030 (%)
Data Table on Oven - Year-over-year growth 2025-2030 (%)

8.4 Refrigerator - Market size and forecast 2025-2030

Chart on Refrigerator - Market size and forecast 2025-2030 ($ million)
Data Table on Refrigerator - Market size and forecast 2025-2030 ($ million)
Chart on Refrigerator - Year-over-year growth 2025-2030 (%)
Data Table on Refrigerator - Year-over-year growth 2025-2030 (%)

8.5 Dishwasher and dryer - Market size and forecast 2025-2030

Chart on Dishwasher and dryer - Market size and forecast 2025-2030 ($ million)
Data Table on Dishwasher and dryer - Market size and forecast 2025-2030 ($ million)
Chart on Dishwasher and dryer - Year-over-year growth 2025-2030 (%)
Data Table on Dishwasher and dryer - Year-over-year growth 2025-2030 (%)

8.6 Grilling equipment - Market size and forecast 2025-2030

Chart on Grilling equipment - Market size and forecast 2025-2030 ($ million)
Data Table on Grilling equipment - Market size and forecast 2025-2030 ($ million)
Chart on Grilling equipment - Year-over-year growth 2025-2030 (%)
Data Table on Grilling equipment - Year-over-year growth 2025-2030 (%)

8.7 Others - Market size and forecast 2025-2030

Chart on Others - Market size and forecast 2025-2030 ($ million)
Data Table on Others - Market size and forecast 2025-2030 ($ million)
Chart on Others - Year-over-year growth 2025-2030 (%)
Data Table on Others - Year-over-year growth 2025-2030 (%)

8.8 Market opportunity by Product

Market opportunity by Product ($ million)
Data Table on Market opportunity by Product ($ million)

9. Market Segmentation by End-user

9.1 Market segments

Chart on End-user - Market share 2025-2030 (%)
Data Table on End-user - Market share 2025-2030 (%)

9.2 Comparison by End-user

Chart on Comparison by End-user
Data Table on Comparison by End-user

9.3 Food service - Market size and forecast 2025-2030

Chart on Food service - Market size and forecast 2025-2030 ($ million)
Data Table on Food service - Market size and forecast 2025-2030 ($ million)
Chart on Food service - Year-over-year growth 2025-2030 (%)
Data Table on Food service - Year-over-year growth 2025-2030 (%)

9.4 Hotels and resorts - Market size and forecast 2025-2030

Chart on Hotels and resorts - Market size and forecast 2025-2030 ($ million)
Data Table on Hotels and resorts - Market size and forecast 2025-2030 ($ million)
Chart on Hotels and resorts - Year-over-year growth 2025-2030 (%)
Data Table on Hotels and resorts - Year-over-year growth 2025-2030 (%)

9.5 Institutional kitchens - Market size and forecast 2025-2030

Chart on Institutional kitchens - Market size and forecast 2025-2030 ($ million)
Data Table on Institutional kitchens - Market size and forecast 2025-2030 ($ million)
Chart on Institutional kitchens - Year-over-year growth 2025-2030 (%)
Data Table on Institutional kitchens - Year-over-year growth 2025-2030 (%)

9.6 Food and beverage retail - Market size and forecast 2025-2030

Chart on Food and beverage retail - Market size and forecast 2025-2030 ($ million)
Data Table on Food and beverage retail - Market size and forecast 2025-2030 ($ million)
Chart on Food and beverage retail - Year-over-year growth 2025-2030 (%)
Data Table on Food and beverage retail - Year-over-year growth 2025-2030 (%)

9.7 Others - Market size and forecast 2025-2030

Chart on Others - Market size and forecast 2025-2030 ($ million)
Data Table on Others - Market size and forecast 2025-2030 ($ million)
Chart on Others - Year-over-year growth 2025-2030 (%)
Data Table on Others - Year-over-year growth 2025-2030 (%)

9.8 Market opportunity by End-user

Market opportunity by End-user ($ million)
Data Table on Market opportunity by End-user ($ million)

10. Market Segmentation by Distribution Channel

10.1 Market segments

Chart on Distribution Channel - Market share 2025-2030 (%)
Data Table on Distribution Channel - Market share 2025-2030 (%)

10.2 Comparison by Distribution Channel

Chart on Comparison by Distribution Channel
Data Table on Comparison by Distribution Channel

10.3 Offline - Market size and forecast 2025-2030

Chart on Offline - Market size and forecast 2025-2030 ($ million)
Data Table on Offline - Market size and forecast 2025-2030 ($ million)
Chart on Offline - Year-over-year growth 2025-2030 (%)
Data Table on Offline - Year-over-year growth 2025-2030 (%)

10.4 Online - Market size and forecast 2025-2030

Chart on Online - Market size and forecast 2025-2030 ($ million)
Data Table on Online - Market size and forecast 2025-2030 ($ million)
Chart on Online - Year-over-year growth 2025-2030 (%)
Data Table on Online - Year-over-year growth 2025-2030 (%)

10.5 Market opportunity by Distribution Channel

Market opportunity by Distribution Channel ($ million)
Data Table on Market opportunity by Distribution Channel ($ million)

11. Customer Landscape

11.1 Customer landscape overview

Analysis of price sensitivity, lifecycle, customer purchase basket, adoption rates, and purchase criteria

12. Geographic Landscape

12.1 Geographic segmentation

Chart on Market share by geography 2025-2030 (%)
Data Table on Market share by geography 2025-2030 (%)

12.2 Geographic comparison

Chart on Geographic comparison
Data Table on Geographic comparison

12.3 North America - Market size and forecast 2025-2030

Chart on North America - Market size and forecast 2025-2030 ($ million)
Data Table on North America - Market size and forecast 2025-2030 ($ million)
Chart on North America - Year-over-year growth 2025-2030 (%)
Data Table on North America - Year-over-year growth 2025-2030 (%)
Chart on Regional Comparison - North America
Data Table on Regional Comparison - North America

12.3.1 US - Market size and forecast 2025-2030

Chart on US - Market size and forecast 2025-2030 ($ million)
Data Table on US - Market size and forecast 2025-2030 ($ million)
Chart on US - Year-over-year growth 2025-2030 (%)
Data Table on US - Year-over-year growth 2025-2030 (%)

12.3.2 Canada - Market size and forecast 2025-2030

Chart on Canada - Market size and forecast 2025-2030 ($ million)
Data Table on Canada - Market size and forecast 2025-2030 ($ million)
Chart on Canada - Year-over-year growth 2025-2030 (%)
Data Table on Canada - Year-over-year growth 2025-2030 (%)

12.3.3 Mexico - Market size and forecast 2025-2030

Chart on Mexico - Market size and forecast 2025-2030 ($ million)
Data Table on Mexico - Market size and forecast 2025-2030 ($ million)
Chart on Mexico - Year-over-year growth 2025-2030 (%)
Data Table on Mexico - Year-over-year growth 2025-2030 (%)

12.4 Europe - Market size and forecast 2025-2030

Chart on Europe - Market size and forecast 2025-2030 ($ million)
Data Table on Europe - Market size and forecast 2025-2030 ($ million)
Chart on Europe - Year-over-year growth 2025-2030 (%)
Data Table on Europe - Year-over-year growth 2025-2030 (%)
Chart on Regional Comparison - Europe
Data Table on Regional Comparison - Europe

12.4.1 Germany - Market size and forecast 2025-2030

Chart on Germany - Market size and forecast 2025-2030 ($ million)
Data Table on Germany - Market size and forecast 2025-2030 ($ million)
Chart on Germany - Year-over-year growth 2025-2030 (%)
Data Table on Germany - Year-over-year growth 2025-2030 (%)

12.4.2 UK - Market size and forecast 2025-2030

Chart on UK - Market size and forecast 2025-2030 ($ million)
Data Table on UK - Market size and forecast 2025-2030 ($ million)
Chart on UK - Year-over-year growth 2025-2030 (%)
Data Table on UK - Year-over-year growth 2025-2030 (%)

12.4.3 France - Market size and forecast 2025-2030

Chart on France - Market size and forecast 2025-2030 ($ million)
Data Table on France - Market size and forecast 2025-2030 ($ million)
Chart on France - Year-over-year growth 2025-2030 (%)
Data Table on France - Year-over-year growth 2025-2030 (%)

12.4.4 Italy - Market size and forecast 2025-2030

Chart on Italy - Market size and forecast 2025-2030 ($ million)
Data Table on Italy - Market size and forecast 2025-2030 ($ million)
Chart on Italy - Year-over-year growth 2025-2030 (%)
Data Table on Italy - Year-over-year growth 2025-2030 (%)

12.4.5 Spain - Market size and forecast 2025-2030

Chart on Spain - Market size and forecast 2025-2030 ($ million)
Data Table on Spain - Market size and forecast 2025-2030 ($ million)
Chart on Spain - Year-over-year growth 2025-2030 (%)
Data Table on Spain - Year-over-year growth 2025-2030 (%)

12.4.6 The Netherlands - Market size and forecast 2025-2030

Chart on The Netherlands - Market size and forecast 2025-2030 ($ million)
Data Table on The Netherlands - Market size and forecast 2025-2030 ($ million)
Chart on The Netherlands - Year-over-year growth 2025-2030 (%)
Data Table on The Netherlands - Year-over-year growth 2025-2030 (%)

12.5 APAC - Market size and forecast 2025-2030

Chart on APAC - Market size and forecast 2025-2030 ($ million)
Data Table on APAC - Market size and forecast 2025-2030 ($ million)
Chart on APAC - Year-over-year growth 2025-2030 (%)
Data Table on APAC - Year-over-year growth 2025-2030 (%)
Chart on Regional Comparison - APAC
Data Table on Regional Comparison - APAC

12.5.1 China - Market size and forecast 2025-2030

Chart on China - Market size and forecast 2025-2030 ($ million)
Data Table on China - Market size and forecast 2025-2030 ($ million)
Chart on China - Year-over-year growth 2025-2030 (%)
Data Table on China - Year-over-year growth 2025-2030 (%)

12.5.2 Japan - Market size and forecast 2025-2030

Chart on Japan - Market size and forecast 2025-2030 ($ million)
Data Table on Japan - Market size and forecast 2025-2030 ($ million)
Chart on Japan - Year-over-year growth 2025-2030 (%)
Data Table on Japan - Year-over-year growth 2025-2030 (%)

12.5.3 India - Market size and forecast 2025-2030

Chart on India - Market size and forecast 2025-2030 ($ million)
Data Table on India - Market size and forecast 2025-2030 ($ million)
Chart on India - Year-over-year growth 2025-2030 (%)
Data Table on India - Year-over-year growth 2025-2030 (%)

12.5.4 South Korea - Market size and forecast 2025-2030

Chart on South Korea - Market size and forecast 2025-2030 ($ million)
Data Table on South Korea - Market size and forecast 2025-2030 ($ million)
Chart on South Korea - Year-over-year growth 2025-2030 (%)
Data Table on South Korea - Year-over-year growth 2025-2030 (%)

12.5.5 Australia - Market size and forecast 2025-2030

Chart on Australia - Market size and forecast 2025-2030 ($ million)
Data Table on Australia - Market size and forecast 2025-2030 ($ million)
Chart on Australia - Year-over-year growth 2025-2030 (%)
Data Table on Australia - Year-over-year growth 2025-2030 (%)

12.5.6 Indonesia - Market size and forecast 2025-2030

Chart on Indonesia - Market size and forecast 2025-2030 ($ million)
Data Table on Indonesia - Market size and forecast 2025-2030 ($ million)
Chart on Indonesia - Year-over-year growth 2025-2030 (%)
Data Table on Indonesia - Year-over-year growth 2025-2030 (%)

12.6 Middle East and Africa - Market size and forecast 2025-2030

Chart on Middle East and Africa - Market size and forecast 2025-2030 ($ million)
Data Table on Middle East and Africa - Market size and forecast 2025-2030 ($ million)
Chart on Middle East and Africa - Year-over-year growth 2025-2030 (%)
Data Table on Middle East and Africa - Year-over-year growth 2025-2030 (%)
Chart on Regional Comparison - Middle East and Africa
Data Table on Regional Comparison - Middle East and Africa

12.6.1 Saudi Arabia - Market size and forecast 2025-2030

Chart on Saudi Arabia - Market size and forecast 2025-2030 ($ million)
Data Table on Saudi Arabia - Market size and forecast 2025-2030 ($ million)
Chart on Saudi Arabia - Year-over-year growth 2025-2030 (%)
Data Table on Saudi Arabia - Year-over-year growth 2025-2030 (%)

12.6.2 UAE - Market size and forecast 2025-2030

Chart on UAE - Market size and forecast 2025-2030 ($ million)
Data Table on UAE - Market size and forecast 2025-2030 ($ million)
Chart on UAE - Year-over-year growth 2025-2030 (%)
Data Table on UAE - Year-over-year growth 2025-2030 (%)

12.6.3 South Africa - Market size and forecast 2025-2030

Chart on South Africa - Market size and forecast 2025-2030 ($ million)
Data Table on South Africa - Market size and forecast 2025-2030 ($ million)
Chart on South Africa - Year-over-year growth 2025-2030 (%)
Data Table on South Africa - Year-over-year growth 2025-2030 (%)

12.6.4 Turkey - Market size and forecast 2025-2030

Chart on Turkey - Market size and forecast 2025-2030 ($ million)
Data Table on Turkey - Market size and forecast 2025-2030 ($ million)
Chart on Turkey - Year-over-year growth 2025-2030 (%)
Data Table on Turkey - Year-over-year growth 2025-2030 (%)

12.6.5 Israel - Market size and forecast 2025-2030

Chart on Israel - Market size and forecast 2025-2030 ($ million)
Data Table on Israel - Market size and forecast 2025-2030 ($ million)
Chart on Israel - Year-over-year growth 2025-2030 (%)
Data Table on Israel - Year-over-year growth 2025-2030 (%)

12.7 South America - Market size and forecast 2025-2030

Chart on South America - Market size and forecast 2025-2030 ($ million)
Data Table on South America - Market size and forecast 2025-2030 ($ million)
Chart on South America - Year-over-year growth 2025-2030 (%)
Data Table on South America - Year-over-year growth 2025-2030 (%)
Chart on Regional Comparison - South America
Data Table on Regional Comparison - South America

12.7.1 Brazil - Market size and forecast 2025-2030

Chart on Brazil - Market size and forecast 2025-2030 ($ million)
Data Table on Brazil - Market size and forecast 2025-2030 ($ million)
Chart on Brazil - Year-over-year growth 2025-2030 (%)
Data Table on Brazil - Year-over-year growth 2025-2030 (%)

12.7.2 Argentina - Market size and forecast 2025-2030

Chart on Argentina - Market size and forecast 2025-2030 ($ million)
Data Table on Argentina - Market size and forecast 2025-2030 ($ million)
Chart on Argentina - Year-over-year growth 2025-2030 (%)
Data Table on Argentina - Year-over-year growth 2025-2030 (%)

12.7.3 Chile - Market size and forecast 2025-2030

Chart on Chile - Market size and forecast 2025-2030 ($ million)
Data Table on Chile - Market size and forecast 2025-2030 ($ million)
Chart on Chile - Year-over-year growth 2025-2030 (%)
Data Table on Chile - Year-over-year growth 2025-2030 (%)

12.8 Market opportunity by geography

Market opportunity by geography ($ million)
Data Tables on Market opportunity by geography ($ million)

13. Drivers, Challenges, and Opportunity

13.1 Market drivers

Expansion of global foodservice outlets and proliferation of quick service restaurants
Integration of IoT technology and AI in kitchen operations
Increasing emphasis on energy efficiency and sustainable culinary practices

13.2 Market challenges

Disruptions in global supply chain logistics and raw material price volatility
Intensifying regulatory pressure and global sustainability mandates
High initial capital expenditure and complexities in smart kitchen ecosystem integration

13.3 Impact of drivers and challenges

Impact of drivers and challenges in 2025 and 2030

13.4 Market opportunities

Technological integration of automation and robotics in high-volume operations
Transition toward circular economy principles and carbon neutral kitchen ecosystems
Growing adoption of space-optimized and multi-functional modular equipment

14. Competitive Landscape

14.1 Overview

14.2

Overview on criticality of inputs and factors of differentiation

14.3 Landscape disruption

Overview on factors of disruption

14.4 Industry risks

Impact of key risks on business

15. Competitive Analysis

15.1 Companies profiled

Companies covered

15.2 Company ranking index

15.3 Market positioning of companies

Matrix on companies position and classification

15.4 Bizerba SE and Co. KG

Bizerba SE and Co. KG - Overview
Bizerba SE and Co. KG - Product / Service
Bizerba SE and Co. KG - Key offerings
SWOT

15.5 Cambro Manufacturing Co.

Cambro Manufacturing Co. - Overview
Cambro Manufacturing Co. - Product / Service
Cambro Manufacturing Co. - Key offerings
SWOT

15.6 Duke Manufacturing

Duke Manufacturing - Overview
Duke Manufacturing - Product / Service
Duke Manufacturing - Key offerings
SWOT

15.7 Electrolux Professional AB

Electrolux Professional AB - Overview
Electrolux Professional AB - Business segments
Electrolux Professional AB - Key offerings
Electrolux Professional AB - Segment focus
SWOT

15.8 Fagor Industrial S. Coop

Fagor Industrial S. Coop - Overview
Fagor Industrial S. Coop - Product / Service
Fagor Industrial S. Coop - Key offerings
SWOT

15.9 Hatco Corp.

Hatco Corp. - Overview
Hatco Corp. - Product / Service
Hatco Corp. - Key offerings
SWOT

15.10 Henny Penny Corp.

Henny Penny Corp. - Overview
Henny Penny Corp. - Product / Service
Henny Penny Corp. - Key offerings
SWOT

15.11 HOSHIZAKI Corp.

HOSHIZAKI Corp. - Overview
HOSHIZAKI Corp. - Business segments
HOSHIZAKI Corp. - Key offerings
HOSHIZAKI Corp. - Segment focus
SWOT

15.12 Meiko Clean Solutions

Meiko Clean Solutions - Overview
Meiko Clean Solutions - Product / Service
Meiko Clean Solutions - Key offerings
SWOT

15.13 RATIONAL Group

RATIONAL Group - Overview
RATIONAL Group - Business segments
RATIONAL Group - Key offerings
RATIONAL Group - Segment focus
SWOT

15.14 Robot Coupe SNC

Robot Coupe SNC - Overview
Robot Coupe SNC - Product / Service
Robot Coupe SNC - Key offerings
SWOT

15.15 The Vollrath Co. LLC

The Vollrath Co. LLC - Overview
The Vollrath Co. LLC - Product / Service
The Vollrath Co. LLC - Key offerings
SWOT

15.16 True Manufacturing Co. Inc.

True Manufacturing Co. Inc. - Overview
True Manufacturing Co. Inc. - Product / Service
True Manufacturing Co. Inc. - Key offerings
SWOT

15.17 UNOX S.p.A.

UNOX S.p.A. - Overview
UNOX S.p.A. - Product / Service
UNOX S.p.A. - Key offerings
SWOT

15.18 Winterhalter Gastronom GmbH

Winterhalter Gastronom GmbH - Overview
Winterhalter Gastronom GmbH - Product / Service
Winterhalter Gastronom GmbH - Key offerings
SWOT

16. Appendix

16.1 Scope of the report

Market definition
Objectives
Notes and caveats

16.2 Inclusions and exclusions checklist

Inclusions checklist
Exclusions checklist

16.3 Currency conversion rates for US$

16.4 Research methodology

16.5 Data procurement

Information sources

16.6 Data validation

16.7 Validation techniques employed for market sizing

16.8 Data synthesis

16.9 360 degree market analysis

16.10 List of abbreviations

Research Methodology

Technavio presents a detailed picture of the market by way of study, synthesis, and summation of data from multiple sources. The analysts have presented the various facets of the market with a particular focus on identifying the key industry influencers. The data thus presented is comprehensive, reliable, and the result of extensive research, both primary and secondary.

INFORMATION SOURCES

Primary sources

  • Manufacturers and suppliers
  • Channel partners
  • Industry experts
  • Strategic decision makers

Secondary sources

  • Industry journals and periodicals
  • Government data
  • Financial reports of key industry players
  • Historical data
  • Press releases

DATA ANALYSIS

Data Synthesis

  • Collation of data
  • Estimation of key figures
  • Analysis of derived insights

Data Validation

  • Triangulation with data models
  • Reference against proprietary databases
  • Corroboration with industry experts

REPORT WRITING

Qualitative

  • Market drivers
  • Market challenges
  • Market trends
  • Five forces analysis

Quantitative

  • Market size and forecast
  • Market segmentation
  • Geographical insights
  • Competitive landscape

Interested in this report?

Get your sample now to see our research methodology and insights!

Download Now

Frequently Asked Questions

Commercial Kitchen Equipment market growth will increase by USD 44534.2 million during 2026-2030.

The Commercial Kitchen Equipment market is expected to grow at a CAGR of 7.4% during 2026-2030.

Commercial Kitchen Equipment market is segmented by Product (Oven, Refrigerator, Dishwasher and dryer, Grilling equipment, Others) End-user (Food service, Hotels and resorts, Institutional kitchens, Food and beverage retail, Others) Distribution channel (Offline, Online)

Alto Shaam Inc., Bizerba SE and Co. KG, Cambro Manufacturing Co., Duke Manufacturing, Electrolux Professional AB, Fagor Industrial S. Coop, Hatco Corp., Henny Penny Corp., HOSHIZAKI Corp., Maschinenfabrik GmbH Co. KG, Meiko Clean Solutions, RATIONAL Group, Robot Coupe SNC, Sammic SL, Sirman Spa, The Vollrath Co. LLC, True Manufacturing Co. Inc., UNOX S.p.A., Winterhalter Gastronom GmbH are a few of the key vendors in the Commercial Kitchen Equipment market.

North America will register the highest growth rate of 33.7% among the other regions. Therefore, the Commercial Kitchen Equipment market in North America is expected to garner significant business opportunities for the vendors during the forecast period.

US, Canada, Mexico, Germany, UK, France, Italy, Spain, The Netherlands, China, Japan, India, South Korea, Australia, Indonesia, Saudi Arabia, UAE, South Africa, Turkey, Israel, Brazil, Argentina, Chile

  • Expansion of global foodservice outlets and proliferation of quick service restaurants is the driving factor this market.

The Commercial Kitchen Equipment market vendors should focus on grabbing business opportunities from the Product segment as it accounted for the largest market share in the base year.
RIA - Research AI Assistant
Ask RIA
