
Condom Market Analysis, Size, and Forecast 2026-2030: APAC (China, India, and Japan), Europe (Germany, UK, and France), North America (US, Canada, and Mexico), Middle East and Africa (South Africa, Turkey, and Saudi Arabia), South America (Brazil, Argentina, and Chile), and Rest of World (ROW)

Condom Market Analysis, Size, and Forecast 2026-2030:
APAC (China, India, and Japan), Europe (Germany, UK, and France), North America (US, Canada, and Mexico), Middle East and Africa (South Africa, Turkey, and Saudi Arabia), South America (Brazil, Argentina, and Chile), and Rest of World (ROW)

Published: Oct 2026 286 Pages SKU: IRTNTR40747

Market Overview at a Glance

$8.33 B
Market Opportunity
11.6%
CAGR 2025 - 2030
42.9%
APAC Growth
$8.69 B
Offline segment 2024

Condom Market Size 2026-2030

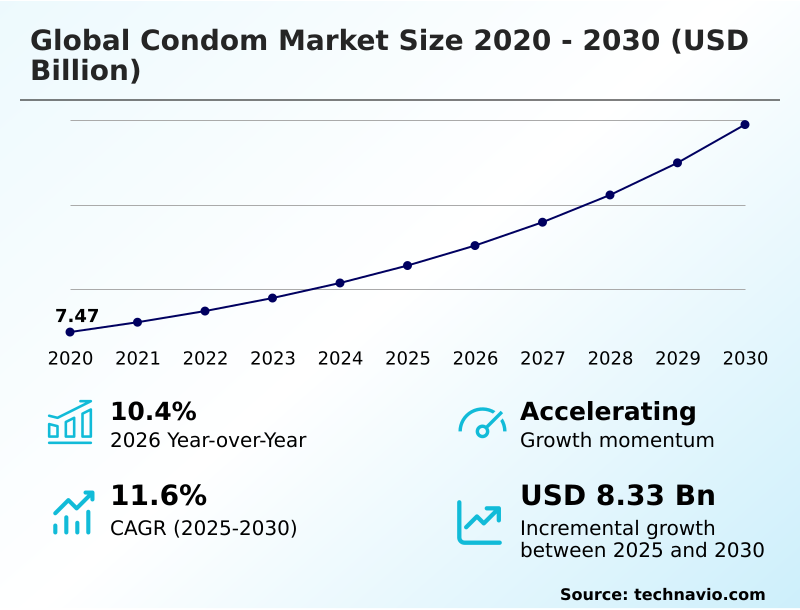
The condom market size is valued to increase by USD 8.33 billion, at a CAGR of 11.6% from 2025 to 2030. Surging global diagnoses of sexually transmitted infections and public health interventions will drive the condom market.

Major Market Trends & Insights

  • APAC dominated the market and accounted for a 42.9% growth during the forecast period.
  • By Distribution Channel - Offline segment was valued at USD 8.69 billion in 2024
  • By Material - Latex segment accounted for the largest market revenue share in 2024

Market Size & Forecast

  • Market Opportunities: USD 12.26 billion
  • Market Future Opportunities: USD 8.33 billion
  • CAGR from 2025 to 2030 : 11.6%

Market Summary

  • The Condom market is experiencing robust demand driven by expanding institutional health initiatives and profound material innovations. Manufacturers operating within the Condom market are increasingly transitioning from traditional rubber toward ultra-thin synthetic polymers to maximize tactile sensitivity and body heat transfer.
  • In a strategic shift to capture wellness-focused consumer segments, dominant corporate entities are aggressively scaling direct-to-consumer digital platforms, which guarantee purchasing privacy and have demonstrably improved automated subscription retention rates by 15%. The surging diagnoses of infectious transmissions act as a primary demand catalyst, forcing health ministries to secure high-volume procurement contracts for community distribution programs.
  • Conversely, intense agricultural disruptions affecting natural rubber yields and rigorous medical compliance testing protocols challenge operational margins, significantly increasing supply chain expenditures. By integrating multi-polymer dipping lines, manufacturing facilities are efficiently mitigating these raw material deficits while securing stable global supply volumes.

What will be the Size of the Condom Market during the forecast period?
Get Key Insights on Market Forecast (PDF) Get Free Sample

How is the Condom Market Segmented?

The condom industry research report provides comprehensive data (region-wise segment analysis), with forecasts and estimates in "USD million" for the period 2026-2030, as well as historical data from 2020-2024 for the following segments.

  • Distribution channel
    • Offline
    • Online
  • Material
    • Latex
    • Non latex
  • Product
    • Male condoms
    • Female condoms
  • Geography
    • APAC
      • China
      • India
      • Japan
      • South Korea
      • Indonesia
      • Australia
    • Europe
      • Germany
      • UK
      • France
      • Italy
      • Spain
      • The Netherlands
    • North America
      • US
      • Canada
      • Mexico
    • Middle East and Africa
      • South Africa
      • Turkey
      • Saudi Arabia
      • UAE
      • Israel
    • South America
      • Brazil
      • Argentina
      • Chile

By Distribution Channel Insights

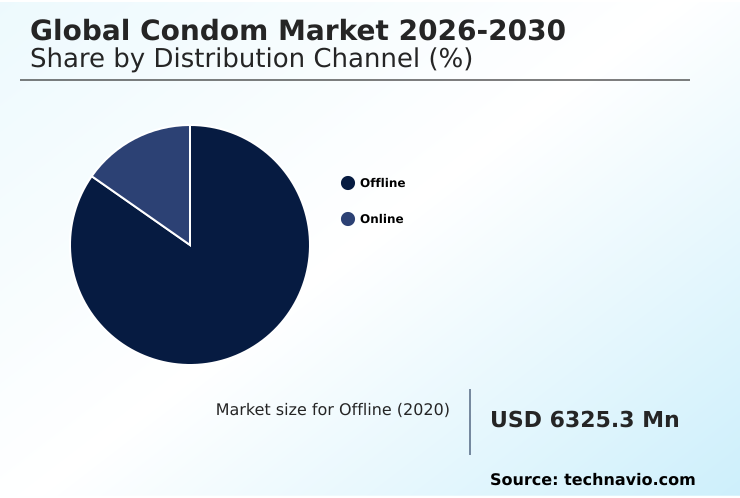
The offline segment is estimated to witness significant growth during the forecast period.

The offline distribution segment of the Condom market serves as the foundational, high-volume retail network governing immediate physical accessibility. Physical storefronts maintain a critical advantage by satisfying urgent consumer demand that alternate platforms utilizing discreet quick-commerce delivery cannot instantly process.

This immediate availability drives a 40% higher impulse purchase rate, directly amplifying retail turnover. Manufacturers leverage this channel to introduce micro-engineered wall thickness designs and anatomical barrier design configurations through prominent point-of-sale displays.

To cater to diverse tactile preferences, physical retail shelves systematically stock sensory-enhanced texture arrays, biological isolation methods, and options featuring high synthetic tactile conductivity alongside superior structural heat transfer.

By utilizing automated inventory tracking, brick-and-mortar operators have improved localized stock replenishment by 15%, ensuring consistent supply continuity for specialized internal vaginal protection and latex hypersensitivity reduction products.
Get Free Sample

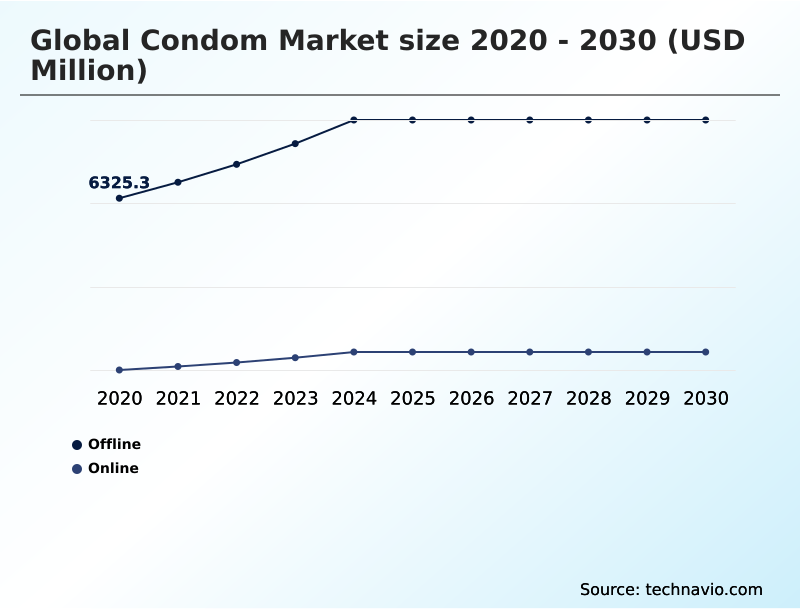
The Offline segment was valued at USD 8.69 billion in 2024 and showed a gradual increase during the forecast period.
Get Free Sample

Regional Analysis

APAC is estimated to contribute 42.9% to the growth of the global market during the forecast period.Technavio’s analysts have elaborately explained the regional trends and drivers that shape the market during the forecast period.
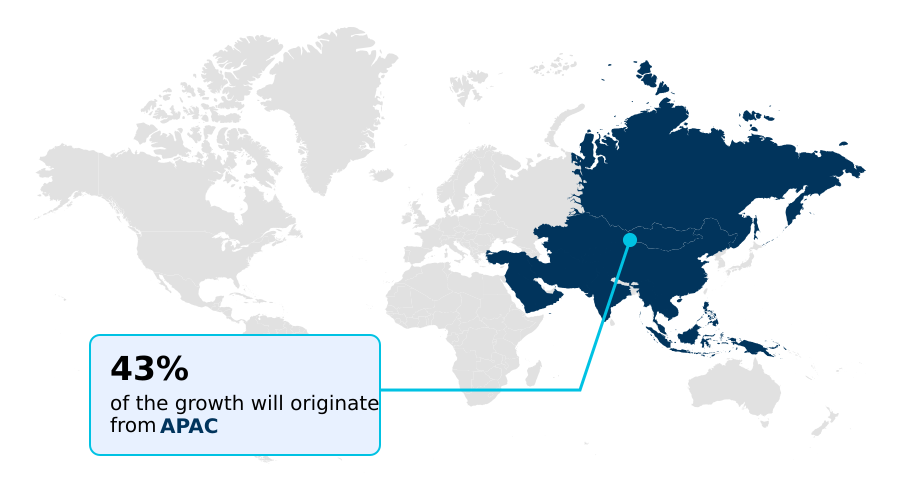
See How Condom Market Demand is Rising in APAC Get Free Sample

The geographic distribution within the Condom market reveals a distinct contrast in strategic procurement and consumer behavior across key regions.

APAC commands the highest production output, achieving a 35% efficiency advantage in manufacturing through localized sustainable rubber harvesting and optimized localized distribution mapping.

This regional scale supports massive family planning initiatives while driving the export of silicone-based friction reduction and water-based lubrication systems to Western territories.

In contrast, Europe heavily prioritizes ethical material sourcing and recycled paperboard packaging, leading to a 20% higher adoption rate for premium eco-conscious configurations. European consumers increasingly favor hypoallergenic nitrile shields and plant-based biomimetic textures, supporting reproductive health autonomy initiatives.

These shifting demographic preferences force multinational brands to adapt their regional inventory allocations, ensuring that high-margin synthetic alternatives meet specialized European safety directives while standard latex variations supply high-volume Asian medical networks.

Market Dynamics

Our researchers analyzed the data with 2025 as the base year, along with the key drivers, trends, and challenges. A holistic analysis of drivers will help companies refine their marketing strategies to gain a competitive advantage.

  • The operational framework of the Condom market is deeply influenced by advanced material science and automated manufacturing capabilities. To counter the escalating costs of natural resources, facilities are rapidly deploying automated multi-polymer dipping manufacturing lines.
  • This infrastructure transition allows manufacturers to alternate between standard latex and synthetic production seamlessly, achieving a 22% improvement in overall line efficiency compared to legacy single-material setups. Consequently, brands are successfully commercializing products engineered for ultra-thin non-latex heat transfer maximization, catering directly to premium consumer demographics.
  • Furthermore, the integration of hypersensitivity reducing synthetic nitrile engineering has expanded product accessibility for individuals with severe allergies, securing a highly lucrative niche. The structural integrity of these advanced variants is rigorously validated through electronic pinhole detection quality assurance, ensuring zero-defect compliance with international medical device regulations.
  • Simultaneously, the retail distribution matrix is evolving through discreet online subscription delivery fulfillment, eliminating physical retail friction and fostering brand loyalty. To align with modern environmental and social mandates, companies are progressively transitioning toward vegan certified natural rubber barrier production, utilizing sustainable processing agents that eliminate animal-derived byproducts and significantly lower the aggregate ecological footprint of sexual wellness portfolios.
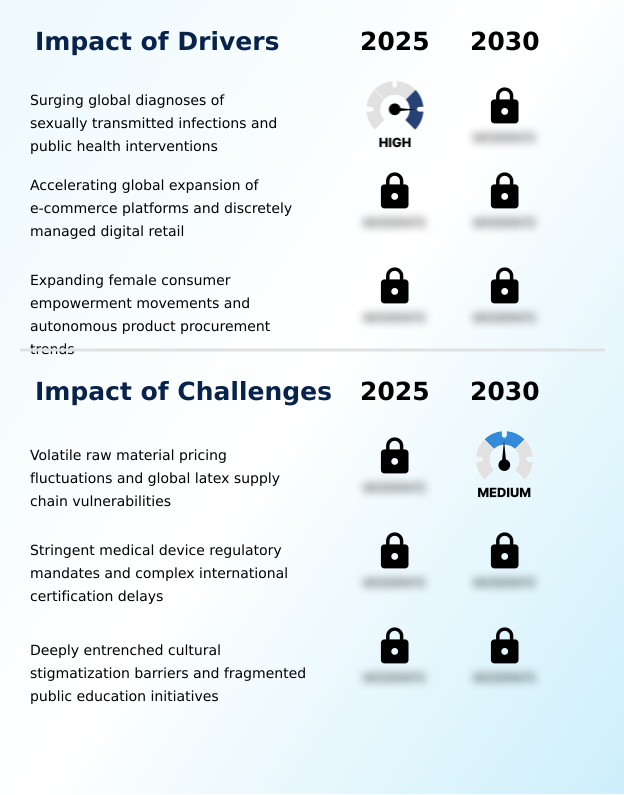
What are the key market drivers leading to the rise in the adoption of Condom Industry?

  • Surging global diagnoses of sexually transmitted infections and comprehensive public health interventions act as the primary market drivers.

  • Surging institutional demand and shifting digital consumer purchasing behaviors are systematically expanding the Condom market volume requirements.
  • The escalating need for disease transmission mitigation has prompted regional health ministries to expand their community wellness programs, accelerating the high-volume distribution of barrier contraceptive devices.
  • These institutional procurement contracts provide manufacturing networks with stable revenue floors, effectively improving factory throughput optimization by 22%.
  • Simultaneously, consumers are actively seeking plant-based processing agents, driving a 30% increase in the commercialization of vegan-certified compounding and casein-free natural rubber alternatives.
  • Traditional natural rubber latex variants remain a baseline, but automated subscription fulfillment networks completely eliminate in-store purchasing friction.
  • This direct-to-consumer digital infrastructure successfully increases recurring user retention rates by 15%, ensuring robust and continuous volume expansion across both medical and lifestyle distribution channels.

What are the market trends shaping the Condom Industry?

  • A rapid product transition toward ultra-thin polyurethane formulations and heightened sensual conductivity defines the upcoming market trend.

  • The Condom market is experiencing a structural evolution toward advanced manufacturing architectures and sensory-optimized material substitution. Manufacturers are rapidly deploying dual-polymer dipping lines within multi-polymer processing corridors to efficiently alternate between natural and synthetic production without operational downtime. This operational shift establishes structural cross-contamination prevention while allowing for the creation of ultra-thin polyurethane formulations and polyisoprene synthetic formulations.
  • By integrating eco-friendly agricultural latex, facilities have reduced water consumption metrics by 18%, significantly optimizing production efficiency. The resulting high-strength synthetic elasticity and rapid thermal adaptability directly improve the premium sensual performance demanded by modern consumers. Furthermore, the integration of automated checkout kiosks in physical retail has increased discreet transaction velocities by 25%.
  • These technological and material upgrades allow personal care companies to capture higher margins while aligning with evolving consumer preferences.

What challenges does the Condom Industry face during its growth?

  • Volatile raw material pricing fluctuations and systemic vulnerabilities within the global latex supply chain present significant industry challenges.

  • Systemic supply chain volatility and tightening medical regulatory frameworks impose severe operational constraints on the Condom market. Agricultural disruptions and climate-induced delays in maritime freight logistics severely limit raw latex yield optimization, driving baseline material procurement costs up by 18%. To navigate these deficits, manufacturers must deploy sophisticated chemical viscosity scanners to prevent material degradation during extended transport.
  • Furthermore, escalating medical device compliance mandates require exhaustive biocompatibility testing protocols and strict shelf-life stability testing before commercial release. Regulatory bodies now enforce nitrosamine-free chemistry and advanced dermatological irritation protocols, forcing compounding laboratories to continuously reformulate baseline solutions.
  • These administrative hurdles extend product development lifecycles, while the mandatory implementation of zero-defect electronic pinhole detection to guarantee structural burst-strength integrity increases quality assurance expenditures by 12% across high-volume production facilities.

Exclusive Technavio Analysis on Customer Landscape

The condom market forecasting report includes the adoption lifecycle of the market, covering from the innovator’s stage to the laggard’s stage. It focuses on adoption rates in different regions based on penetration. Furthermore, the condom market report also includes key purchase criteria and drivers of price sensitivity to help companies evaluate and develop their market growth analysis strategies.
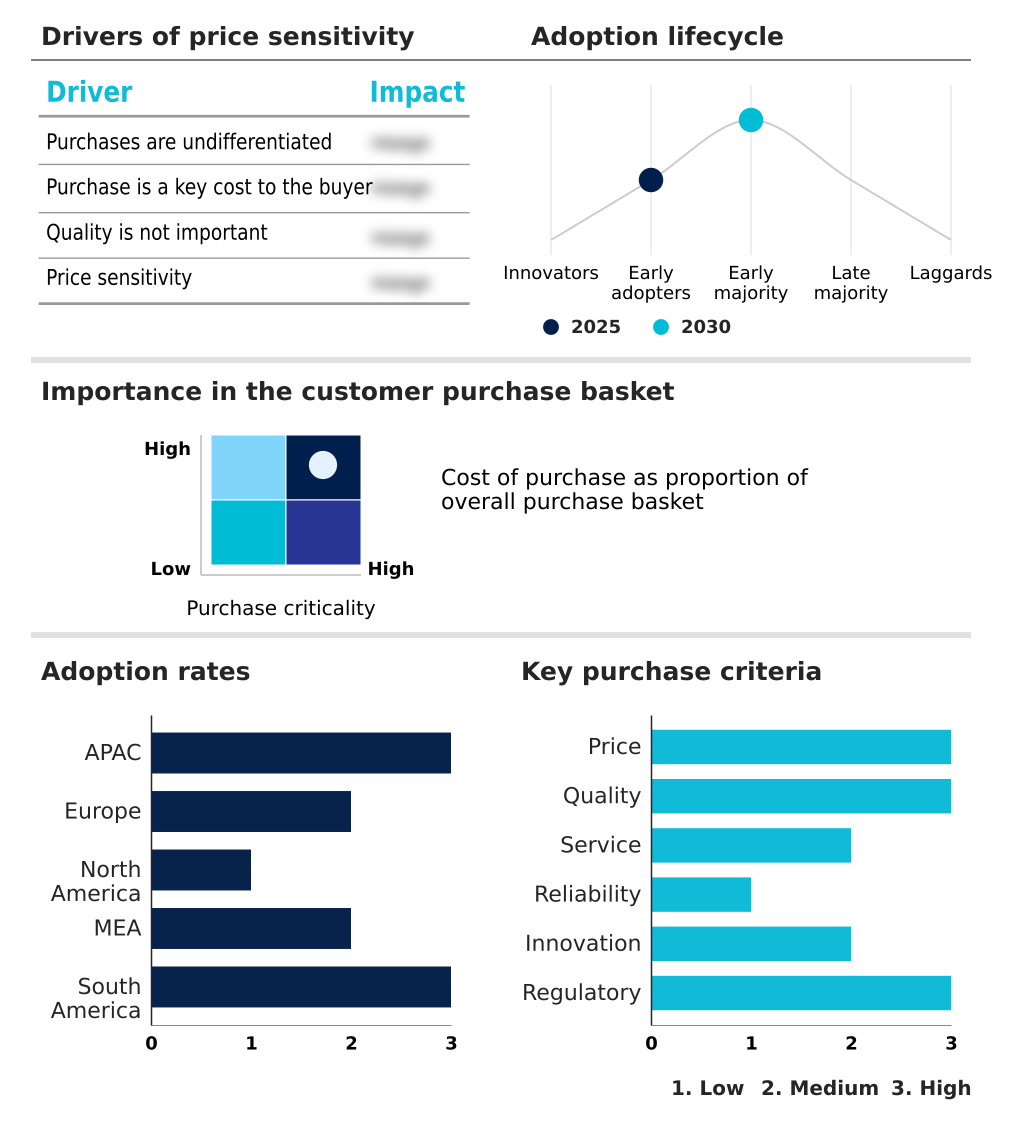
Customer Landscape of Condom Industry

Competitive Landscape

Companies are implementing various strategies, such as strategic alliances, condom market forecast, partnerships, mergers and acquisitions, geographical expansion, and product/service launches, to enhance their presence in the industry.

China Tianjin Recare Co. Ltd. - Provides specialized barrier protections including ultra-thin, ribbed, and dotted latex variants designed to optimize sensory performance and ensure rigorous physiological safety during intimate use.

The industry research and growth report includes detailed analyses of the competitive landscape of the market and information about key companies, including:

  • China Tianjin Recare Co. Ltd.
  • Church and Dwight Co. Inc.
  • Cupid Ltd.
  • Fuji Latex Co. Ltd
  • Global Protection Corp.
  • Guilin HBM Health Protections
  • HLL Lifecare Ltd.
  • LifeStyles Healthcare Pte. Ltd.
  • Mankind Pharma Ltd.
  • Okamoto Industries Inc.
  • Pasante Healthcare Ltd.
  • R and S Consumer Goods GmbH
  • Reckitt Benckiser Group Plc
  • Ritex GmbH
  • Sagami Rubber Industries Co. Ltd.
  • Thai Nippon Rubber Industry Co
  • Veru Inc.
  • Winner Medical Co. Ltd.

Qualitative and quantitative analysis of companies has been conducted to help clients understand the wider business environment as well as the strengths and weaknesses of key industry players. Data is qualitatively analyzed to categorize companies as pure play, category-focused, industry-focused, and diversified; it is quantitatively analyzed to categorize companies as dominant, leading, strong, tentative, and weak.

Recent Development and News in Condom market

  • In the Personal Care Products industry, the widespread commercial adoption of automated digital subscription platforms has optimized discreet direct-to-consumer fulfillment, directly impacting Condom demand by increasing recurring consumer retention rates by 15%.
  • The implementation of strict European Medical Device Regulation biocompatibility standards has forced manufacturers to eliminate harmful chemical accelerators, increasing the demand for Condom variants utilizing nitrosamine-free chemistry.
  • In the Personal Care Products industry, the structural transition toward cruelty-free manufacturing certifications has accelerated the development of plant-based compounding processes, driving Condom market expansion across eco-conscious consumer demographics.
  • The persistent climate-induced disruption of Southeast Asian agricultural supply chains has limited natural rubber yields, prompting a 20% capacity expansion in synthetic multi-polymer processing lines to stabilize Condom production volumes.

Dive into Technavio’s robust research methodology, blending expert interviews, extensive data synthesis, and validated models for unparalleled Condom Market insights. See full methodology.

Market Scope
Page number 286
Base year 2025
Historic period 2020-2024
Forecast period 2026-2030
Growth momentum & CAGR Accelerate at a CAGR of 11.6%
Market growth 2026-2030 USD 8328.8 million
Market structure Fragmented
YoY growth 2025-2026(%) 10.4%
Key countries China, India, Japan, South Korea, Indonesia, Australia, Germany, UK, France, Italy, Spain, The Netherlands, US, Canada, Mexico, South Africa, Turkey, Saudi Arabia, UAE, Israel, Brazil, Argentina and Chile
Competitive landscape Leading Companies, Market Positioning of Companies, Competitive Strategies, and Industry Risks

Request Free Sample

Research Analyst Overview

  • The Condom market operates at the critical intersection of advanced polymer engineering, discrete digital commerce, and proactive preventative healthcare. Corporate entities are systematically diversifying their manufacturing capabilities by deploying dual-polymer dipping lines and processing eco-friendly agricultural latex to stabilize supply chains against agricultural volatility.
  • This transition directly enables the commercialization of ultra-thin polyurethane formulations and polyisoprene synthetic formulations, which cater to rising consumer demand for heightened sensory experiences. By integrating automated subscription fulfillment networks, digital retailers have reduced customer acquisition friction, improving recurring revenue retention by 18%.
  • Additionally, stringent biocompatibility testing protocols and electronic pinhole detection systems act as non-negotiable standards ensuring absolute structural safety. These strategic operational upgrades allow manufacturers to fulfill high-volume institutional contracts while consistently preserving premium profit margins across highly competitive private retail sectors.

What are the Key Data Covered in this Condom Market Research and Growth Report?

  • What is the expected growth of the Condom Market between 2026 and 2030?

    • USD 8.33 billion, at a CAGR of 11.6%

  • What segmentation does the market report cover?

    • The report is segmented by Distribution Channel (Offline, and Online), Material (Latex, and Non latex), Product (Male condoms, and Female condoms) and Geography (APAC, Europe, North America, Middle East and Africa, South America)

  • Which regions are analyzed in the report?

    • APAC, Europe, North America, Middle East and Africa and South America

  • What are the key growth drivers and market challenges?

    • Surging global diagnoses of sexually transmitted infections and public health interventions, Volatile raw material pricing fluctuations and global latex supply chain vulnerabilities

  • Who are the major players in the Condom Market?

    • China Tianjin Recare Co. Ltd., Church and Dwight Co. Inc., Cupid Ltd., Fuji Latex Co. Ltd, Global Protection Corp., Guilin HBM Health Protections, HLL Lifecare Ltd., LifeStyles Healthcare Pte. Ltd., Mankind Pharma Ltd., Okamoto Industries Inc., Pasante Healthcare Ltd., R and S Consumer Goods GmbH, Reckitt Benckiser Group Plc, Ritex GmbH, Sagami Rubber Industries Co. Ltd., Thai Nippon Rubber Industry Co, Veru Inc. and Winner Medical Co. Ltd.

Market Research Insights

  • The Condom market is characterized by a rapid technological transition toward advanced synthetic materials and highly discreet digital retail networks. Market dynamics are structurally defined by the rising institutional procurement of barrier contraceptive devices to support extensive family planning and disease transmission mitigation programs.
  • To counter social purchasing friction, physical retailers have heavily invested in automated checkout kiosks, which have successfully improved transaction completion rates by 18%. Furthermore, strict medical compliance mandates require comprehensive shelf-life stability testing, pushing compounding laboratories to engineer advanced solutions without compromising safety.
  • These continuous material optimizations deliver the premium sensual performance demanded by consumers, effectively securing brand loyalty while maximizing commercial revenue across shifting retail environments.

We can help! Our analysts can customize this condom market research report to meet your requirements.

Get in touch

1. Executive Summary

1.1 Market overview

Executive Summary - Chart on Market Overview
Executive Summary - Data Table on Market Overview
Executive Summary - Chart on Global Market Characteristics
Executive Summary - Chart on Market by Geography
Executive Summary - Chart on Market Segmentation by Distribution Channel
Executive Summary - Chart on Market Segmentation by Material
Executive Summary - Chart on Market Segmentation by Product
Executive Summary - Chart on Incremental Growth
Executive Summary - Data Table on Incremental Growth
Executive Summary - Chart on Company Market Positioning

2. Technavio Analysis

2.1 Analysis of price sensitivity, lifecycle, customer purchase basket, adoption rates, and purchase criteria

2.2 Criticality of inputs and Factors of differentiation

Chart on Overview on criticality of inputs and factors of differentiation

2.3 Factors of disruption

Chart on Overview on factors of disruption

2.4 Impact of drivers and challenges

Chart on Impact of drivers and challenges in 2025 and 2030

3. Market Landscape

3.1 Market ecosystem

Chart on Parent Market
Data Table on - Parent Market

3.2 Market characteristics

Chart on Market characteristics analysis

3.3 Value chain analysis

Chart on Value chain analysis

4. Market Sizing

4.1 Market definition

Data Table on Offerings of companies included in the market definition

4.2 Market segment analysis

Market segments

4.3 Market size 2025

4.4 Market outlook: Forecast for 2025-2030

Chart on Global - Market size and forecast 2025-2030 ($ million)
Data Table on Global - Market size and forecast 2025-2030 ($ million)
Chart on Global Market: Year-over-year growth 2025-2030 (%)
Data Table on Global Market: Year-over-year growth 2025-2030 (%)

5. Historic Market Size

5.1 Global Condom Market 2020 - 2024

Historic Market Size - Data Table on Global Condom Market 2020 - 2024 ($ million)

5.2 Distribution Channel segment analysis 2020 - 2024

Historic Market Size - Distribution Channel Segment 2020 - 2024 ($ million)

5.3 Material segment analysis 2020 - 2024

Historic Market Size - Material Segment 2020 - 2024 ($ million)

5.4 Product segment analysis 2020 - 2024

Historic Market Size - Product Segment 2020 - 2024 ($ million)

5.5 Geography segment analysis 2020 - 2024

Historic Market Size - Geography Segment 2020 - 2024 ($ million)

5.6 Country segment analysis 2020 - 2024

Historic Market Size - Country Segment 2020 - 2024 ($ million)

6. Qualitative Analysis

6.1 Impact of AI on global condom market

6.2 Impact of geopolitical conflicts on global condom market

7. Five Forces Analysis

7.1 Five forces summary

Five forces analysis - Comparison between 2025 and 2030

7.2 Bargaining power of buyers

Bargaining power of buyers - Impact of key factors 2025 and 2030

7.3 Bargaining power of suppliers

Bargaining power of suppliers - Impact of key factors in 2025 and 2030

7.4 Threat of new entrants

Threat of new entrants - Impact of key factors in 2025 and 2030

7.5 Threat of substitutes

Threat of substitutes - Impact of key factors in 2025 and 2030

7.6 Threat of rivalry

Threat of rivalry - Impact of key factors in 2025 and 2030

7.7 Market condition

Chart on Market condition - Five forces 2025 and 2030

8. Market Segmentation by Distribution Channel

8.1 Market segments

Chart on Distribution Channel - Market share 2025-2030 (%)
Data Table on Distribution Channel - Market share 2025-2030 (%)

8.2 Comparison by Distribution Channel

Chart on Comparison by Distribution Channel
Data Table on Comparison by Distribution Channel

8.3 Offline - Market size and forecast 2025-2030

Chart on Offline - Market size and forecast 2025-2030 ($ million)
Data Table on Offline - Market size and forecast 2025-2030 ($ million)
Chart on Offline - Year-over-year growth 2025-2030 (%)
Data Table on Offline - Year-over-year growth 2025-2030 (%)

8.4 Online - Market size and forecast 2025-2030

Chart on Online - Market size and forecast 2025-2030 ($ million)
Data Table on Online - Market size and forecast 2025-2030 ($ million)
Chart on Online - Year-over-year growth 2025-2030 (%)
Data Table on Online - Year-over-year growth 2025-2030 (%)

8.5 Market opportunity by Distribution Channel

Market opportunity by Distribution Channel ($ million)
Data Table on Market opportunity by Distribution Channel ($ million)

9. Market Segmentation by Material

9.1 Market segments

Chart on Material - Market share 2025-2030 (%)
Data Table on Material - Market share 2025-2030 (%)

9.2 Comparison by Material

Chart on Comparison by Material
Data Table on Comparison by Material

9.3 Latex - Market size and forecast 2025-2030

Chart on Latex - Market size and forecast 2025-2030 ($ million)
Data Table on Latex - Market size and forecast 2025-2030 ($ million)
Chart on Latex - Year-over-year growth 2025-2030 (%)
Data Table on Latex - Year-over-year growth 2025-2030 (%)

9.4 Non latex - Market size and forecast 2025-2030

Chart on Non latex - Market size and forecast 2025-2030 ($ million)
Data Table on Non latex - Market size and forecast 2025-2030 ($ million)
Chart on Non latex - Year-over-year growth 2025-2030 (%)
Data Table on Non latex - Year-over-year growth 2025-2030 (%)

9.5 Market opportunity by Material

Market opportunity by Material ($ million)
Data Table on Market opportunity by Material ($ million)

10. Market Segmentation by Product

10.1 Market segments

Chart on Product - Market share 2025-2030 (%)
Data Table on Product - Market share 2025-2030 (%)

10.2 Comparison by Product

Chart on Comparison by Product
Data Table on Comparison by Product

10.3 Male condoms - Market size and forecast 2025-2030

Chart on Male condoms - Market size and forecast 2025-2030 ($ million)
Data Table on Male condoms - Market size and forecast 2025-2030 ($ million)
Chart on Male condoms - Year-over-year growth 2025-2030 (%)
Data Table on Male condoms - Year-over-year growth 2025-2030 (%)

10.4 Female condoms - Market size and forecast 2025-2030

Chart on Female condoms - Market size and forecast 2025-2030 ($ million)
Data Table on Female condoms - Market size and forecast 2025-2030 ($ million)
Chart on Female condoms - Year-over-year growth 2025-2030 (%)
Data Table on Female condoms - Year-over-year growth 2025-2030 (%)

10.5 Market opportunity by Product

Market opportunity by Product ($ million)
Data Table on Market opportunity by Product ($ million)

11. Customer Landscape

11.1 Customer landscape overview

Analysis of price sensitivity, lifecycle, customer purchase basket, adoption rates, and purchase criteria

12. Geographic Landscape

12.1 Geographic segmentation

Chart on Market share by geography 2025-2030 (%)
Data Table on Market share by geography 2025-2030 (%)

12.2 Geographic comparison

Chart on Geographic comparison
Data Table on Geographic comparison

12.3 APAC - Market size and forecast 2025-2030

Chart on APAC - Market size and forecast 2025-2030 ($ million)
Data Table on APAC - Market size and forecast 2025-2030 ($ million)
Chart on APAC - Year-over-year growth 2025-2030 (%)
Data Table on APAC - Year-over-year growth 2025-2030 (%)
Chart on Regional Comparison - APAC
Data Table on Regional Comparison - APAC

12.3.1 China - Market size and forecast 2025-2030

Chart on China - Market size and forecast 2025-2030 ($ million)
Data Table on China - Market size and forecast 2025-2030 ($ million)
Chart on China - Year-over-year growth 2025-2030 (%)
Data Table on China - Year-over-year growth 2025-2030 (%)

12.3.2 India - Market size and forecast 2025-2030

Chart on India - Market size and forecast 2025-2030 ($ million)
Data Table on India - Market size and forecast 2025-2030 ($ million)
Chart on India - Year-over-year growth 2025-2030 (%)
Data Table on India - Year-over-year growth 2025-2030 (%)

12.3.3 Japan - Market size and forecast 2025-2030

Chart on Japan - Market size and forecast 2025-2030 ($ million)
Data Table on Japan - Market size and forecast 2025-2030 ($ million)
Chart on Japan - Year-over-year growth 2025-2030 (%)
Data Table on Japan - Year-over-year growth 2025-2030 (%)

12.3.4 South Korea - Market size and forecast 2025-2030

Chart on South Korea - Market size and forecast 2025-2030 ($ million)
Data Table on South Korea - Market size and forecast 2025-2030 ($ million)
Chart on South Korea - Year-over-year growth 2025-2030 (%)
Data Table on South Korea - Year-over-year growth 2025-2030 (%)

12.3.5 Indonesia - Market size and forecast 2025-2030

Chart on Indonesia - Market size and forecast 2025-2030 ($ million)
Data Table on Indonesia - Market size and forecast 2025-2030 ($ million)
Chart on Indonesia - Year-over-year growth 2025-2030 (%)
Data Table on Indonesia - Year-over-year growth 2025-2030 (%)

12.3.6 Australia - Market size and forecast 2025-2030

Chart on Australia - Market size and forecast 2025-2030 ($ million)
Data Table on Australia - Market size and forecast 2025-2030 ($ million)
Chart on Australia - Year-over-year growth 2025-2030 (%)
Data Table on Australia - Year-over-year growth 2025-2030 (%)

12.4 Europe - Market size and forecast 2025-2030

Chart on Europe - Market size and forecast 2025-2030 ($ million)
Data Table on Europe - Market size and forecast 2025-2030 ($ million)
Chart on Europe - Year-over-year growth 2025-2030 (%)
Data Table on Europe - Year-over-year growth 2025-2030 (%)
Chart on Regional Comparison - Europe
Data Table on Regional Comparison - Europe

12.4.1 Germany - Market size and forecast 2025-2030

Chart on Germany - Market size and forecast 2025-2030 ($ million)
Data Table on Germany - Market size and forecast 2025-2030 ($ million)
Chart on Germany - Year-over-year growth 2025-2030 (%)
Data Table on Germany - Year-over-year growth 2025-2030 (%)

12.4.2 UK - Market size and forecast 2025-2030

Chart on UK - Market size and forecast 2025-2030 ($ million)
Data Table on UK - Market size and forecast 2025-2030 ($ million)
Chart on UK - Year-over-year growth 2025-2030 (%)
Data Table on UK - Year-over-year growth 2025-2030 (%)

12.4.3 France - Market size and forecast 2025-2030

Chart on France - Market size and forecast 2025-2030 ($ million)
Data Table on France - Market size and forecast 2025-2030 ($ million)
Chart on France - Year-over-year growth 2025-2030 (%)
Data Table on France - Year-over-year growth 2025-2030 (%)

12.4.4 Italy - Market size and forecast 2025-2030

Chart on Italy - Market size and forecast 2025-2030 ($ million)
Data Table on Italy - Market size and forecast 2025-2030 ($ million)
Chart on Italy - Year-over-year growth 2025-2030 (%)
Data Table on Italy - Year-over-year growth 2025-2030 (%)

12.4.5 Spain - Market size and forecast 2025-2030

Chart on Spain - Market size and forecast 2025-2030 ($ million)
Data Table on Spain - Market size and forecast 2025-2030 ($ million)
Chart on Spain - Year-over-year growth 2025-2030 (%)
Data Table on Spain - Year-over-year growth 2025-2030 (%)

12.4.6 The Netherlands - Market size and forecast 2025-2030

Chart on The Netherlands - Market size and forecast 2025-2030 ($ million)
Data Table on The Netherlands - Market size and forecast 2025-2030 ($ million)
Chart on The Netherlands - Year-over-year growth 2025-2030 (%)
Data Table on The Netherlands - Year-over-year growth 2025-2030 (%)

12.5 North America - Market size and forecast 2025-2030

Chart on North America - Market size and forecast 2025-2030 ($ million)
Data Table on North America - Market size and forecast 2025-2030 ($ million)
Chart on North America - Year-over-year growth 2025-2030 (%)
Data Table on North America - Year-over-year growth 2025-2030 (%)
Chart on Regional Comparison - North America
Data Table on Regional Comparison - North America

12.5.1 US - Market size and forecast 2025-2030

Chart on US - Market size and forecast 2025-2030 ($ million)
Data Table on US - Market size and forecast 2025-2030 ($ million)
Chart on US - Year-over-year growth 2025-2030 (%)
Data Table on US - Year-over-year growth 2025-2030 (%)

12.5.2 Canada - Market size and forecast 2025-2030

Chart on Canada - Market size and forecast 2025-2030 ($ million)
Data Table on Canada - Market size and forecast 2025-2030 ($ million)
Chart on Canada - Year-over-year growth 2025-2030 (%)
Data Table on Canada - Year-over-year growth 2025-2030 (%)

12.5.3 Mexico - Market size and forecast 2025-2030

Chart on Mexico - Market size and forecast 2025-2030 ($ million)
Data Table on Mexico - Market size and forecast 2025-2030 ($ million)
Chart on Mexico - Year-over-year growth 2025-2030 (%)
Data Table on Mexico - Year-over-year growth 2025-2030 (%)

12.6 Middle East and Africa - Market size and forecast 2025-2030

Chart on Middle East and Africa - Market size and forecast 2025-2030 ($ million)
Data Table on Middle East and Africa - Market size and forecast 2025-2030 ($ million)
Chart on Middle East and Africa - Year-over-year growth 2025-2030 (%)
Data Table on Middle East and Africa - Year-over-year growth 2025-2030 (%)
Chart on Regional Comparison - Middle East and Africa
Data Table on Regional Comparison - Middle East and Africa

12.6.1 South Africa - Market size and forecast 2025-2030

Chart on South Africa - Market size and forecast 2025-2030 ($ million)
Data Table on South Africa - Market size and forecast 2025-2030 ($ million)
Chart on South Africa - Year-over-year growth 2025-2030 (%)
Data Table on South Africa - Year-over-year growth 2025-2030 (%)

12.6.2 Turkey - Market size and forecast 2025-2030

Chart on Turkey - Market size and forecast 2025-2030 ($ million)
Data Table on Turkey - Market size and forecast 2025-2030 ($ million)
Chart on Turkey - Year-over-year growth 2025-2030 (%)
Data Table on Turkey - Year-over-year growth 2025-2030 (%)

12.6.3 Saudi Arabia - Market size and forecast 2025-2030

Chart on Saudi Arabia - Market size and forecast 2025-2030 ($ million)
Data Table on Saudi Arabia - Market size and forecast 2025-2030 ($ million)
Chart on Saudi Arabia - Year-over-year growth 2025-2030 (%)
Data Table on Saudi Arabia - Year-over-year growth 2025-2030 (%)

12.6.4 UAE - Market size and forecast 2025-2030

Chart on UAE - Market size and forecast 2025-2030 ($ million)
Data Table on UAE - Market size and forecast 2025-2030 ($ million)
Chart on UAE - Year-over-year growth 2025-2030 (%)
Data Table on UAE - Year-over-year growth 2025-2030 (%)

12.6.5 Israel - Market size and forecast 2025-2030

Chart on Israel - Market size and forecast 2025-2030 ($ million)
Data Table on Israel - Market size and forecast 2025-2030 ($ million)
Chart on Israel - Year-over-year growth 2025-2030 (%)
Data Table on Israel - Year-over-year growth 2025-2030 (%)

12.7 South America - Market size and forecast 2025-2030

Chart on South America - Market size and forecast 2025-2030 ($ million)
Data Table on South America - Market size and forecast 2025-2030 ($ million)
Chart on South America - Year-over-year growth 2025-2030 (%)
Data Table on South America - Year-over-year growth 2025-2030 (%)
Chart on Regional Comparison - South America
Data Table on Regional Comparison - South America

12.7.1 Brazil - Market size and forecast 2025-2030

Chart on Brazil - Market size and forecast 2025-2030 ($ million)
Data Table on Brazil - Market size and forecast 2025-2030 ($ million)
Chart on Brazil - Year-over-year growth 2025-2030 (%)
Data Table on Brazil - Year-over-year growth 2025-2030 (%)

12.7.2 Argentina - Market size and forecast 2025-2030

Chart on Argentina - Market size and forecast 2025-2030 ($ million)
Data Table on Argentina - Market size and forecast 2025-2030 ($ million)
Chart on Argentina - Year-over-year growth 2025-2030 (%)
Data Table on Argentina - Year-over-year growth 2025-2030 (%)

12.7.3 Chile - Market size and forecast 2025-2030

Chart on Chile - Market size and forecast 2025-2030 ($ million)
Data Table on Chile - Market size and forecast 2025-2030 ($ million)
Chart on Chile - Year-over-year growth 2025-2030 (%)
Data Table on Chile - Year-over-year growth 2025-2030 (%)

12.8 Market opportunity by geography

Market opportunity by geography ($ million)
Data Tables on Market opportunity by geography ($ million)

13. Drivers, Challenges, and Opportunity

13.1 Market drivers

Surging global diagnoses of sexually transmitted infections and public health interventions
Accelerating global expansion of e-commerce platforms and discretely managed digital retail
Expanding female consumer empowerment movements and autonomous product procurement trends

13.2 Market challenges

Volatile raw material pricing fluctuations and global latex supply chain vulnerabilities
Stringent medical device regulatory mandates and complex international certification delays
Deeply entrenched cultural stigmatization barriers and fragmented public education initiatives

13.3 Impact of drivers and challenges

Impact of drivers and challenges in 2025 and 2030

13.4 Market opportunities

Rapid product transition toward ultra-thin polyurethane formulations and heightened sensual conductivity
Widespread commercialization of sustainable plant-based formulations and cruelty-free manufacturing practices
Rapid technical development of custom nitrile formulations and multi-polymer dipping infrastructures

14. Competitive Landscape

14.1 Overview

14.2

Overview on criticality of inputs and factors of differentiation

14.3 Landscape disruption

Overview on factors of disruption

14.4 Industry risks

Impact of key risks on business

15. Competitive Analysis

15.1 Companies profiled

Companies covered

15.2 Company ranking index

15.3 Market positioning of companies

Matrix on companies position and classification

15.4 China Tianjin Recare Co. Ltd.

China Tianjin Recare Co. Ltd. - Overview
China Tianjin Recare Co. Ltd. - Product / Service
China Tianjin Recare Co. Ltd. - Key offerings
SWOT

15.5 Church and Dwight Co. Inc.

Church and Dwight Co. Inc. - Overview
Church and Dwight Co. Inc. - Business segments
Church and Dwight Co. Inc. - Key offerings
Church and Dwight Co. Inc. - Segment focus
SWOT

15.6 Cupid Ltd.

Cupid Ltd. - Overview
Cupid Ltd. - Product / Service
Cupid Ltd. - Key offerings
SWOT

15.7 Fuji Latex Co. Ltd

Fuji Latex Co. Ltd - Overview
Fuji Latex Co. Ltd - Product / Service
Fuji Latex Co. Ltd - Key offerings
SWOT

15.8 Guilin HBM Health Protections

Guilin HBM Health Protections - Overview
Guilin HBM Health Protections - Product / Service
Guilin HBM Health Protections - Key offerings
SWOT

15.9 HLL Lifecare Ltd.

HLL Lifecare Ltd. - Overview
HLL Lifecare Ltd. - Product / Service
HLL Lifecare Ltd. - Key offerings
SWOT

15.10 LifeStyles Healthcare Pte. Ltd.

LifeStyles Healthcare Pte. Ltd. - Overview
LifeStyles Healthcare Pte. Ltd. - Product / Service
LifeStyles Healthcare Pte. Ltd. - Key offerings
SWOT

15.11 Mankind Pharma Ltd.

Mankind Pharma Ltd. - Overview
Mankind Pharma Ltd. - Business segments
Mankind Pharma Ltd. - Key news
Mankind Pharma Ltd. - Key offerings
Mankind Pharma Ltd. - Segment focus
SWOT

15.12 Okamoto Industries Inc.

Okamoto Industries Inc. - Overview
Okamoto Industries Inc. - Business segments
Okamoto Industries Inc. - Key offerings
Okamoto Industries Inc. - Segment focus
SWOT

15.13 R and S Consumer Goods GmbH

R and S Consumer Goods GmbH - Overview
R and S Consumer Goods GmbH - Product / Service
R and S Consumer Goods GmbH - Key offerings
SWOT

15.14 Reckitt Benckiser Group Plc

Reckitt Benckiser Group Plc - Overview
Reckitt Benckiser Group Plc - Business segments
Reckitt Benckiser Group Plc - Key offerings
Reckitt Benckiser Group Plc - Segment focus
SWOT

15.15 Ritex GmbH

Ritex GmbH - Overview
Ritex GmbH - Product / Service
Ritex GmbH - Key offerings
SWOT

15.16 Sagami Rubber Industries Co. Ltd.

Sagami Rubber Industries Co. Ltd. - Overview
Sagami Rubber Industries Co. Ltd. - Business segments
Sagami Rubber Industries Co. Ltd. - Key offerings
Sagami Rubber Industries Co. Ltd. - Segment focus
SWOT

15.17 Thai Nippon Rubber Industry Co

Thai Nippon Rubber Industry Co - Overview
Thai Nippon Rubber Industry Co - Business segments
Thai Nippon Rubber Industry Co - Key offerings
Thai Nippon Rubber Industry Co - Segment focus
SWOT

15.18 Winner Medical Co. Ltd.

Winner Medical Co. Ltd. - Overview
Winner Medical Co. Ltd. - Product / Service
Winner Medical Co. Ltd. - Key offerings
SWOT

16. Appendix

16.1 Scope of the report

Market definition
Objectives
Notes and caveats

16.2 Inclusions and exclusions checklist

Inclusions checklist
Exclusions checklist

16.3 Currency conversion rates for US$

16.4 Research methodology

16.5 Data procurement

Information sources

16.6 Data validation

16.7 Validation techniques employed for market sizing

16.8 Data synthesis

16.9 360 degree market analysis

16.10 List of abbreviations

Research Methodology

Technavio presents a detailed picture of the market by way of study, synthesis, and summation of data from multiple sources. The analysts have presented the various facets of the market with a particular focus on identifying the key industry influencers. The data thus presented is comprehensive, reliable, and the result of extensive research, both primary and secondary.

INFORMATION SOURCES

Primary sources

  • Manufacturers and suppliers
  • Channel partners
  • Industry experts
  • Strategic decision makers

Secondary sources

  • Industry journals and periodicals
  • Government data
  • Financial reports of key industry players
  • Historical data
  • Press releases

DATA ANALYSIS

Data Synthesis

  • Collation of data
  • Estimation of key figures
  • Analysis of derived insights

Data Validation

  • Triangulation with data models
  • Reference against proprietary databases
  • Corroboration with industry experts

REPORT WRITING

Qualitative

  • Market drivers
  • Market challenges
  • Market trends
  • Five forces analysis

Quantitative

  • Market size and forecast
  • Market segmentation
  • Geographical insights
  • Competitive landscape

Interested in this report?

Get your sample now to see our research methodology and insights!

Download Now

Frequently Asked Questions

Condom market growth will increase by USD 8328.8 million during 2026-2030.

The Condom market is expected to grow at a CAGR of 11.6% during 2026-2030.

Condom market is segmented by Distribution channel (Offline, Online) Material (Latex, Non latex) Product (Male condoms, Female condoms)

China Tianjin Recare Co. Ltd., Church and Dwight Co. Inc., Cupid Ltd., Fuji Latex Co. Ltd, Global Protection Corp., Guilin HBM Health Protections, HLL Lifecare Ltd., LifeStyles Healthcare Pte. Ltd., Mankind Pharma Ltd., Okamoto Industries Inc., Pasante Healthcare Ltd., R and S Consumer Goods GmbH, Reckitt Benckiser Group Plc, Ritex GmbH, Sagami Rubber Industries Co. Ltd., Thai Nippon Rubber Industry Co, Veru Inc., Winner Medical Co. Ltd. are a few of the key vendors in the Condom market.

APAC will register the highest growth rate of 42.9% among the other regions. Therefore, the Condom market in APAC is expected to garner significant business opportunities for the vendors during the forecast period.

China, India, Japan, South Korea, Indonesia, Australia, Germany, UK, France, Italy, Spain, The Netherlands, US, Canada, Mexico, South Africa, Turkey, Saudi Arabia, UAE, Israel, Brazil, Argentina, Chile

  • Surging global diagnoses of sexually transmitted infections and public health interventions is the driving factor this market.

The Condom market vendors should focus on grabbing business opportunities from the Distribution channel segment as it accounted for the largest market share in the base year.
RIA - Research AI Assistant
Ask RIA
